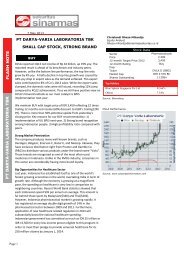
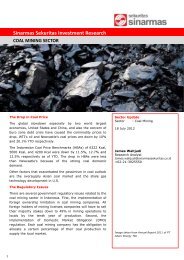
<strong>PT</strong> A<strong>STRA</strong> O<strong>TOPAR</strong>TS <strong>Tbk</strong> <strong>COMP</strong>A<strong>NY</strong> <strong>UPD</strong><strong>ATE</strong>Table 2: Income Statement Summary2009 2010 2011 2012E 2013F 2014F 2015FRevenues 5,265,798 6,255,109 7,363,659 8,677,855 10,294,701 12,432,417 14,918,900Cost of Revenue 4,317,181 5,102,483 6,126,058 7,263,364 8,565,191 10,343,771 12,397,606Gross Profit 948,617 1,152,626 1,237,601 1,414,490 1,729,510 2,088,646 2,521,294SG&A 508,626 579,511 718,053 764,345 906,984 1,074,171 1,284,321EBIT 439,991 573,115 519,548 650,145 822,525 1,014,475 1,236,973Other non-operating income 56,242 32,108 38,090 46,000 55,200 65,173 76,981interest, net -14,493 -109,038 -133,693 -132,607 -107,972 -102,242 -74,402Equity linked, net income 509,774 761,161 693,786 793,535 872,888 977,635 1,094,951Profit before tax 967,001 1,391,264 1,255,083 1,394,447 1,599,811 1,905,502 2,279,152Taxation -137,046 -168,956 -153,500 -162,246 -196,269 -250,524 -319,734Profit after tax 829,955 1,222,308 1,101,583 1,232,200 1,403,541 1,654,978 1,959,418Minorities -41,690 -84,126 -88,364 -104,134 -123,536 -149,189 -179,027Net Profit 788,265 1,138,182 1,013,219 1,128,066 1,280,005 1,505,789 1,780,391Gross Margin 18.01% 18.43% 16.81% 16.30% 16.80% 16.80% 16.90%EBITDA margin 10.14% 11.19% 9.20% 9.79% 10.49% 10.66% 10.79%EBIT Margin 8.36% 9.16% 7.06% 7.49% 7.99% 8.16% 8.29%NOPAT Margin 5.85% 6.71% 5.13% 5.47% 5.83% 0.00% 0.00%Net Margin 5.29% 6.03% 4.34% 3.86% 3.95% 4.25% 4.59%Revenue Growth -1.35% 18.79% 17.72% 17.85% 18.63% 20.77% 20.00%EBITDA Growth 0.35% 31.07% -3.22% 25.46% 27.09% 22.72% 21.48%EBIT Growth -2.63% 30.26% -9.35% 25.14% 26.51% 23.34% 21.93%Net Profit Growth 39.26% 44.39% -10.98% 11.33% 13.47% 17.64% 18.24%Source: Company data, <strong>Sinarmas</strong> SekuritasChart 17: Net Income in Jointly Controlled Entities—overallremained stagnant with new investments registering netloss. We foresee <strong>PT</strong> Evoluzione Tyres will registersignificant loss too in the coming quarter due to the sheersize of investment.Chart 18: Net Income in Jointly Controlled Entities (yoygrowth) - Negative growth for some entities were due tomargin squeeze and increase in ASP will alleviate this problem.Source: Company dataSource: Company dataPage 6
<strong>PT</strong> A<strong>STRA</strong> O<strong>TOPAR</strong>TS <strong>Tbk</strong> <strong>COMP</strong>A<strong>NY</strong> <strong>UPD</strong><strong>ATE</strong>Fiscal Year EndIncome Statement (IDR mn) 2010 2011 2012E 2013F 2014F 2015FSales Revenue 6,255,109 7,363,659 8,677,855 10,294,701 12,432,417 14,918,900Gross Profit 1,152,626 1,237,601 1,414,490 1,729,510 2,088,646 2,521,294Operating Income 573,115 519,548 650,145 822,525 1,014,475 1,236,973Depreciation & Amortization 2,952,125 2,952,126 2,952,127 2,952,128 2,952,129 2,952,130EBITDA 699,832 677,293 849,736 1,079,893 1,325,285 1,609,946Other non-operating income 32,108 38,090 46,000 55,200 65,173 76,981Net Interest Income (expense) -109,038 -133,693 -132,607 -107,972 -102,242 -74,402Equity linked, net income 761,161 693,786 793,535 872,888 977,635 1,094,951Profit before tax 1,391,264 1,255,083 1,394,447 1,599,811 1,905,502 2,279,152Tax expenses -168,956 -153,500 -162,246 -196,269 -250,524 -319,734Profit after tax 1,222,308 1,101,583 1,232,200 1,403,541 1,654,978 1,959,418Minority Interests -84,126 -88,364 -104,134 -123,536 -149,189 -179,027Net Profit 1,138,182 1,013,219 1,128,066 1,280,005 1,505,789 1,780,391Cash Flow (IDR mn)Operating Cash Flow 399,127 258,576 778,898 829,302 772,917 1,136,989Capex 409,006 773,467 1,232,300 1,029,470 497,297 372,973Investments in Associates & Jointly ControlledEntities0 64,405 450,000 100,000 0 0Free Cash Flow -9,879 -579,296 -903,402 -300,168 275,621 764,016Dividends Received from Investments 223,250 441,016 353,929 389,322 428,255 471,080Dividends Paid 456,525 488,202 451,226 512,002 602,316 712,156Debt Issuance (redemption) -20,552 561,321 1,189,572 336,569 129,391 -161,621Net debt (cash) -203,122 365,399 554,272 467,994 698,945 1,060,263Balance Sheet (IDR mn)Cash & cash equivalents 485,564 365,399 554,272 467,994 698,945 1,060,263Account Receivables 849,087 1,017,494 1,193,424 1,412,829 1,714,823 2,062,114Inventories 708,322 955,369 1,117,441 1,259,587 1,521,143 1,823,177Other Current assets 156,752 226,193 246,568 294,215 361,384 442,258Net fixed assets 985,029 1,547,831 2,544,521 3,330,203 3,505,174 3,503,235Investment in Jointly Controlled Entities 2,154,640 2,475,031 2,722,534 2,994,788 3,294,266 3,623,693Other non-current assets 246,458 376,910 893,481 875,381 1,240,727 1,151,272Total Assets 5,585,852 6,964,227 9,272,241 10,634,996 12,336,462 13,666,013Short term Liabilities 1,251,731 1,892,818 3,179,937 3,533,344 4,078,385 4,266,087Long term Liabilities 230,974 348,515 633,483 802,987 969,729 939,891Total Liabilities 1,482,705 2,241,333 3,813,420 4,336,331 5,048,114 5,205,978Shareholders’ Equity 3,860,827 4,423,554 5,099,613 5,867,616 6,771,089 7,839,324Minority Interest 242,320 299,340 359,208 431,050 517,260 620,711Total Equity & Liabilities 5,585,852 6,964,227 9,272,241 10,634,996 12,336,462 13,666,013Key RatioRevenue Growth (%) 18.8% 17.7% 17.8% 18.6% 20.8% 20.0%EPS Growth (%) 44.4% -11.0% 11.3% 13.5% 17.6% 18.2%EBITDA Margin (%) 11.2% 9.2% 9.8% 10.5% 10.7% 10.8%Payout Ratio (%) 40.1% 40.0% 40.0% 40.0% 40.0% 40.0%ROE (%) 29.5% 22.9% 22.1% 21.8% 22.2% 22.7%Quick Ratio (×) 1.19 0.85 0.63 0.62 0.68 0.84Debt/Equity (%) 0.07 0.20 0.41 0.41 0.38 0.30*: Adjusted for stock splitPage 7