Course Guide - USAID Teacher Education Project
Course Guide - USAID Teacher Education Project
Course Guide - USAID Teacher Education Project

You also want an ePaper? Increase the reach of your titles
YUMPU automatically turns print PDFs into web optimized ePapers that Google loves.
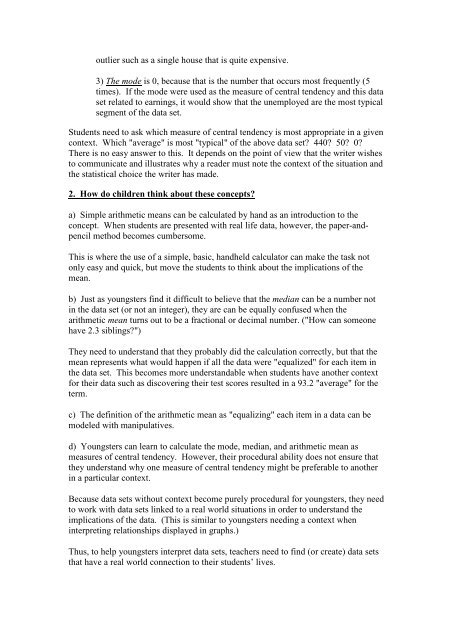
outlier such as a single house that is quite expensive.3) The mode is 0, because that is the number that occurs most frequently (5times). If the mode were used as the measure of central tendency and this dataset related to earnings, it would show that the unemployed are the most typicalsegment of the data set.Students need to ask which measure of central tendency is most appropriate in a givencontext. Which "average" is most "typical" of the above data set? 440? 50? 0?There is no easy answer to this. It depends on the point of view that the writer wishesto communicate and illustrates why a reader must note the context of the situation andthe statistical choice the writer has made.2. How do children think about these concepts?a) Simple arithmetic means can be calculated by hand as an introduction to theconcept. When students are presented with real life data, however, the paper-andpencilmethod becomes cumbersome.This is where the use of a simple, basic, handheld calculator can make the task notonly easy and quick, but move the students to think about the implications of themean.b) Just as youngsters find it difficult to believe that the median can be a number notin the data set (or not an integer), they are can be equally confused when thearithmetic mean turns out to be a fractional or decimal number. ("How can someonehave 2.3 siblings?")They need to understand that they probably did the calculation correctly, but that themean represents what would happen if all the data were "equalized" for each item inthe data set. This becomes more understandable when students have another contextfor their data such as discovering their test scores resulted in a 93.2 "average" for theterm.c) The definition of the arithmetic mean as "equalizing" each item in a data can bemodeled with manipulatives.d) Youngsters can learn to calculate the mode, median, and arithmetic mean asmeasures of central tendency. However, their procedural ability does not ensure thatthey understand why one measure of central tendency might be preferable to anotherin a particular context.Because data sets without context become purely procedural for youngsters, they needto work with data sets linked to a real world situations in order to understand theimplications of the data. (This is similar to youngsters needing a context wheninterpreting relationships displayed in graphs.)Thus, to help youngsters interpret data sets, teachers need to find (or create) data setsthat have a real world connection to their students’ lives.