TPCP Annual Report - Utah Tobacco Prevention and Control Program
TPCP Annual Report - Utah Tobacco Prevention and Control Program
TPCP Annual Report - Utah Tobacco Prevention and Control Program

Create successful ePaper yourself
Turn your PDF publications into a flip-book with our unique Google optimized e-Paper software.
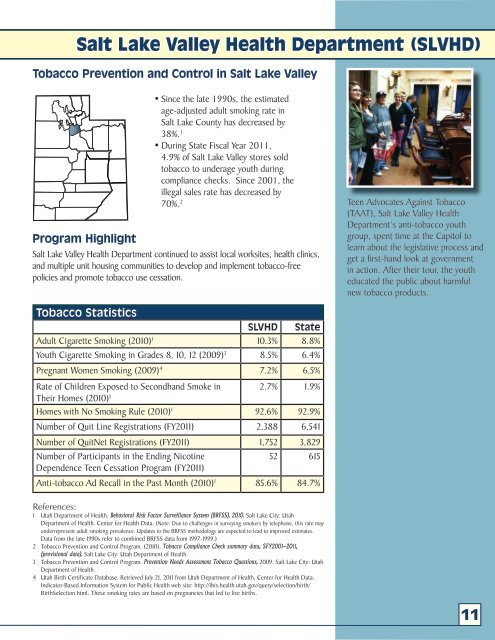
Salt Lake Valley Health Department (SLVHD)<strong>Tobacco</strong> <strong>Prevention</strong> <strong>and</strong> <strong>Control</strong> in Salt Lake Valley<strong>Program</strong> Highlight• Since the late 1990s, the estimatedage-adjusted adult smoking rate inSalt Lake County has decreased by38%. 1• During State Fiscal Year 2011,4.9% of Salt Lake Valley stores soldtobacco to underage youth duringcompliance checks. Since 2001, theillegal sales rate has decreased by70%. 2Salt Lake Valley Health Department continued to assist local worksites, health clinics,<strong>and</strong> multiple unit housing communities to develop <strong>and</strong> implement tobacco-freepolicies <strong>and</strong> promote tobacco use cessation.Teen Advocates Against <strong>Tobacco</strong>(TAAT), Salt Lake Valley HealthDepartment’s anti-tobacco youthgroup, spent time at the Capitol tolearn about the legislative process <strong>and</strong>get a first-h<strong>and</strong> look at governmentin action. After their tour, the youtheducated the public about harmfulnew tobacco products.<strong>Tobacco</strong> StatisticsSLVHD StateAdult Cigarette Smoking (2010) 1 10.3% 8.8%Youth Cigarette Smoking in Grades 8, 10, 12 (2009) 3 8.5% 6.4%Pregnant Women Smoking (2009) 4 7.2% 6.5%Rate of Children Exposed to Secondh<strong>and</strong> Smoke in 2.7% 1.9%Their Homes (2010) 1Homes with No Smoking Rule (2010) 1 92.6% 92.9%Number of Quit Line Registrations (FY2011) 2,388 6,541Number of QuitNet Registrations (FY2011) 1,752 3,829Number of Participants in the Ending NicotineDependence Teen Cessation <strong>Program</strong> (FY2011)52 615Anti-tobacco Ad Recall in the Past Month (2010) 1 85.6% 84.7%References:1 <strong>Utah</strong> Department of Health. Behavioral Risk Factor Surveillance System (BRFSS). 2010. Salt Lake City: <strong>Utah</strong>Department of Health. Center for Health Data. (Note: Due to challenges in surveying smokers by telephone, this rate mayunderrepresent adult smoking prevalence. Updates to the BRFSS methodology are expected to lead to improved estimates.Data from the late 1990s refer to combined BRFSS data from 1997-1999.)2 <strong>Tobacco</strong> <strong>Prevention</strong> <strong>and</strong> <strong>Control</strong> <strong>Program</strong>. (2010). <strong>Tobacco</strong> Compliance Check summary data, SFY2001-2011,(provisional data). Salt Lake City: <strong>Utah</strong> Department of Health.3 <strong>Tobacco</strong> <strong>Prevention</strong> <strong>and</strong> <strong>Control</strong> <strong>Program</strong>. <strong>Prevention</strong> Needs Assessment <strong>Tobacco</strong> Questions, 2009. Salt Lake City: <strong>Utah</strong>Department of Health.4 <strong>Utah</strong> Birth Certificate Database. Retrieved July 21, 2011 from <strong>Utah</strong> Department of Health, Center for Health Data,Indicator-Based Information System for Public Health web site: http://ibis.health.utah.gov/query/selection/birth/BirthSelection.html. These smoking rates are based on pregnancies that led to live births.11