<strong>Tobacco</strong> Use in <strong>Utah</strong>Figure 2.Percent of Adults Who <strong>Report</strong>ed CurrentCigarette Smoking, <strong>Utah</strong> 1999-2010(Age-adjusted)PercentageSource: <strong>Utah</strong> BRFSS 1Figure 3.Percent of High School Students Who<strong>Report</strong>ed Current Cigarette Smoking,<strong>Utah</strong> 1999-2009 (Odd Years)PercentagePercentageSource: <strong>Utah</strong> YRBS 2Figure 4.Percent of Pregnant Women Who<strong>Report</strong>ed Cigarette Smoking, <strong>Utah</strong>1999-200925Source: <strong>Utah</strong> Birth Certificates 3Figure 5.Age-adjusted Cancer Incidence Rates forLung <strong>and</strong> Bronchus Cancer, Incidence per100,000 Population, <strong>Utah</strong> 1999-2007Percentage20151050Source: <strong>Utah</strong> Cancer Registry 442520151050252015105060504030201008.2199913.512.513.012.511.910.111.29.511.29.19.58.8199911.919998.134.6199920017.6200128.07.120036.520032005Year6.3Year200720098.3 7.3 7.4 7.9 8.5200131.12001200329.0Year31.32003Year20055.95.95.85.46.5200528.82007200730.1200528.32009200926.22007Smoking Rates <strong>and</strong> Health ConsequencesAdult Smoking• At 8.8%, <strong>Utah</strong>’s 2010 age-adjustedadult smoking rate is at its lowestrecorded level (Figure 2). 1 Due tochallenges in surveying smokersby telephone, this rate mayunderrepresent adult smokingprevalence. Updates to the BRFSSmethodology are expected to lead toimproved estimates. 5• Smoking disproportionately impacts<strong>Utah</strong>ns with lower incomes. In 2010,16% of <strong>Utah</strong> adults with a householdincome of less than $25,000 reportedcurrent smoking. 1 In comparison, only4% of <strong>Utah</strong> adults with a householdincome of $75,000 or higher reportedcurrent smoking. 1Youth Smoking• Since 1999, the percentage of <strong>Utah</strong>high school students who had ever triedcigarette smoking declined by 40%. 3• The percentage of high school studentswho reported current smokingdecreased from 12% in 1999 to 8% in2001. Since 2001, it has remained inthe range of 7.3% to 8.5% (Figure 3). 2Smoking Among Pregnant Women• Since 1999, smoking among pregnantwomen has decreased by 21% (Figure4). In 2009, 6.5% of pregnant womenreported that they smoked during theirpregnancies. 3References:• Pregnant women in their teens <strong>and</strong>pregnant women with a high schooleducation or less continue to reportsmoking rates of 13% or higher. 3Exposure to Secondh<strong>and</strong> Smoke• In 2010, 1.9% (or 16,600) <strong>Utah</strong>children age 17 <strong>and</strong> younger wereexposed to secondh<strong>and</strong> smoke insidethe home. 1 The percentage of <strong>Utah</strong>children who live in homes wherepeople smoke indoors has declinedsignificantly since 2001.• Since 1999, the percentage of <strong>Utah</strong>adults who have a rule against smokingin their homes has increased from 87%to 93%. 1<strong>Tobacco</strong>-related Disease <strong>and</strong> Death• Smoking is the leading cause of lungcancer death in men <strong>and</strong> women.Other diseases caused by smokinginclude esophageal, laryngeal, oral, <strong>and</strong>throat cancers; cervical, bladder, kidney,pancreatic, <strong>and</strong> stomach cancers; acutemyeloid leukemia; pneumonia; chroniclung disease; cataracts; periodontitis;aortic aneurysm; <strong>and</strong> coronary heart<strong>and</strong> cardiovascular disease.• <strong>Utah</strong>’s lung <strong>and</strong> bronchus cancerincidence has decreased significantlysince 1999 (Figure 5). 4• Despite this progress, more than 1,200<strong>Utah</strong>ns age 35 or older die each yearas a result of tobacco use. 61 <strong>Utah</strong> Department of Health. Behavioral Risk Factor Surveillance System (BRFSS). 1999-2010. Salt Lake City: <strong>Utah</strong> Department of Health.Center for Health Data.2 YRBSS: Youth Risk Behavior Surveillance System. Youth Online: Comprehensive Results. Retrieved August 2, 2011, from http://apps.nccd.cdc.gov/YouthOnline/App/Default.aspx3 <strong>Utah</strong> Birth Certificate Database. Retrieved July 25, 2011 from <strong>Utah</strong> Department of Health, Center for Health Data, Indicator-BasedInformation System for Public Health at http://ibis.health.utah.gov. These smoking rates are based on pregnancies that led to livebirths.4 <strong>Utah</strong> Cancer Registry. Retrieved July 25, 2011 from <strong>Utah</strong> Department of Health, Center for Health Data, Indicator-Based InformationSystem for Public Health web site: http://ibis.health.utah.gov.5 Office of Public Health Assessment. <strong>Utah</strong> Behavioral Risk Factor Surveillance System. New Behavioral Risk Factor Surveillance System(BRFSS) Weighting Methodology. <strong>Utah</strong> Department of Health. Retrieved August 3, 2011 from http://health.utah.gov/opha/OPHA_BRFSS.htm.6 National Center for Chronic Disease <strong>Prevention</strong> <strong>and</strong> Health Promotion. (2010). <strong>Tobacco</strong> <strong>Control</strong> State Highlights 2010. Atlanta,GA: U.S. Department of Health <strong>and</strong> Human Services. Retrieved August 16, 2011 from http://www.cdc.gov/tobacco/data_statistics/state_data/state_highlights/2010/states/utah/index.htm.
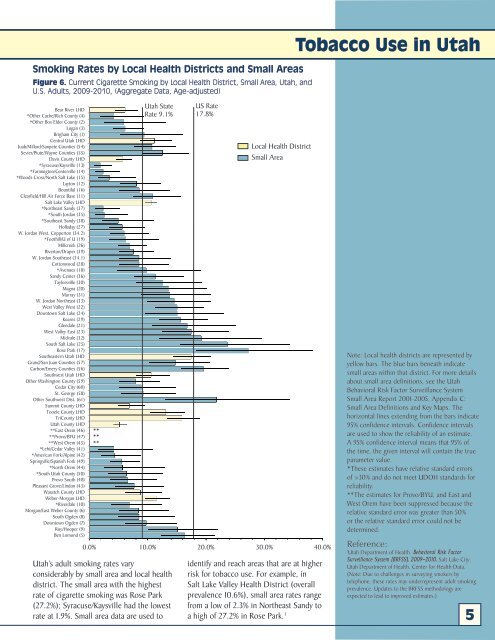
Smoking Rates by Local Health Districts <strong>and</strong> Small AreasFigure 6. Current Cigarette Smoking by Local Health District, Small Area, <strong>Utah</strong>, <strong>and</strong>U.S. Adults, 2009-2010, (Aggregate Data, Age-adjusted)<strong>Tobacco</strong> Use in <strong>Utah</strong>Bear River LHD*Other Cache/Rich County (4)*Other Box Elder County (2)Logan (3)Brigham City (1)Central <strong>Utah</strong> LHDJuab/Millard/Sanpete Counties (54)Sevier/Piute/Wayne Counties (55)Davis County LHD*Syracuse/Kaysville (13)*Farmington/Centerville (14)*Woods Cross/North Salt Lake (15)Layton (12)Bountiful (16)Clearfield/Hill Air Force Base (11)Salt Lake Valley LHD*Northeast S<strong>and</strong>y (37)*South Jordan (35)*Southeast S<strong>and</strong>y (38)Holladay (27)W. Jordan West, Copperton (34.2)*Foothill/U of U (19)Millcreek (26)Riverton/Draper (39)W. Jordan Southeast (34.1)Cottonwood (28)*Avenues (18)S<strong>and</strong>y Center (36)Taylorsville (30)Magna (20)Murray (31)W. Jordan Northeast (33)West Valley West (22)Downtown Salt Lake (24)Kearns (29)Glendale (21)West Valley East (23)Midvale (32)South Salt Lake (25)Rose Park (17)Southeastern <strong>Utah</strong> LHDGr<strong>and</strong>/San Juan Counties (57)Carbon/Emery Counties (56)Southwest <strong>Utah</strong> LHDOther Washington County (59)Cedar City (60)St. George (58)Other Southwest Dist. (61)Summit County LHDTooele County LHDTriCounty LHD<strong>Utah</strong> County LHD**East Orem (46)**Provo/BYU (47)**West Orem (45)*Lehi/Cedar Valley (41)*American Fork/Alpine (42)Springville/Spanish Fork (49)*North Orem (44)*South <strong>Utah</strong> County (50)Provo South (48)Pleasant Grove/Lindon (43)Wasatch County LHDWeber-Morgan LHD*Riverdale (10)Morgan/East Weber County (6)South Ogden (8)Downtown Ogden (7)Roy/Hooper (9)Ben Lomond (5)******<strong>Utah</strong> StateRate 9.1%<strong>Utah</strong>’s adult smoking rates varyconsiderably by small area <strong>and</strong> local healthdistrict. The small area with the highestrate of cigarette smoking was Rose Park(27.2%); Syracuse/Kaysville had the lowestrate at 1.9%. Small area data are used toUS Rate17.8%Local Health DistrictSmall Area0.0% 10.0% 20.0% 30.0% 40.0%identify <strong>and</strong> reach areas that are at higherrisk for tobacco use. For example, inSalt Lake Valley Health District (overallprevalence 10.6%), small area rates rangefrom a low of 2.3% in Northeast S<strong>and</strong>y toa high of 27.2% in Rose Park. 1Note: Local health districts are represented byyellow bars. The blue bars beneath indicatesmall areas within that district. For more detailsabout small area definitions, see the <strong>Utah</strong>Behavioral Risk Factor Surveillance SystemSmall Area <strong>Report</strong> 2001-2005, Appendix C:Small Area Definitions <strong>and</strong> Key Maps. Thehorizontal lines extending from the bars indicate95% confidence intervals. Confidence intervalsare used to show the reliability of an estimate.A 95% confidence interval means that 95% ofthe time, the given interval will contain the trueparameter value.*These estimates have relative st<strong>and</strong>ard errorsof >30% <strong>and</strong> do not meet UDOH st<strong>and</strong>ards forreliability.**The estimates for Provo/BYU, <strong>and</strong> East <strong>and</strong>West Orem have been suppressed because therelative st<strong>and</strong>ard error was greater than 50%or the relative st<strong>and</strong>ard error could not bedetermined.Reference:1<strong>Utah</strong> Department of Health. Behavioral Risk FactorSurveillance System (BRFSS). 2009-2010. Salt Lake City:<strong>Utah</strong> Department of Health. Center for Health Data.(Note: Due to challenges in surveying smokers bytelephone, these rates may underrepresent adult smokingprevalence. Updates to the BRFSS methodology areexpected to lead to improved estimates.)5