Gayan Abeysundara - Complex Adaptive Systems Group
Gayan Abeysundara - Complex Adaptive Systems Group
Gayan Abeysundara - Complex Adaptive Systems Group

You also want an ePaper? Increase the reach of your titles
YUMPU automatically turns print PDFs into web optimized ePapers that Google loves.
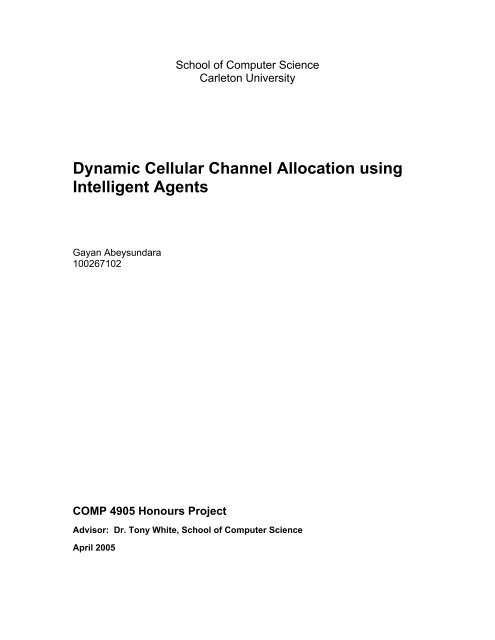
School of Computer ScienceCarleton UniversityDynamic Cellular Channel Allocation usingIntelligent Agents<strong>Gayan</strong> <strong>Abeysundara</strong>100267102COMP 4905 Honours ProjectAdvisor: Dr. Tony White, School of Computer ScienceApril 2005
Dynamic Cellular Channel Allocation using Intelligent Agents April 2005COMP 4905 Honours ProjectAbstractThe following paper looks at an approach to dynamic channel allocation in cellular telephonenetworks using mobile agents modeled after social insects. Current cellular networks areextremely large and complex, and usually managed by a centralized system. This centralizedmethod is prone to problems, and possibly leads to inefficient utilization of network resources.Using division of labour and task specialization, agents in the network are able to self-organizeand produce intelligent swarm behavior. As a result, a decentralized, robust system emerges –adapting real-time to network conditions.This work is being built upon an existing agent-based solution proposed by a previous Honoursstudent. Simulation results had shown feasibility, but only with further research and development.The original work was extended to include additional features, higher agent intelligence, andmore realistic network situations.Numerous simulations of the current project clearly show that an agent-based solution is feasible.Agents performed very well in all network conditions, increasing the use of limited networkresources. As well, using a dynamic method to control the agent population produces results closeto optimal.i
Dynamic Cellular Channel Allocation using Intelligent Agents April 2005COMP 4905 Honours ProjectTable of Contents1. Introduction ................................................................................................................. 11.1 Cellular Telephone Networks............................................................................. 22. Swarm Intelligence...................................................................................................... 42.1 Swarm Intelligence in Network Resource Allocation ......................................... 53. Cellular Network Simulation ........................................................................................ 83.1 Java Classes ..................................................................................................... 93.2 Problems with Original Simulation ................................................................... 103.3 Software Additions and Modifications.............................................................. 123.3.1 Random Agent Sweep........................................................................ 133.3.2 Call Models ......................................................................................... 143.3.3 Simulation Mode ................................................................................. 163.3.4 Dynamic Ant Adjustment..................................................................... 173.3.5 GUI Modifications ............................................................................... 184. Experimentation ........................................................................................................ 204.1 Simulation Results ........................................................................................... 204.1.1 Downtown Call Model ......................................................................... 214.1.2 Centre Hotspot Call Model.................................................................. 244.1.3 Random Hotspot Call Model............................................................... 284.2 Observations and Analysis .............................................................................. 315. Conclusion ............................................................................................................... 325.1 Similar Work Done in Field .............................................................................. 325.2 Future Developments ...................................................................................... 335.3 Summary ......................................................................................................... 34References ..................................................................................................................... 35Appendix A – Simulation Tables ....................................................................................A-1Appendix B – Contents of Project CD............................................................................B-1ii
Dynamic Cellular Channel Allocation using Intelligent Agents April 2005COMP 4905 Honours ProjectList of FiguresFIGURE 1. Cellular network grid with base station antennas. .........................................................2FIGURE 2. Network grid with intelligent agents. ..............................................................................5FIGURE 3. Screenshot of original cellular simulation developed by Lawlor. ...................................8FIGURE 4. Screenshot of a simulation with a centre hotspot. .......................................................15FIGURE 5. Screenshot of control panel in modified GUI. ..............................................................18FIGURE 6. Screenshots of two different views of cellular grid in GUI. ..........................................19FIGURE 7. Simulation results of Downtown call model using call rate of 3...................................21FIGURE 8. Simulation results of Downtown call model using call rate of 4...................................21FIGURE 9. Simulation results of Downtown call model using call rate of 5...................................22FIGURE 10. Simulation results of Downtown call model using call rate of 6.................................22FIGURE 11. Simulation results of Downtown call model using call rate of 7.................................22FIGURE 12. Simulation results of Downtown call model using call rate of 8.................................23FIGURE 13. Simulation results of Downtown call model using call rate of 9.................................23FIGURE 14. Simulation results of Downtown call model using call rate of 10...............................23FIGURE 15. Simulation results of Centre Hotspot call model using call rate of 3. ........................24FIGURE 16. Simulation results of Centre Hotspot call model using call rate of 4. ........................25FIGURE 17. Simulation results of Centre Hotspot call model using call rate of 5. ........................25FIGURE 18. Simulation results of Centre Hotspot call model using call rate of 6. ........................25FIGURE 19. Simulation results of Centre Hotspot call model using call rate of 7 .........................26FIGURE 20. Simulation results of Centre Hotspot call model using call rate of 8. ........................26FIGURE 21. Simulation results of Centre Hotspot call model using call rate of 9. ........................26FIGURE 22. Simulation results of Centre Hotspot call model using call rate of 10. ......................27FIGURE 23. Simulation results of Random Hotspot call model using call rate of 3.......................28FIGURE 24. Simulation results of Random Hotspot call model using call rate of 4.......................28FIGURE 25. Simulation results of Random Hotspot call model using call rate of 5.......................28FIGURE 26. Simulation results of Random Hotspot call model using call rate of 6.......................29iii
Dynamic Cellular Channel Allocation using Intelligent Agents April 2005COMP 4905 Honours ProjectFIGURE 27. Simulation results of Random Hotspot call model using call rate of 7.......................29FIGURE 28. Simulation results of Random Hotspot call model using call rate of 8.......................29FIGURE 29. Simulation results of Random Hotspot call model using call rate of 9.......................30FIGURE 30. Simulation results of Random Hotspot call model using call rate of 10.....................30List of TablesTABLE 1. Comparing simulations with corrected channel-stealing algorithm................................12TABLE 2. Comparing agent sweep algorithms. .............................................................................13iv
Dynamic Cellular Channel Allocation using Intelligent Agents April 2005COMP 4905 Honours Project1. IntroductionThe objective of this project is to continue the work done by a previous Honours student, MichaelLawlor. It proposes a decentralized approach to dynamic channel allocation in cellular telephonenetworks. This is accomplished by using mobile agents modeled after social insects such as antsand bees. Using division of labor and adaptive task allocation, simple interconnected agents selforganizeto exhibit intelligent behavior to produces an overall robust and adaptive system.The agent-based solution proposed by Lawlor produces better results than a traditional agent-lesssystem. However, this is only under certain situations, with specific call generation rates andusing a certain number of agents [Lawlor, 2003]. Furthermore, many agents working under a highnetwork load only produces a less organized system, with excessive channel shuffling (stealing offrequencies). This project involves building on the work done by Lawlor to produce an improved,more refined agent-based solution to the problem of dynamically allocating limited cellularfrequencies in a wireless network.The project will be deemed successful if improvements are made on the pervious agent-basedsolution. This may be achieved by showing that agents in the system can affectivity allocatenetwork resources under all conditions. As well, the addition of agents in to the system shouldproduce clear and consistent trends in performance. Extensive simulations of the cellular networkwill be done to reveal the final results.A primary goal of the project is the make the system highly adaptive. With varying networkscenarios, the number of agents in the system should be able to adapt to the current condition.This proposed feature will be implemented in the system to give agents the power of selfterminationand self-duplication. This higher form of agent intelligence will be experimentallytested to determine feasibility.The report will begin by discussing the current situation of cellular telephone networks and thenmove onto swarm intelligence, and how it could be used in network resource allocation. The maincomponent of the report will consist of the cellular network simulation software, developed usingJava. The simulation results will then be presented with a comprehensive analysis. And finallyconcluding with a look at similar research done in the field and future developments for theproposed agent-based solution.1
Dynamic Cellular Channel Allocation using Intelligent Agents April 2005COMP 4905 Honours Project1.1 Cellular Telephone NetworksAt the present moment, cellular telephone networks have higher demand and operatingrequirements then ever before. They are very large, complex, and still growing at a rapid rate.They’ve grown so large that no single human can begin to comprehend or manage such a system.And currently, they are usually only controlled by a single central system, with ongoing humaninteraction to keep it stable and resolve problems.Cellular networks are organized as a grid of cells with a base station located in each one. Thebase station consists of an antenna that transmits cellular frequencies and defines the perimeter orboundary of the cell. The base station is responsible for communicating with each of the cellularbaseduser devices within the cell. Because of the limited frequency spectrum allocated to cellularcommunication, frequencies have to be used efficiently to utilize the network to its maximumpotential. Cells are allowed to reuse frequencies over the network – as long as the same frequencyis not used in the same cell or two adjacent cells.FIGURE 1. Cellular network grid with base station antennas.For a regular cellular telephone call, three frequencies are required: one for outgoing voice,another for incoming voice, and the last for control communication. The three combined isreferred to as a channel, so therefore one channel is required per call. As such, frequency andchannel will be used interchangeably for the remainder of the report, and will both refer to themethod of communication in a cellular telephone call.A simplified version of a cellular telephone network consists of new calls, in-progress calls,blocked calls, and handoffs. New calls refer to a cellular phone requesting an available channel touse. This is accomplished be contacting the respectful base station who in turn will return anappropriate frequency from the central system. In-progress calls simply refer to what it states -2
Dynamic Cellular Channel Allocation using Intelligent Agents April 2005COMP 4905 Honours Projectcalls that have been successfully connected to the central telephone network and is in the processof communicating voice or data. Blocked calls refer to a call being blocked and disconnectedfrom the system for a particular reason. This may occur while a new connection is beingestablished, and no appropriate frequencies are available. As well, if a call moves out of thecurrent cell boundaries where the frequency is not strong enough and no new frequencies areavailable, the call will be blocked and dropped by the system. If a call does move out of itscurrent cell boundaries into another cell where it is allocated a new channel, it is referred to as ahandoff. Currently, all the above procedures are handled by one central system. As one couldimagine, the system has to manage a constant heavy workload to execute a continuous flow oftasks. Such a centralized system is inevitably prone to problems and could lead to a single pointof system failure.Another important aspect of cellular grids are network hot spots, or simply hotspots. A hotspotoccurs when there is high demand in a particular location of the cellular network grid. This maybe due to many reasons, some predictable and others random and unpredictable. Predictableevents that may trigger a hotspot include such things as a dense population of people duringworking hours in a city centre, or people in a large shopping mall during the weekend.Unpredictable events occur when there is an unforeseen gathering of people, possibly due to aspectator event, protest, or any other random externality that causes a population spike. As such,cellular networks should be designed appropriately to handle hotspots, whether predictable or not.3
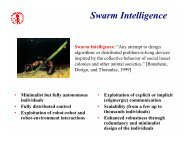
Dynamic Cellular Channel Allocation using Intelligent Agents April 2005COMP 4905 Honours Project2. Swarm IntelligenceSwarm intelligence is a field of artificial intelligence where the system is modeled after thebehavior of a particular swarm of animals. This usually consists of modeling a colony of socialinsects such as bees or ants, but may also include larger animals such as flocks of birds.Simulations and models are created to solve particular problems in the technology field. This maybe purely software related, usually taking on the form of optimization algorithms, resourceallocation, or finding optimal routes in a network. But it can also be used in robotics, to have agroup of robots behaving under swarm intelligence. The purpose of using swarm intelligence is tohave a decentralized system that is extremely flexible and robust. This is possible due to theconcept of emergence: interconnected simple elements self organizes and exhibits intelligentbehavior, more robust than a centralized approach [Johnson, 2001].The principle components are the individual entities or agents in the swarm. Each agent onlyfollows a simple set of rules that are inherent in the particular species of animal the swarm ismodeled after. They interact with each other and the environment to determine its course ofaction. Each agent does not know the entire system or what the entire swarm is doing, leading tono overall evaluation. However, as a result of the overall swarm behavior from each and everyagent intertwined with each other, the system self-organizes to produce an efficient workingentity [Bonabeau et al., 1999].There are four components of self-organization: positive feedback, negative feedback,amplification of fluctuations or randomness, and the reliance on multiple interactions [Bonabeauet al., 1999]. Positive feedback occurs through recruitment and reinforcement, such as therecruitment to a food source. Negative feedback is required to counter balance the positivefeedback. Such feedback can occur through competition and exhaustion. Self-organizationrequires amplification of fluctuations, or randomness. This important aspect allows for thediscovery of new solutions. The last ingredient of self-organization is the reliance on multipleinteractions. There must be some sort of minimal interaction between individuals, and theyshould each be able to make use of the results of their own actions and the actions of others.Agents may communicate with each other in two ways, either directly or indirectly. Directcommunication between social insects is usually accomplished by releasing a chemical substanceknown as pheromones. Pheromones are used by ants for trail-laying and trail-following, to a food4
Dynamic Cellular Channel Allocation using Intelligent Agents April 2005COMP 4905 Honours Projectsource for example. The strength of the pheromone concentration will determine how likelyindividuals will respond to it. If a strong concentration is established, more ants will respond andcrowd together. To indirectly transfer information, agents must change the surroundingenvironment for others to perceive and act accordingly. This is also known as stigmergy, wherethe environment serves as a median of communication [Bonabeau et al., 1999].2.1 Swarm Intelligence in Network Resource AllocationAgents behaving under swarm intelligence can be released into a network to efficiently allocatelimited resources. As such, in our case, agents distribute the limited number of cellularfrequencies among the cells to accommodate network fluctuations and areas in high demand. Thisapproach leads to agents distributing channels instead of a central system - each solving theproblem at hand locally.The specific strategy used in our agent-based solution is referred to as division of labour.Overtime, agents in the system establish a routine or pattern to efficiently divide the totalworkload. This is accomplished by using dynamic response thresholds that change depending onthe network demand. Network cells that are in high demand and low on resources stimulateagents randomly until one responds. This can be seen as releasing pheromones into the system,propagating from the exhausted cell. Each stimulated agent determines if it will respond to thecell depending on its response threshold. If the stimulus is equal to, or above the agent threshold,it will respond and proceed to take the required steps. Otherwise, the agent will ignore thestimulus and continue what ever it was doing. Each agent has a unique response threshold foreach cell in the network. There is an indirect transfer of information between agents, orstigmergy, because when an agent responds to a cell in need it changes the environment andeliminates that stimulus for others.FIGURE 2. Network grid with intelligent agents.5
Dynamic Cellular Channel Allocation using Intelligent Agents April 2005COMP 4905 Honours ProjectThe above strategy of division of labour is used in conjunction with adaptive task allocation.<strong>Adaptive</strong> task allocation consists of agents adapting and “learning” to perform certain tasks of theoverall workload. The system accomplishes this by changing response thresholds depending oncell stimulation. If an agent responds to a cell in demand, it will lower its threshold for that celland its neighboring cells by specified amounts, and increase its threshold for all other cells.Therefore, agents are able to “specialize” in particular areas of the grid where they have donemore work, and have lower response thresholds. Since call generation rates, directions, andlocations are not completely random, where they follow some sort of pattern or trend over time,agents specializing in areas of the grid produces a flexible system that can adapt to changingnetwork conditions. It should be noted that with the current implementation, only agents that arestimulated change there thresholds, idle agents do not lower or change there response thresholds;this concept will be seen later.When a cell with high demand iterates through the list of available agents, stimulating each one,the probability that an agent a located in cell i responds to a stimulus from cell j is:Paij2Sj= (1)S +αθ + βd2j2a,j2i,jWhere S j is the amount of demand or stimulus from cell j, θ a,j is the response threshold of agent afor cell j, d i,j is the distance between cell i and cell j, and α and β are two positive coefficients thatweight the influences of θ and d. If an agent a responds to a stimulus from cell j, it updates itsresponse thresholds in the following way:θa , j= θa,j− ξ0(2)θa , n(j)= θa,n(j)−ξ1, for ∀n(j) (3)θa , k= θa,k+ ϕ , for ∀k where k ≠ j and k ∉ {n(j)} (4)Where {n(j)} is the set of neigboring cells to cell j, ξ 0 and ξ 1 are two learning coefficientscorresponding to cell j and its neigbors respectively, and ϕ is the forgetting coefficient for allother cells in the grid. So to summarize, an agent that responds to a cell stimulus lowers itsresponse threshold for that cell according to Eq. (2), lowers its threshold for all neighboring cellsusing Eq. (3), and increases its threshold for all other cells using Eq. (4).6
Dynamic Cellular Channel Allocation using Intelligent Agents April 2005COMP 4905 Honours ProjectThe four elements of self-organization are accommodated in our agent-based solution. Positiveand negative feedback is created through lowering and increasing response thresholds,respectively. Idle agents moving randomly through the network is an example of amplification offluctuations, or the required randomness. And the need for multiple interactions exists becauseagents indirectly communicate with each other through the environment.7
Dynamic Cellular Channel Allocation using Intelligent Agents April 2005COMP 4905 Honours Project3. Cellular Network SimulationA simple cellular network simulation was developed by Lawlor, which was programmed usingJava. The network consists of a ten by ten grid of hexagonal cells, representing the cellulartelephone grid. A total of 100 channels are allocated to the system, with each cell initially holdingten channels. This is possible because as stated before, frequencies may be repeated in thenetwork so long as they are not in adjacent cells. The simulation is executed based on simulatedseconds, also known as ticks, where each second advances all network operations by one step.Calls are generated depending on a user specified call generation rate. The call generation rate, orcall rate, does not give the number of calls per second, but only provides an upper bound on thenumber of call that can be generated in a second. The actual number of calls per second is arandom number uniformly distributed between zero and the call rate. Since a channel iscomposed of the three frequencies required for communication, each call requires one channel. Anewly generated call is randomly positioned on the grid, but is affected by the hotspot algorithm –explained later. The hotspot algorithm also determines the call direction. The holding time of acall and its velocity in the network is randomly determined and will be clarified in more detaillater. Handoffs occur when a call moves from one cell to another, and a suitable channel isallocated in the new cell. The percentage demand in each cell, or simply cell demand, is equal tothe current number of in-progress calls divided by the total number of channels in the cell. Sotherefore a cell with demand of 0% is not using any of its available channels, while a cell withdemand of 100% is using all of its available channels.FIGURE 3. Screenshot of original cellular simulation developed by Lawlor.8
Dynamic Cellular Channel Allocation using Intelligent Agents April 2005COMP 4905 Honours ProjectAgents are referred to as ants in the system, and as such, the two terms will be usedinterchangeably from this point forward. Any number of ants may be released into the network,and is specified by the user. Each ant moves randomly within the network from one cell toanother in an “Idle” state until stimulated by a cell in high demand. This random movement of anidle agent can symbolize an actual insect wandering about its colony, due to lack of stimulation.Cells in high demand are defined in the system as cells that are using over 65% of there currentresources, or channels. When a cell reaches this status, it begins to stimulate idle ants until oneresponds. The response probability that an ant has to a stimulus is determined by the currentresponse threshold that ant has for the particular cell. As noted above, all ants in the system havea unique response threshold for each cell in the network grid. Ants that respond to a cellstimulation begin to move toward the cell - in a “In Transit” state. Once the target cell has beenreached, the ant changes to a “Working” state. While in this state, the ant tries to allocate newchannels to the high demand cell. It accomplishes this by “stealing” channels from neighboringcells, while preventing any frequency interference from occurring due to new channel locations.Ants may not create new channels, nor steal channels from a cell that has a specified minimumnumber. Each cell must have a minimum of five channels, so it does not get completely starved ofresources.3.1 Java ClassesAll components of the Java simulation will not be listed here, but instead only the importantclasses are summarized below. A detailed description of all the implemented classes can be foundin the report done by Lawlor.CellEach cell in the network grid is implemented as a unique object. The class has instance variablesfor its position in the grid, a list of channels allocated to it, a list of current calls in-progress, itscurrent demand (channel usage), and whether or not an ant is assigned to it.AntEach ant is also implemented has a separate object. The ant holds its current position on the grid,its current state, and response threshold for each cell in the network grid. The state of an ant canbe “Working”, “In-Transit”, or “Idle”. The response threshold is a number between 0 and 100,and is initialized to 50 when the ant is created. In addition to the above instance variables, the Ant9
Dynamic Cellular Channel Allocation using Intelligent Agents April 2005COMP 4905 Honours ProjectAn error was discovered in how random numbers were generated. A new Random object wascreated in every method (where needed) resulting in similar time seeds to be used in successivemethod calls. When multiple Java Random objects use the same seed, they will all produce thesame sequence of random numbers. Therefore, this resulted in a higher then expected callgeneration rate in certain cells. To prove this, a simulation was done for 500 seconds, averagedover ten runs, with a call generation rate of ten. The original simulation produced a call blockageof 9.1%, while the corrected simulation only blocked 2.9% of the calls. The corrected simulationonly creates one instance of Random in the main operation class and every method refers to it.It was noticed after experimental simulations that ants would specialize in specific areas of thegrid. This was also noticed by Lawlor, “the ant became so specialized in a specific locality of thegrid, that it completely ignored demands from any other area” [Lawlor, 2003], where he wasreferring to one ant in the network. But similar results were observed with more ants: “similar tothe case with one ant, these five ants become over-specialized in particular areas and ignored thedemands of other areas” [Lawlor, 2003]. Looking into this phenomenon further, the networksimulation was tested numerous times, finally revealing the problem. It was noticed after sometime that ants would always tend to stay on the left side of the grid. Upon studying the code, thereason was determined - cells in need of ants would be iterated through in order, from top tobottom. This gave the first cells in the list higher priority over ants than the last cells. Soovertime, cells in the top left corner would have easier access to ants (lower thresholds) than cellsin the bottom right corner. This effect was only seen and detectable with a low number of ants - inour case one and five. A higher a number ants caused the network grid to become denser,resulting in less obvious trends and patters.Some other minor problems in the simulation code were found. As Lawlor had sated in his report,ants were stimulated in order instead of randomly. This may not seem to be very serious, butcaused some very undesirable effects in the simulation. Over time, ants in the beginning of the listthat were stimulated first had lower response thresholds than ants in the end of this list. And insome cases, ants in the end of list were never stimulated – always randomly moving around. Theoverall effects of this on simulation results are not completely known. Another code defect wasfound in the algorithm that “steals” channels for working ants. Ants working in cells with highdemand, where the channel usage is over 65%, were allowed to steal frequencies fromneighboring cells that were also high in demand. So for example, an ant in a cell with demand of70% was allowed to a take a channel from a neighbor cell with demand of 90%. This was most11
Dynamic Cellular Channel Allocation using Intelligent Agents April 2005COMP 4905 Honours Projectlikely a simple mistake, but it did lead to higher channel shuffling rates. A simulation was donefor 2000 seconds with 20 ants at a call germination rate of ten, averaged over ten runs. The resultsare shown in Table 1.Total Calls Calls Blocked Stolen ChannelsOriginal Simulation 5696 19.5% 9112Corrected Simulation 5679 19.7% 7385TABLE 1. Comparing simulations with corrected channel-stealing algorithm.As one can see, the number of stolen channels dropped by 1727 or 19%, while the total number ofcalls and percentage blocked was about the same.Even though some problems and faults had been found, which were candidly pointed out here,the project done by Lawlor was an excellent start to the proposed agent-based solution. The workdone was a significant achievement considering the little time given to complete the project. Thecompleted work had set up a solid base and framework on to which it was built upon.3.3 Software Additions and ModificationsExtensive modifications were done to the Java simulation. This included minor changes such asdifferent call holding times and call speeds, but other large components were also added to theapplication.The averaged call holding time was 380 seconds, or about six minutes. Under realisticcircumstances, this may be too long for a cellular telephone call. Therefore it was changed to 180seconds, or three minutes – representing a more likely call time. The actual call holding time israndomly distributed between 5 and 1505 seconds.Call velocity, or call speed, represents how fast a call moves through the network grid, beinghanded off from one cell to another. Originally, this was a random number between 0 and 0.005,which gives the number of seconds a call lasts in a cell before being handed off. Therefore, if callwere moving at a maximum speed of 0.005, it would be handed of every 200 seconds. With anaverage call holding time of 180 seconds, most calls would never be handed off. With such aslow speed, the handoff feature would not be properly tested. The call velocity was changed to arandom number between 0 and 0.02, which gives a maximum speed of 50 seconds per cell. So an12
Dynamic Cellular Channel Allocation using Intelligent Agents April 2005COMP 4905 Honours Projectaverage call lasting 180 seconds may be handed off three times, given the maximum speed. Thismay seem fast, but could represent a realistic situation such as a car on a highway.3.3.1 Random Agent SweepAs noted above, the algorithm that sweeps through ants for cells in high demand was not random.This caused the differing response thresholds between ants in the beginning of the list and ants atthe end of the list. Not only was this sweep algorithm fully randomized, but an extra feature wasadded. Before random stimulations took place, ants located in the neighboring cells werestimulated first. So therefore a cell in high demand initially searched for idle ants that are locatedin its neighboring cells, or even in its own cell. The feature was added because the sweepalgorithm may find an idle ant located five or more cells away, while there could be an idle antlocated right next to the demanding cell, producing inefficient results from long “In Transit”times. This could also represent a more realistic release of pheromones, where the chemicalsubstance propagates from its originating location. This propagation effect initially reachesnearby insects before being sensed by the rest of the colony. To test the effect of the proximitysweep algorithm, a simulation was conducted for 4000 seconds with 20 ants at a call rate of ten,averaged over ten runs. The Random Hotspot call model was used (explained later) because itallowed for a greater variety of possible ant locations, resulting in higher ant-to-cell distances.The results are shown in Table 2.Total Calls Stolen Channels Calls BlockedRandom Sweep 11398 7506 15.2%Proximity Sweep 11413 10444 12.8%TABLE 2. Comparing agent sweep algorithms.The algorithm with the proximity sweep blocked fewer calls. However it resulted in morechannels to be stolen. This is because in the regular random sweep, when a cell successfullystimulates a far off ant, the ant must take some time to travel to the high demand cell. Once thecell has been reached the ant maybe too late to help or the channel usage may have droppedbelow the threshold (65%) and the ant continues to be idle. On the other hand, the sweepalgorithm with the proximity feature allows cells to stimulate nearby ants to steal channels. Thenearby ant can quickly steal channels for the cell in need, resulting in higher channel shufflingrates.13
Dynamic Cellular Channel Allocation using Intelligent Agents April 2005COMP 4905 Honours Project3.3.2 Call ModelsAs mentioned above, the main reason the agent-based solution did not work well was because ofthe complete randomness in the network. Calls were generated in a random location on thenetwork grid and moved in a random direction. The agent-based solution is most effective underrealistic situations, where network activity is somewhat predictable or organized. Simulations ofactual cellular network girds should show clear patterns and trends over time that will cycledepending on time and day. To depict these realistic situations in the cellular simulation, multiplecall models were added. They are: All Random, Downtown, Centre Hotspot, and RandomHotspot.All RandomNot really a call model, All Random represents the original network simulation, with random calllocation and direction. With the All Random call model selected, the location of the call anddirection is randomly determined, and not dependent on any other condition such as time. Thiscall model was included just have some sort of benchmark and a method of comparing with theoriginal simulation.DowntownThe Downtown call model represents a simplified version of a typical workday in a city. The callmodel consists of four cycles, each lasting an equal time. The first cycle represents the morning,where people are moving into the city centre. Calls in this cycle have a direction toward thecentre, and have a random call location that is partially centre oriented. The second cyclerepresents the working afternoon, where most people are densely populated in the centre of a city.In this cycle, calls are generated in the centre and have a random direction. The third cyclerepresents the end of day where people are traveling back home. The cycle generates calls with anoutward direction and a location that is partially centre oriented. The last cycle of the Downtowncall model represents the evening, with no clear pattern or trend. Calls are generated with arandom location and direction. Upon completion of the fourth cycle, the model starts to repeatand begins with the first cycle again.Centre HotspotIf a centre hotspot is desired, like in the Downtown call model, but all the other cycles are notrequired, a user may select the Centre Hotspot call model. It represented by only two cycles. The14
Dynamic Cellular Channel Allocation using Intelligent Agents April 2005COMP 4905 Honours Projectfirst generates calls with a random location and direction, like the All Random model. And thesecond cycle generates calls that are densely populated in the centre, with an inward movingdirection. The two cycles then continue to repeat. The overall effect of the Centre Hotspot issimply a random situation followed by a centre hotspot.FIGURE 4. Screenshot of a simulation with a centre hotspot.Random HotspotThe last call model implemented is Random Hotspot. This call model is very similar to the CentreHotspot, but the hotspot location is randomly determined instead of centre-oriented. The firstcycle is completely random, and the second cycle generates calls in a random hotspot locationwith calls also directed toward that location. Even though the Random Hotspot call model maynot represent a typical trend or pattern in a cellular network grid, it gives a good representation ofunpredictable events. As described above, unpredictable events are caused by a gathering ofpeople that normally does not occur during that particular day or time. As well, Random Hotspotwill most likely give the best indicator on how adaptive the agents are. Besides the first AllRandom call model, the other call models are centre oriented, allowing agents to “settle” into a15
Dynamic Cellular Channel Allocation using Intelligent Agents April 2005COMP 4905 Honours Projectpredictable routine over time. The Random Hotspot model should test their full capabilities tochanging network conditions.The user may select the desired call model through the graphical interface. All cycles in each callmodel run for the same amount of time. It is initialized to 500 seconds, but can be changed by theuser through the GUI.3.3.3 Simulation ModeToo properly test the network simulation under all conditions, such as differing call rates andnumber of ants, many experimental simulations must be done. Initially this was accomplished bymodifying the Java code to reflect the desired conditions, resulting into a tedious and inefficientprocess. Therefore a “Simulation Mode” was added to the software.By selecting the Simulation Mode, a user can simulate by entering the desired number of ants,call rate, seconds to simulate, and number of runs to average over. A log file is created for eachsimulation, showing all the statistics averaged over the number of runs. The name of the log filecan be specified by the user, or left as “auto”. The “auto” feature automatically creates a uniquefile name depending on the number of ants, call rate, seconds, and runs. For example, asimulation using 30 ants for a call rate of 10 for 2000 seconds averaged over 5 runs will create alog file with the name: sim_30_10_2000_5.txt. Note the file name currently does not include thecall model.A unique feature of the Simulation Mode is the ability to input multiple values for the number ofants and call rate. For example, an experimenter may decide to test ten different call rates usingfive different ant populations under the same network conditions. This combination can beentered into the program and left alone to simulate on its own. The feature is very useful whenrunning long simulations, allowing the experimenter to execute the program and “leave it”,possibly over night. Each value is delimitated (separated) by a comma in the text field. A log fileis created for each simulated ant and call rate value, forcing the “auto” feature to be used (for thelog file name).16
Dynamic Cellular Channel Allocation using Intelligent Agents April 2005COMP 4905 Honours Project3.3.4 Dynamic Ant AdjustmentA primary goal of the project is the make the system adaptive. The number of ants shouldsomehow adjust to the different network conditions. Hence, the “Dynamic Ant Adjustment”feature was added. If selected, this feature will automatically adjust the number of ants in thenetwork to an optimal level.The Dynamic Ant Adjustment feature was implemented using the ant response thresholds. Everysecond, each ant will calculate its average response threshold, equal to the average threshold ofthe 100 network cells. If the average threshold of an idle ant is below a certain point, indicatingthe ant is not being used, it will terminate itself (from the system). If an ant, in any state, has anaverage threshold above a certain point, it will spawn a new ant, or duplicate itself. The new antwill be located in the same cell as the original. The current state of an ant – “Idle”, “In Transit”,or “Working” – is taken into consideration before termination. Only an “Idle” ant may beterminated, because an ant that is “Working” or “In Transit” is needed and should not terminate.The spawning feature is executed in any state.The average response threshold for ant termination must be less than one percent. This assures theant has not being stimulated and therefore has not worked. The average threshold for antduplication (spawning a new ant) must be greater or equal to 80%. Eighty percent was chosenbecause a higher response threshold was not likely to occur, unless the entire network was underextremely heavy demand. As well, 80% gives a good indicator of when an ant is excessivelyworked, allowing another ant to enter the system and “help out”. Note the above parameters, 1%and 80%, have been found to be good values based on experimentation, but may not representoptimal values.It must be noted here that the agent algorithms for adaptive task allocation had to be modified toaccommodate this feature. As noted above, idle ants do not lower or change there responsethresholds. So an ant that is never stimulated nor works continues to have the same responsethreshold that it was initialized to, currently 50%. As one can deduce, the above ant terminationprocess can never occur under this situation. Therefore, to accommodate unused ants and thetermination process, ant thresholds decrease by 0.05% every second for each cell when the ant isidle. So overtime, an idle ant in a low-demand network will reduce its threshold until it terminates17
Dynamic Cellular Channel Allocation using Intelligent Agents April 2005COMP 4905 Honours Projectitself. The threshold reduction only occurs when the Dynamic Ant Adjustment feature is selected.The following code represents the actual termination and duplication algorithms used.if(autoAnts)// ant termination algorithm...{// decrease all cell thresholds for an idle antthisAnt.decreaseAllCellThresholds();}// if average threshold below 1.0, terminate!if(thisAnt.getAverageThreshold() < 1.0){if(Ants.size() > 1) { // must have at least one ant so itAnts.remove(i); // is able to re-generate populationi--;}}if(autoAnts){}// ant duplication algorithm...// if average threshold greater or equal to 80, spawn!if(thisAnt.getAverageThreshold() >= 80.0){thisAnt.resetThresholds(); // must reset thresholds of original antAnt newAnt = new Ant(thisAnt.getPosition());}newAnt.setHandle(this);Ants.add(newAnt);// add new ant in same location as original3.3.5 GUI ModificationsSignificant changes were made to the graphical user interface (GUI). Some are self-explanatorysuch the required text fields for the Simulation Mode, the radio buttons for the call modelselection, and additional fields for simulation statistics. Other modifications were made forcosmetic reasons.FIGURE 5. Screenshot of control panel in modified GUI.Originally, each cell displayed the channel usage and call demand percentage. The call demandtext would change colour depending on demand, from white to yellow to red, and the cell itselfwas black. In the new simulation, the user has the option of showing the cell statistics, and the18
Dynamic Cellular Channel Allocation using Intelligent Agents April 2005COMP 4905 Honours Projectcolour of the entire cell changes depending on call demand. The cell progressively changes colourfrom green to red, depending if the cell has low or high demand. This displayed a much clearerpicture of the network grid and progression in the system. Furthermore, the update procedure inthe GUI was changed to dramatically reduce flickering.FIGURE 6. Screenshots of two different views of cellular grid in GUI.19
Dynamic Cellular Channel Allocation using Intelligent Agents April 2005COMP 4905 Honours Project4. ExperimentationTo test the new and improved network simulation, many simulations were conducted - utilizingall the capabilities of the application. Simulations were done for the three call models:Downtown, Centre Hotspot, and Random Hotspot. The All Random call model was notconsidered because agents in a random network will not necessarily produce better results, asseen in previous experimentation done be Lawlor.For each call model, simulations were done for call generation rates from three to ten. Lawlar hadstarted from a call rate of two, but that resulted in too few calls generated and no calls beingblocked, hence the call rate now starts at three per second. For each call rate, the followingsequence of ants were used: 0, 1, 5, 10, 15, 20, 25, 30, 35, and 40. Simulations using zero ants isto set the benchmark: the network with no agents. Simulations using only one ant is merely as aboundary case, and should not necessarily produce better results than zero ants, since one ant isnot considered a swarm. For each combination of call rate and number of ants, the simulation wasrun for 4000 seconds (about 66.7 minutes) and averaged over five runs. Four thousand secondswas chosen because it gave sufficient time for the number of in-progress calls to level off, whilethoroughly testing the capabilities of agents. A log file was created for each simulation withaverage results for the five runs.In addition to a fixed number of ants, simulations were done using the automatic ant adjustmentfeature. It was tested for each call model, using all above call rates. All simulations start off with20 ants, and automatically adjust depending on network conditions. Each simulation was run for12,000 seconds, averaged over five runs. Such a long simulation time was chosen because thenetwork needed enough time to adjust the number of ants to the optimal level and stabilize. Also,there needed to be enough time to accurately measure the benefits of the stabilized ant population.4.1 Simulation ResultsThe simulation results are shown in the following graphs, grouped by the call model used. Eachgraph shows the relationship between the number of ants used (horizontal axis) and thepercentage of calls blocked (vertical axis). As well, each graph contains a star that represents theresults of the Dynamic Ant Adjustment feature. The point of intersection depicted by the star20
Dynamic Cellular Channel Allocation using Intelligent Agents April 2005COMP 4905 Honours Projectrepresents the final number of ants at the end of the simulation and the percentage of callsblocked. Tables with detailed information for each simulation are presented in Appendix A.4.1.1 Downtown Call Model3Dowtown Model: Call Rate of 3Calls Blocked (%)2.521.510.500 1 5 10 15 20 25 30 35 40Number of AntsFIGURE 7. Simulation results of Downtown call model using call rate of 3.Calls Blocked (%)54.543.532.521.510.50Dowtown Model: Call Rate of 40 1 5 10 15 20 25 30 35 40Number of AntsFIGURE 8. Simulation results of Downtown call model using call rate of 4.21
Dynamic Cellular Channel Allocation using Intelligent Agents April 2005COMP 4905 Honours Project7Dowtown Model: Call Rate of 5Calls Blocked (%)65432100 1 5 10 15 20 25 30 35 40Number of AntsFIGURE 9. Simulation results of Downtown call model using call rate of 5.Calls Blocked (%)9876543210Dowtown Model: Call Rate of 60 1 5 10 15 20 25 30 35 40Number of AntsFIGURE 10. Simulation results of Downtown call model using call rate of 6.Calls Blocked (%)109876543210Dowtown Model: Call Rate of 70 1 5 10 15 20 25 30 35 40Number of AntsFIGURE 11. Simulation results of Downtown call model using call rate of 7.22
Dynamic Cellular Channel Allocation using Intelligent Agents April 2005COMP 4905 Honours ProjectCalls Blocked (%)14121086420Dowtown Model: Call Rate of 80 1 5 10 15 20 25 30 35 40Number of AntsFIGURE 12. Simulation results of Downtown call model using call rate of 8.Calls Blocked (%)1614121086420Dowtown Model: Call Rate of 90 1 5 10 15 20 25 30 35 40Number of AntsFIGURE 13. Simulation results of Downtown call model using call rate of 9.Calls Blocked (%)1614121086420Dowtown Model: Call Rate of 100 1 5 10 15 20 25 30 35 40Number of AntsFIGURE 14. Simulation results of Downtown call model using call rate of 10.23
Dynamic Cellular Channel Allocation using Intelligent Agents April 2005COMP 4905 Honours ProjectThe agent-based solution using the Downtown call model produced excellent results. Each graphshows a very clear trend and correlation between the percentage of calls blocked and number ofants. As more ants were added to the system, the percentage of calls started to level off into aplateau. The only fluctuation seen was when one ant supported the network. And as the call rateincreased, the fluctuation grew larger. This is nothing to be concerned about since one ant is notconsidered a swarm and should not necessarily produce better results. In the situations were thelone ant produced worse results, the cause is not completely known. It could be possible that withsuch high call rates, the ant was shuffling channels in a way that caused more calls to be blocked.Considering the above call rates of three to ten, the agent-based solution reduced the number ofcalls blocked by 63% - 73%.Using the Dynamic Ant Adjustment feature also showed very good results. It surprisingly chosethe optimal number of ants that produced the lowest call blockage. And in the lower call rates, thedynamic number of ants produced very good results using fewer ants than the fixed method. Thenumber of calls blocked was reduced by an average of 67% using dynamic ants.4.1.2 Centre Hotspot Call ModelCalls Blocked (%)876543210Centre Hotspot Model: Call Rate of 30 1 5 10 15 20 25 30 35 40Number of AntsFIGURE 15. Simulation results of Centre Hotspot call model using call rate of 3.24
Dynamic Cellular Channel Allocation using Intelligent Agents April 2005COMP 4905 Honours Project12Centre Hotspot Model: Call Rate of 4Calls Blocked (%)10864200 1 5 10 15 20 25 30 35 40Number of AntsFIGURE 16. Simulation results of Centre Hotspot call model using call rate of 4.Calls Blocked (%)1614121086420Centre Hotspot Model: Call Rate of 50 1 5 10 15 20 25 30 35 40Number of AntsFIGURE 17. Simulation results of Centre Hotspot call model using call rate of 5.Calls Blocked (%)1614121086420Centre Hotspot Model: Call Rate of 60 1 5 10 15 20 25 30 35 40Number of AntsFIGURE 18. Simulation results of Centre Hotspot call model using call rate of 6.25
Dynamic Cellular Channel Allocation using Intelligent Agents April 2005COMP 4905 Honours ProjectCalls Blocked (%)181614121086420Centre Hotspot Model: Call Rate of 70 1 5 10 15 20 25 30 35 40Number of AntsFIGURE 19. Simulation results of Centre Hotspot call model using call rate of 7.Calls Blocked (%)20181614121086420Centre Hotspot Model: Call Rate of 80 1 5 10 15 20 25 30 35 40Number of AntsFIGURE 20. Simulation results of Centre Hotspot call model using call rate of 8.25Centre Hotspot Model: Call Rate of 9Calls Blocked (%)201510500 1 5 10 15 20 25 30 35 40Number of AntsFIGURE 21. Simulation results of Centre Hotspot call model using call rate of 9.26
Dynamic Cellular Channel Allocation using Intelligent Agents April 2005COMP 4905 Honours Project25Centre Hotspot Model: Call Rate of 10Calls Blocked (%)201510500 1 5 10 15 20 25 30 35 40Number of AntsFIGURE 22. Simulation results of Centre Hotspot call model using call rate of 10.Like the Downtown model, the Centre Hotspot call model produced good results when agentswere added. Again the graph would level off and plateau after a certain number of ants. With thiscall model, all situations with one ant showed a lower number of call blocks than the agent-lesssystem. One other interesting discovery of this call model is how evenly uniform the graphs arewhen compared with the Downtown model. The trend lines are very level, with little fluctuations.This is most likely because there is less cycles than the Downtown model, and gave the agentsmore time to adapt and settle into the predictable pattern. Simulations with the Centre Hotspotmodel produced a remarkable 71% - 82% reduction in calls blocked using agents (in all callrates).Again the results using the Dynamic Ant Adjustment were excellent. The number of ants adaptedvery well to the different call rates. The feature even produced better results with lower call ratesthan any of the fixed ants. But this could be due the fact that the simulation were run for threetimes longer than with fixed parameters (12,000 compared with 4000 seconds). Using the featurecaused an average reduction of 76% in calls blocked.27
Dynamic Cellular Channel Allocation using Intelligent Agents April 2005COMP 4905 Honours Project4.1.3 Random Hotspot Call ModelCalls Blocked (%)14121086420Random Hotspot Model: Call Rate of 30 1 5 10 15 20 25 30 35 40Number of AntsFIGURE 23. Simulation results of Random Hotspot call model using call rate of 3.Calls Blocked (%)181614121086420Random Hotspot Model: Call Rate of 40 1 5 10 15 20 25 30 35 40Number of AntsFIGURE 24. Simulation results of Random Hotspot call model using call rate of 4.25Random Hotspot Model: Call Rate of 5Calls Blocked (%)201510500 1 5 10 15 20 25 30 35 40Number of AntsFIGURE 25. Simulation results of Random Hotspot call model using call rate of 5.28
Dynamic Cellular Channel Allocation using Intelligent Agents April 2005COMP 4905 Honours Project25Random Hotspot Model: Call Rate of 6Calls Blocked (%)201510500 1 5 10 15 20 25 30 35 40Number of AntsFIGURE 26. Simulation results of Random Hotspot call model using call rate of 6.25Random Hotspot Model: Call Rate of 7Calls Blocked (%)201510500 1 5 10 15 20 25 30 35 40Number of AntsFIGURE 27. Simulation results of Random Hotspot call model using call rate of 7.30Random Hotspot Model: Call Rate of 8Calls Blocked (%)25201510500 1 5 10 15 20 25 30 35 40 45 50Number of AntsFIGURE 28. Simulation results of Random Hotspot call model using call rate of 8.29
Dynamic Cellular Channel Allocation using Intelligent Agents April 2005COMP 4905 Honours Project30Random Hotspot Model: Call Rate of 9Calls Blocked (%)25201510500 1 5 10 15 20 25 30 35 40 45 50Number of AntsFIGURE 29. Simulation results of Random Hotspot call model using call rate of 9.Calls Blocked (%)35302520151050Random Hotspot Model: Call Rate of 100 1 5 10 15 20 25 30 35 40 45 50Number of AntsFIGURE 30. Simulation results of Random Hotspot call model using call rate of 10.The simulation results using the Random Hotspot call model were different than previous results,but still very good. Adding ants in the network did lower the call blockage until it leveled off, butthere were more fluctuations. The graphs are not as even and uniform like the graphs in the othercall models. This is mainly because the hotspot was always in a random location every cycle. Theants were unable to adapt to network conditions as easily as the other two centre-oriented callmodels. Due to this, more fluctuations in the results should be expected. If the simulations wereaveraged over more runs, such as ten instead of five, the graphs should become more uniform.Agents in the Random Hotspot call model reduced the number of calls blocked by 55% - 77%.When the number of ants were allowed to adjust automatically, it sometimes resulted in more antsin the system than required. This was especially apparent with higher call rates. However, theadapted number of ants did result in a call blockage rate that was close to the minimum that was30
Dynamic Cellular Channel Allocation using Intelligent Agents April 2005COMP 4905 Honours Projectobtained using fixed ants. We could conclude that the random hotspots produced a high demandfor ants that resulted in higher ant populations, bu did not result in better call rates simply becausethe network is too stressed and could not be relieved by extra channel shuffling. When the antpopulation was able dynamically adjust, the call blockage was reduced by an average of 62%.4.3 Observations and AnalysisUpon examining all the above simulation results, we can confidently conclude that adding agentsto the cellular network produced better call rates under all conditions. All simulations leveled offto a plateau when more agents were added. Agents proved to work very well and self-organize todramatically reduce the percentage of calls blocked. Considering all call models, agents were ableto reduce the number of calls blocked by 55% - 82%. Agents in the Centre Hotspot call modelreduced the call blockage by an average of 77%. While agents in the Downtown and RandomHotspot model reduced the calls blocked by an average of 70% and 68%, respectively. The higherperformance results in the Centre Hotspot call model can be attributed to the less random networkconditions, allowing agents to adapt more easily to the centre-oriented network demand. Overall,the agent-based solution decreased the number of calls blocked by a remarkable 72%, consideringall simulated network scenarios. In contrary to previous simulations done by Lawlor, the callgeneration rate had no effect on the results. With high call rate such as nine or ten, when oneassumes the network may be too overloaded to have any affect, the addition of agents alwaysimproved network performance. Another interesting fact was when the simulation results attainedthe minimum call blockage rate, the addition of more agents did not overload the system butcontinued to produce the same performance results. Although the Random Hotspot modelgenerated more fluctuations in the graphs, the results were excellent. Agents were able to adaptefficiently to the continuous flow of random network hotspots.The results of the Dynamic Ant Adjustment feature were outstanding. The number of antsadapted very well to network conditions, producing call rates that were good as any of the fixedant methods. The system managed to adapt to an optimal minimal number of ants under everysituation, with the exception of the Random Hotspot. With higher call rates in the RandomHotspot model, more ants were spawned then required. But even with the higher ant populations,call rate results were not affected. An average 68% reduction in call blockage was achieved usingthe feature, considering all call models and call rates.31
Dynamic Cellular Channel Allocation using Intelligent Agents April 2005COMP 4905 Honours Project5. Conclusion5.1 Similar Work Done in FieldThere has been a great deal of work in the field of intelligent agents used for network control andmanagement. Considerable interest in this field arises from the decentralized nature of agenttechnology and the ability to adapt real-time to network conditions. One researcher by the nameKhaldoun Al agha had done similar work to this project by using intelligent agents associatedwith wireless networks to achieve adaptive resource allocation [Al agha, 2000].Al agha proposes a multi-agent solution for intelligent base stations in wireless networks. Agentsare able to combine knowledge and experience with neighboring agents to make the bestdecisions. This is achieved by agents cooperating, communicating, reasoning, and perceiving.Agents corresponding with a base station are capable of communicating its state to neighbors andlearning from past events in the environment to optimize the utilization of resources.The agent solution is used in conjunction with a resource allocation scheme known as ChannelSegregation (CS). Channel Segregation differs from traditional dynamic allocation schemesbecause it has a simple form of self-learning. It involves segregating physical channels from acommon pool by each base station to form a preferred list of channels. Base stations attempt toallocate channels at the top of their priority list. The learning aspect of CS is achieved though themethod priority lists are formed, resulting in differing lists across the network cells – andstabilizing over time. Simulation results have shown that the integration of intelligent agents withchannel segregation had improved call rates by decreasing the number of calls blocked.An overview of research done in the field of both Communication Networks (CN) andDistributed Artificial Intelligence (DAI) can be found in [Willmott and Calisti, 2000]. Willmottand Calisti identify current trends in agent-based network control and management. They discussareas that would most benefit from agent technologies and deployment strategies for agent basedsolutions. For a thorough summary of mobile agents in networks, the reader may refer to[Sriraman, 2002].32
Dynamic Cellular Channel Allocation using Intelligent Agents April 2005COMP 4905 Honours Project5.2 Future DevelopmentsUnder the current implementation, agents only interact with the environment, the network cells.An aspect of self-organization is the reliance on multiple interactions, and the ability of agents tomake use of the results of their own actions and the actions of others. The latter is not veryapparent in the current system – agents make very little use of the actions of others. The nextdevelopment process should include some sort of agent-to-agent communication. For example,agents can directly communicate with each other to share information or request for help in highdemand areas. This may be accomplished by agents simulating other agents, or cooperativenegotiation between agents. The latter was a proposed solution by Bigham, where agentsassociated with the cellular base station would negotiate with each other agents to optimize localcell coverage [Bigham and Du, 2003].Currently, agents can only steal a channel from a neighboring cell. This may not be too effectivewhen an agent is in the centre of a large hotspot, where there are no free channels available. Aproposed solution to this is to give agents the ability to steal-and-carry channels while movingthrough the network. While idle, if an agent comes across a cell with a high number of unusedchannels, it may steal some channels and carry them around with it. While working, the agent canthen deposit the stolen channels into a high demand cell. Note this feature would be used inaddition to the current ability of agents stealing channels from neighbors. With more optionsgiven to agents in the system, a higher form of intelligence should emerge, producing a more selforganizedswarm.An aspect of swarm intelligence is the concept of worker polymorphism, which basically statesthat different entities in a swarm are responsible for different tasks [Bonabeau et al., 1999]. Thesetasks depend on the class hierarchy of the swarm, and were the insect (or other animal) sits in thehierarchy. The idea of worker polymorphism may also be used for our agent-based network.Agents may begin there existence in the system by performing a specialized task, such asshuffling channels, stealing and carrying channels, or distributing network information. As timeprogresses, agents may begin to carry out different tasks or possibly multiple tasks - depending onthresholds. Thereby, agents adapt to the current requirements of the network and the swarm as awhole.33
Dynamic Cellular Channel Allocation using Intelligent Agents April 2005COMP 4905 Honours ProjectImprovements on the cellular simulation can also be made. As suggested by Lawlor, the callgeneration rate can change depending on time or call model cycle. A dynamic call rate wouldrepresent scenarios in actual cellular grids more accurately. This would also thoroughly test howagents adapt to changing conditions. Many have proposed the concept of dynamically adjustingthe cell size to improve performance in cellular networks [Togo et al., 1998] [Du et al., 2002].This may be implemented into the current system in conjunction with intelligent agents, possiblygiving the agents control of cell size.5.3 SummaryThe previous agent-based solution had some apparent problems. Most importantly, the fact thateverything was random produced a network that was also too random for agents to have anyconsistent affects. The introduction of the different call models produced an environment foragents to interact and exhibit a form of swarm intelligence.Examination of simulation results has shown us that significant improvements have been madeover the previous agent-based solution. Agents in the network consistently produced better callrates in every condition. Agents were able to successfully self-organize and adapt to networkconditions, such as differing call generation rates and call models. The dynamic approach for antpopulation also produced excellent results. The number of ants were able to adapt to a minimumnumber in most cases. Compared with the fixed channel network, agents decreased the number ofcalls blocked by an average of 72%, and 68% when given the ability to change the population.We can confidently conclude that the agent-based solution for dynamic channel allocation incellular telephone networks is feasible. Using division of labor and adaptive task allocation,mobile agents modeled after social insects produced a decentralized, robust, and adaptive system.The simple interconnected agents were able to self-organize and exhibit intelligent behavior todramatically decrease blocked call rates.However, the project is still open to further research and development. A primary goal of the nextphase should be direct agent-to-agent communication, leading to higher intelligence and selforganizationabilities. The cellular simulation could also be modified to represent more realisticsituations, such as dynamic call generation rates and additional call models.34
Dynamic Cellular Channel Allocation using Intelligent Agents April 2005COMP 4905 Honours ProjectReferences[Al agha, 2000]Al agha, K. (2000) Resource management in wireless networks using intelligent agents,International Journal of Network Management, 10:29-39.[Bigham and Du, 2003]Bigham, J., Du, L. (2003) Cooperative Negotiation in a Multi-Agent System for Real-TimeLoad Balancing of a Mobile Cellular Network, Association for Computing Machinery.[Bonabeau et al., 1999]Bonabeau, E., Dorigo, M., Theraulaz, G. (1999) Swarm Intelligence: From Natural toArtificial <strong>Systems</strong>, Oxford University Press.[Du et al., 2002]Du, L., Bigham. J., Cuthbert, L., Parini, C., Nahi, P. (2002) Cell Size and Shape AdjustmentDepending on Call Traffic Distribution, IEEE.[Johnson, 2001]Johnson, S. (2001) Emergence: The Connected Lives of Ants, Brains, Cities, and Software,Scribner.[Lawlor, 2002]Lawlor, M. (2002) A Self Organizing Social Insect Model for Frequency Allocation inCellular Telephone Networks, Carleton University Honours Project.[Sriraman, 2002]Sriraman, S. (2002) An Annotated Bibliography of Mobile Agents in Networks, University ofNorth Texas.[Togo et al., 1998]Togo, T., Yoshii, I., Kohno, R. (1998) Dynamic Cell-size Control According to GeographicalMobile Distribution in a DS/CDMA Cellular System, IEEE.[Willmott and Calisti, 2000]Willmott, S., Calisti. M. (2000) An Agent Future for Network Control?,Informatik/Informatique, Number 1, February 2000.35
Dynamic Cellular Channel Allocation using Intelligent Agents April 2005COMP 4905 Honours ProjectAppendix A – Simulation TablesThe following tables show all the statistical data obtained for each of the simulations done insection 4 - Experimentation. The last line of each table represents the results of using theDynamic Ant Adjustment feature. To keep the table columns a reasonable size, headings areabbreviated. Refer to the following legend for a full description of each heading:ATCTHIPBCBHBC%BH%NL%SCSC/ANumber of AntsTotal CallsTotal HandoffsTotal In Progress Calls at End of RunTotal Blocked CallsTotal Blocked HandoffsBlocked Call PercentageBlocked Handoff PercentageNetwork Load Percentage at End of RunTotal Stolen ChannelsTotal Stolen Channels per AntDowtown Call ModelA TC TH IP BC BH BC% BH% NL% SC SC/A0 4880 6024 216 126 49 2.58 0.83 21 0 01 4863 6030 217 84 36 1.73 0.61 21 549 5495 4891 6037 214 45 22 0.94 0.37 21 759 15210 4899 6102 228 50 24 1.02 0.41 22 868 8715 4868 6174 220 44 22 0.92 0.37 22 844 5620 4881 6160 219 42 20 0.87 0.32 22 869 4325 4846 6141 202 49 24 1.02 0.40 20 847 3430 4883 6048 218 42 24 0.87 0.40 21 885 3035 4880 6197 219 49 23 1.00 0.37 22 927 2640 4884 6030 214 34 18 0.70 0.31 21 862 221 14624 19756 213 124 65 0.85 0.33 21 1763 88TABLE A-1: Simulation data of Downtown call model using call rate of 3.A TC TH IP BC BH BC% BH% NL% SC SC/A0 6075 7123 268 263 110 4.33 1.55 26 0 01 6041 7345 256 199 85 3.30 1.16 25 767 7675 6106 7606 266 112 56 1.84 0.74 26 1548 31010 6011 7409 273 102 47 1.70 0.64 27 1560 15615 6039 7345 262 98 48 1.63 0.65 26 1524 10220 6005 7474 256 106 51 1.77 0.69 26 1680 8425 6074 7525 268 106 59 1.75 0.79 27 1633 6530 6073 7498 265 104 51 1.72 0.69 26 1654 5535 6053 7545 268 107 54 1.77 0.73 26 1694 4840 6050 7458 263 100 50 1.65 0.68 26 1682 423 18114 23659 272 281 149 1.55 0.63 27 4030 202TABLE A-2: Simulation data of Downtown call model using call rate of 4.A-1
Dynamic Cellular Channel Allocation using Intelligent Agents April 2005COMP 4905 Honours ProjectA TC TH IP BC BH BC% BH% NL% SC SC/A0 7139 8332 312 449 171 6.30 2.06 31 0 01 7049 8277 298 395 177 5.60 2.14 29 804 8045 7073 8699 304 190 101 2.69 1.17 30 2330 46610 7089 8579 320 175 89 2.47 1.05 32 2515 25215 7076 8612 315 177 92 2.51 1.07 31 2587 17220 7105 8799 314 154 82 2.17 0.94 31 2784 13925 7035 8767 320 158 81 2.26 0.93 32 2648 10630 7059 8603 314 165 86 2.34 1.00 31 2538 8535 7065 8565 317 142 70 2.02 0.82 31 2582 7440 7091 8626 310 135 66 1.91 0.77 31 2783 704 21356 27735 308 419 226 1.97 0.81 31 6897 345TABLE A-3: Simulation data of Downtown call model using call rate of 5.A TC TH IP BC BH BC% BH% NL% SC SC/A0 8071 8995 352 641 247 7.94 2.75 35 0 01 8111 9007 333 620 275 7.64 3.06 33 801 8015 8107 9619 352 302 159 3.73 1.65 35 3136 62710 8023 9840 343 247 126 3.08 1.29 34 3863 38615 8059 9744 361 197 106 2.45 1.10 36 3975 26520 8135 9866 352 218 113 2.68 1.15 35 4055 20325 8118 9917 362 228 114 2.82 1.15 36 4253 17030 8082 9558 354 226 116 2.81 1.22 35 3895 13035 8099 9836 353 227 115 2.80 1.17 35 4005 11440 8074 9789 349 194 100 2.41 1.02 35 4135 1037 24197 31105 350 666 366 2.75 1.18 35 11156 558TABLE A-4: Simulation data of Downtown call model using call rate of 6.A TC TH IP BC BH BC% BH% NL% SC SC/A0 8899 9725 381 832 316 9.35 3.26 38 0 01 8926 9570 355 846 361 9.48 3.78 35 798 7985 9014 10418 362 459 239 5.10 2.30 36 3636 72710 8925 10555 372 300 159 3.37 1.51 37 5100 51015 9028 10710 398 299 165 3.31 1.54 40 5519 36820 8999 10794 385 280 143 3.11 1.33 38 5690 28525 8994 10883 381 284 151 3.17 1.39 38 5635 22530 8991 10885 390 279 150 3.11 1.39 39 5742 19135 9027 10908 394 287 143 3.18 1.31 39 5845 16740 9031 10902 400 263 135 2.91 1.25 40 5805 14511 26954 34226 393 825 446 3.06 1.31 39 16337 817TABLE A-5: Simulation data of Downtown call model using call rate of 7.A-2
Dynamic Cellular Channel Allocation using Intelligent Agents April 2005COMP 4905 Honours ProjectA TC TH IP BC BH BC% BH% NL% SC SC/A0 9870 10510 401 1094 399 11.09 3.80 40 0 01 9881 10112 383 1150 468 11.64 4.63 38 795 7955 9761 11181 399 605 307 6.21 2.74 40 3756 75110 9886 11805 424 403 218 4.08 1.84 42 6535 65415 9758 11490 427 397 202 4.07 1.76 42 6677 44520 9805 11814 438 328 179 3.35 1.52 44 7226 36125 9852 11793 419 313 169 3.19 1.44 42 7870 31530 9863 11672 425 339 182 3.44 1.57 42 7606 25435 9846 11736 439 333 169 3.39 1.44 44 7902 22640 9847 11927 414 333 174 3.38 1.47 41 8137 20316 29415 37443 424 932 512 3.17 1.37 42 23086 1154TABLE A-6: Simulation data of Downtown call model using call rate of 8.A TC TH IP BC BH BC% BH% NL% SC SC/A0 10665 11118 468 1335 478 12.52 4.30 46 0 01 10656 10936 427 1423 603 13.36 5.52 42 797 7975 10610 11373 410 872 436 8.22 3.83 41 3768 75410 10655 12262 455 564 291 5.30 2.38 45 7142 71415 10624 12376 458 465 247 4.39 2.00 45 8695 58020 10614 12387 460 404 217 3.81 1.76 46 9657 48325 10589 12452 447 432 235 4.08 1.89 44 9863 39530 10660 12667 465 424 222 3.98 1.76 46 10701 35735 10751 12944 455 421 228 3.92 1.76 45 10871 31140 10662 12634 493 390 211 3.67 1.68 49 10194 25520 31910 40685 468 1204 686 3.77 1.69 47 30657 1533TABLE A-7: Simulation data of Downtown call model using call rate of 9.A TC TH IP BC BH BC% BH% NL% SC SC/A0 11400 11415 481 1535 547 13.47 4.79 48 0 01 11440 11180 426 1694 705 14.81 6.32 42 779 7795 11409 11981 438 1136 551 9.96 4.60 44 3724 74510 11390 12779 447 754 397 6.62 3.11 44 7525 75315 11384 13164 469 569 313 5.00 2.38 47 10269 68520 11346 13129 487 522 278 4.61 2.12 49 11510 57625 11347 13265 502 457 252 4.02 1.90 50 12656 50630 11427 13767 487 444 237 3.88 1.73 48 13200 44035 11413 13632 491 412 226 3.61 1.66 49 14057 40240 11424 13557 496 444 240 3.89 1.77 49 13643 34120 34199 42411 478 1492 814 4.36 1.92 48 36980 1849TABLE A-8: Simulation data of Downtown call model using call rate of 10.A-3
Dynamic Cellular Channel Allocation using Intelligent Agents April 2005COMP 4905 Honours ProjectCentre Hotspot Call ModelA TC TH IP BC BH BC% BH% NL% SC SC/A0 4848 5463 187 341 188 7.03 3.45 19 0 01 4902 5934 208 151 76 3.09 1.28 20 620 6205 4864 6068 223 79 45 1.64 0.75 22 865 17310 4891 6143 215 86 46 1.77 0.76 21 901 9015 4873 5975 221 79 44 1.62 0.74 22 875 5820 4860 6090 219 85 41 1.75 0.67 22 977 4925 4868 6090 218 87 45 1.79 0.75 22 892 3630 4879 6031 217 85 42 1.74 0.71 21 931 3135 4847 5889 215 74 38 1.54 0.65 21 893 2640 4828 6006 218 77 39 1.61 0.66 22 904 231 14597 19329 205 162 88 1.11 0.46 20 1780 89TABLE A-9: Simulation data of Centre Hotspot call model using call rate of 3.A TC TH IP BC BH BC% BH% NL% SC SC/A0 6029 6520 198 650 319 10.78 4.91 19 0 01 6027 6876 243 329 167 5.47 2.44 24 761 7615 6047 7353 276 142 75 2.36 1.03 27 1483 29710 6086 7520 281 150 81 2.48 1.08 28 1682 16815 6124 7548 255 128 65 2.09 0.88 25 1674 11220 6059 7449 266 133 73 2.20 0.99 26 1632 8225 6069 7478 271 131 66 2.17 0.88 27 1672 6730 6075 7318 270 117 64 1.93 0.88 27 1699 5735 6028 7255 275 135 73 2.25 1.01 27 1537 4440 6036 7287 271 138 75 2.30 1.04 27 1573 392 18068 23545 264 272 141 1.51 0.60 26 3927 196TABLE A-10: Simulation data of Centre Hotspot call model using call rate of 4.A TC TH IP BC BH BC% BH% NL% SC SC/A0 7130 7323 237 955 456 13.41 6.23 23 0 01 7068 7857 285 612 282 8.65 3.59 28 786 7865 7046 8483 302 227 114 3.23 1.35 30 2364 47310 7017 8644 312 191 108 2.73 1.26 31 2420 24215 7080 8598 293 169 90 2.39 1.05 29 2553 17020 7072 8699 311 184 94 2.62 1.09 31 2791 14025 7085 8867 305 168 91 2.38 1.03 30 2848 11430 7130 8681 305 168 85 2.36 0.99 30 2695 9035 7069 8656 307 169 88 2.40 1.01 30 2699 7740 7094 8580 310 190 96 2.69 1.12 31 2837 714 21251 27648 321 504 278 2.37 1.01 32 6995 350TABLE A-11: Simulation data of Centre Hotspot call model using call rate of 5.A-4
Dynamic Cellular Channel Allocation using Intelligent Agents April 2005COMP 4905 Honours ProjectA TC TH IP BC BH BC% BH% NL% SC SC/A0 8006 7921 242 1181 523 14.75 6.61 24 0 01 8015 8467 304 825 380 10.30 4.50 30 792 7925 8050 9328 357 330 167 4.11 1.80 35 3025 60510 8065 9590 336 302 163 3.74 1.71 33 3732 37315 8042 9804 353 298 156 3.71 1.59 35 3881 25920 8013 9540 337 283 154 3.53 1.62 33 4045 20225 8020 9728 353 261 148 3.26 1.53 35 4114 16530 8042 9665 355 268 141 3.34 1.46 35 4060 13535 8050 9589 349 270 154 3.36 1.60 34 4124 11840 8104 9725 348 256 134 3.17 1.39 34 4348 1098 24229 30973 344 889 493 3.67 1.59 34 11307 565TABLE A-12: Simulation data of Centre Hotspot call model using call rate of 6.A TC TH IP BC BH BC% BH% NL% SC SC/A0 8904 8673 251 1498 631 16.82 7.29 25 0 01 8995 9089 314 1168 514 12.98 5.66 31 778 7785 9027 10251 367 613 313 6.79 3.05 36 3472 69410 8926 10435 363 434 231 4.86 2.21 36 4740 47415 9044 10584 381 424 228 4.69 2.16 38 5655 37720 8968 10629 377 387 203 4.31 1.91 37 5564 27825 8955 10575 364 378 203 4.22 1.93 36 5870 23530 9046 10749 380 379 205 4.19 1.92 38 6222 20735 8890 10461 367 351 189 3.95 1.81 36 5945 17040 8972 10568 378 369 196 4.12 1.86 38 6019 15011 26936 33629 377 1290 696 4.79 2.07 37 16434 822TABLE A-13: Simulation data of Centre Hotspot call model using call rate of 7.A TC TH IP BC BH BC% BH% NL% SC SC/A0 9808 9373 266 1779 734 18.14 7.84 26 0 01 9745 9551 318 1532 646 15.72 6.76 31 763 7635 9800 10818 397 780 394 7.96 3.65 40 3645 72910 9770 11128 386 570 307 5.84 2.77 38 5972 59715 9790 11278 390 534 293 5.46 2.60 39 7039 46920 9823 11342 391 515 277 5.25 2.45 39 7479 37425 9860 11316 407 519 275 5.27 2.43 40 8036 32130 9889 11644 389 471 253 4.76 2.17 39 8338 27835 9795 11458 405 503 277 5.13 2.42 40 7933 22740 9852 11505 420 479 252 4.86 2.19 42 7958 19919 29424 36378 411 1551 863 5.27 2.37 41 24309 1215TABLE A-14: Simulation data of Centre Hotspot call model using call rate of 8.A-5
Dynamic Cellular Channel Allocation using Intelligent Agents April 2005COMP 4905 Honours ProjectA TC TH IP BC BH BC% BH% NL% SC SC/A0 10671 9992 293 2125 831 19.92 8.33 29 0 01 10688 10302 340 1873 765 17.53 7.43 34 742 7425 10658 11171 403 1147 560 10.76 5.02 40 3682 73610 10716 11763 425 826 430 7.71 3.66 42 6702 67015 10603 11957 415 698 375 6.59 3.14 41 8658 57720 10626 12341 432 674 358 6.35 2.91 43 10061 50325 10660 12439 443 636 349 5.97 2.80 44 10785 43130 10650 12377 420 629 340 5.91 2.75 42 11339 37835 10574 12193 423 607 332 5.74 2.73 42 10698 30640 10694 12354 427 605 337 5.66 2.74 42 11052 27620 31836 38846 434 1908 1060 6.00 2.73 43 32032 1602TABLE A-15: Simulation data of Centre Hotspot call model using call rate of 9.A TC TH IP BC BH BC% BH% NL% SC SC/A0 11445 10492 291 2439 906 21.31 8.64 29 0 01 11447 10504 334 2237 889 19.53 8.46 33 718 7185 11428 11776 426 1445 688 12.65 5.85 42 3673 73510 11418 12253 442 1067 534 9.34 4.36 44 6975 69815 11358 12290 452 842 435 7.42 3.54 45 9746 65020 11392 12878 453 807 427 7.09 3.32 45 11736 58725 11389 12803 450 769 411 6.76 3.21 44 12803 51230 11418 13070 449 740 394 6.49 3.02 45 13431 44835 11390 12954 462 704 379 6.18 2.93 46 13853 39640 11390 12883 449 689 371 6.06 2.88 45 13463 33720 34309 40685 452 2471 1354 7.20 3.33 45 39488 1974TABLE A-16: Simulation data of Centre Hotspot call model using call rate of 10.Random Hotspot Call ModelA TC TH IP BC BH BC% BH% NL% SC SC/A0 4883 5136 150 648 260 13.29 5.08 15 0 01 4859 5330 186 458 205 9.44 3.86 18 691 6915 4880 5885 211 196 93 4.03 1.60 21 1966 39310 4875 5742 196 218 110 4.48 1.93 19 2150 21515 4878 5850 213 249 130 5.11 2.23 21 2159 14420 4890 5937 206 146 84 3.00 1.44 20 2453 12325 4874 5957 216 165 88 3.39 1.50 22 2477 9930 4872 5879 219 185 102 3.81 1.74 22 2133 7135 4869 5781 203 195 95 4.01 1.67 20 2373 6840 4969 5985 209 175 87 3.53 1.46 20 2528 638 14695 17930 196 779 380 5.31 2.12 19 5886 294TABLE A-17: Simulation data of Random Hotspot call model using call rate of 3.A-6
Dynamic Cellular Channel Allocation using Intelligent Agents April 2005COMP 4905 Honours ProjectA TC TH IP BC BH BC% BH% NL% SC SC/A0 6024 6001 181 1000 356 16.62 5.96 18 0 01 6054 6392 190 755 325 12.49 5.10 19 749 7495 6092 6813 235 454 210 7.46 3.11 23 2619 52410 6005 7012 261 297 157 4.96 2.27 26 3532 35315 6034 6913 231 388 200 6.44 2.95 23 3008 20120 6027 7020 251 332 168 5.52 2.43 25 3214 16125 6112 7263 266 273 138 4.48 1.91 26 3859 15430 5968 6973 253 245 126 4.11 1.82 25 3195 10735 6103 7281 245 311 153 5.11 2.11 24 3422 9840 6056 7303 254 248 119 4.11 1.64 25 3744 9412 18080 22046 262 1075 499 5.94 2.26 26 10811 541TABLE A-18: Simulation data of Random Hotspot call model using call rate of 4.A TC TH IP BC BH BC% BH% NL% SC SC/A0 7110 6812 182 1461 476 20.57 7.00 18 0 01 7064 6916 204 1201 448 17.00 6.49 20 716 7165 7080 7618 254 760 356 10.74 4.71 25 2853 57110 7082 7916 254 591 281 8.36 3.55 25 4009 40115 7123 8123 287 489 238 6.88 2.94 28 4738 31620 7081 8071 278 443 203 6.26 2.56 28 5053 25325 7115 8290 313 356 185 5.01 2.25 31 5503 22030 7041 8123 293 414 213 5.89 2.65 29 4450 14835 7100 8152 286 399 189 5.62 2.34 28 5524 15840 7084 8280 296 349 176 4.92 2.17 29 6299 15728 21266 25844 300 1361 661 6.40 2.57 30 16950 848TABLE A-19: Simulation data of Random Hotspot call model using call rate of 5.A TC TH IP BC BH BC% BH% NL% SC SC/A0 8021 7726 201 1563 554 19.49 7.19 20 0 01 8096 7704 218 1598 560 19.75 7.28 21 698 6985 8046 8282 297 989 426 12.28 5.19 29 3103 62110 8050 8887 280 776 359 9.64 4.06 28 4962 49615 8017 9000 306 704 314 8.79 3.51 30 5922 39520 8085 9132 315 566 275 7.01 3.04 31 6717 33625 8058 9037 311 665 322 8.26 3.59 30 6580 26330 8122 9227 314 538 266 6.63 2.91 31 7374 24635 8032 9122 323 571 278 7.11 3.11 32 7558 21640 8104 9288 322 566 252 6.98 2.73 32 7176 17933 24202 28646 328 1888 884 7.80 3.10 32 22390 1120TABLE A-20: Simulation data of Random Hotspot call model using call rate of 6.A-7
Dynamic Cellular Channel Allocation using Intelligent Agents April 2005COMP 4905 Honours ProjectA TC TH IP BC BH BC% BH% NL% SC SC/A0 8973 8405 206 1983 641 22.11 7.63 20 0 01 8968 7979 229 2124 640 23.69 8.04 22 663 6635 9033 9210 297 1377 550 15.23 5.99 29 3235 64710 9027 9491 310 1071 469 11.87 4.96 31 5344 53415 8965 9725 349 769 347 8.58 3.60 35 7120 47520 8912 9947 344 629 295 7.05 2.98 34 7737 38725 8945 10030 359 704 339 7.86 3.42 36 7476 29930 9004 10336 352 654 312 7.27 3.02 35 8751 29235 9012 10054 328 792 371 8.79 3.76 33 8191 23440 8929 10138 337 627 301 7.02 2.98 33 9143 22937 27048 31878 357 2298 1088 8.50 3.42 35 28533 1427TABLE A-21: Simulation data of Random Hotspot call model using call rate of 7.A TC TH IP BC BH BC% BH% NL% SC SC/A0 9753 8725 202 2411 721 24.72 8.26 20 0 01 9854 8572 246 2354 776 23.88 9.06 24 706 7065 9818 9577 328 1578 619 16.07 6.48 32 3405 68110 9815 10078 319 1361 539 13.87 5.36 31 5715 57215 9863 10325 335 1224 533 12.41 5.20 33 7542 50320 9752 10341 362 1078 478 11.03 4.67 36 8272 41425 9827 10478 361 1049 466 10.67 4.46 36 9062 36230 9824 10534 355 1065 474 10.85 4.56 35 8709 29035 9891 10737 354 1043 470 10.54 4.39 35 9712 27740 9816 10922 394 839 411 8.55 3.80 39 10356 25946 29527 34429 399 2560 1277 8.67 3.71 40 33597 1680TABLE A-22: Simulation data of Random Hotspot call model using call rate of 8.A TC TH IP BC BH BC% BH% NL% SC SC/A0 10654 9004 221 3022 758 28.36 8.43 22 0 01 10536 9417 252 2550 852 24.22 9.05 25 668 6685 10598 9809 310 2112 754 19.94 7.75 31 3162 63210 10584 10568 344 1643 656 15.52 6.22 34 6034 60315 10725 10921 355 1444 620 13.45 5.69 35 8154 54420 10729 11508 370 1303 557 12.15 4.87 37 9902 49525 10594 11233 378 1291 579 12.20 5.17 38 10139 40630 10550 11513 371 1049 496 9.94 4.34 37 10861 36235 10598 11075 376 1095 507 10.35 4.62 37 10810 30940 10667 11467 375 1076 494 10.10 4.36 37 11451 28648 31818 35980 372 3420 1583 10.75 4.41 37 38245 1912TABLE A-23: Simulation data of Random Hotspot call model using call rate of 9.A TC TH IP BC BH BC% BH% NL% SC SC/A0 11407 9490 257 3135 842 27.49 8.86 25 0 01 11419 9189 261 3350 908 29.34 9.88 26 638 6385 11372 10060 333 2590 895 22.76 8.90 33 3079 61610 11421 11482 358 1791 720 15.67 6.30 36 6592 65915 11437 11267 379 1757 680 15.35 6.06 37 8353 55720 11347 11726 385 1438 638 12.68 5.45 38 10403 52025 11448 11829 402 1475 689 12.88 5.87 40 10885 43530 11476 12115 387 1412 605 12.30 5.03 38 12715 42435 11448 11770 366 1527 696 13.32 5.93 36 11190 32040 11490 11721 388 1596 704 13.90 6.05 39 11441 28650 34160 38117 385 4018 1834 11.76 4.82 38 44406 2220TABLE A-24: Simulation data of Random Hotspot call model using call rate of 10.A-8
Dynamic Cellular Channel Allocation using Intelligent Agents April 2005COMP 4905 Honours ProjectAppendix B – Contents of Project CDThe following is a list of files and folders contained in the CD that accompanies this report.Final Report.docHonours Proposal.docProgress Report.docAntwork\Antwork Backups\Simulation Files\Articles and Papers\Michael Lawlor\Final honours project report.Honours project proposal.Project progress report.Folder containing all source code for Java cellular simulation. Toexecute program, compile and run NetworkFrame.java.Folder containing old versions of Antwork (Java simulation) thatwere saved during the development process.Folder containing log files for all simulations shown in thereport.Various articles and papers collected during lifecycle of project.Includes relevant topics on cellular networks, intelligent agents,dynamic channel and frequency allocation, agents used innetwork management, etc.Folder containing all original work done by Michael Lawlor,including original Java simulation source code.B-1