Gayan Abeysundara - Complex Adaptive Systems Group
Gayan Abeysundara - Complex Adaptive Systems Group
Gayan Abeysundara - Complex Adaptive Systems Group

Create successful ePaper yourself
Turn your PDF publications into a flip-book with our unique Google optimized e-Paper software.
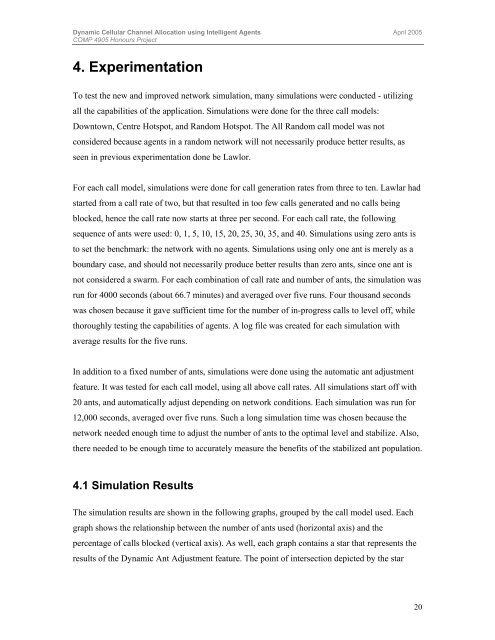
Dynamic Cellular Channel Allocation using Intelligent Agents April 2005COMP 4905 Honours Project4. ExperimentationTo test the new and improved network simulation, many simulations were conducted - utilizingall the capabilities of the application. Simulations were done for the three call models:Downtown, Centre Hotspot, and Random Hotspot. The All Random call model was notconsidered because agents in a random network will not necessarily produce better results, asseen in previous experimentation done be Lawlor.For each call model, simulations were done for call generation rates from three to ten. Lawlar hadstarted from a call rate of two, but that resulted in too few calls generated and no calls beingblocked, hence the call rate now starts at three per second. For each call rate, the followingsequence of ants were used: 0, 1, 5, 10, 15, 20, 25, 30, 35, and 40. Simulations using zero ants isto set the benchmark: the network with no agents. Simulations using only one ant is merely as aboundary case, and should not necessarily produce better results than zero ants, since one ant isnot considered a swarm. For each combination of call rate and number of ants, the simulation wasrun for 4000 seconds (about 66.7 minutes) and averaged over five runs. Four thousand secondswas chosen because it gave sufficient time for the number of in-progress calls to level off, whilethoroughly testing the capabilities of agents. A log file was created for each simulation withaverage results for the five runs.In addition to a fixed number of ants, simulations were done using the automatic ant adjustmentfeature. It was tested for each call model, using all above call rates. All simulations start off with20 ants, and automatically adjust depending on network conditions. Each simulation was run for12,000 seconds, averaged over five runs. Such a long simulation time was chosen because thenetwork needed enough time to adjust the number of ants to the optimal level and stabilize. Also,there needed to be enough time to accurately measure the benefits of the stabilized ant population.4.1 Simulation ResultsThe simulation results are shown in the following graphs, grouped by the call model used. Eachgraph shows the relationship between the number of ants used (horizontal axis) and thepercentage of calls blocked (vertical axis). As well, each graph contains a star that represents theresults of the Dynamic Ant Adjustment feature. The point of intersection depicted by the star20