Statistical Discriminator of Surface Defects on Hot Rolled Steel
Statistical Discriminator of Surface Defects on Hot Rolled Steel
Statistical Discriminator of Surface Defects on Hot Rolled Steel

You also want an ePaper? Increase the reach of your titles
YUMPU automatically turns print PDFs into web optimized ePapers that Google loves.
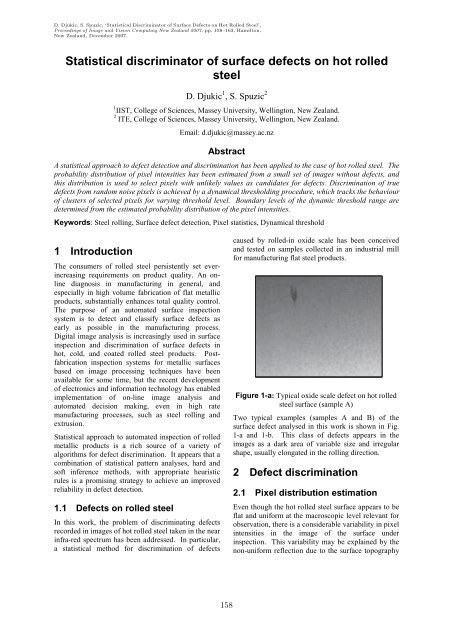
D. Djukic, S. Spuzic, ‘<str<strong>on</strong>g>Statistical</str<strong>on</strong>g> <str<strong>on</strong>g>Discriminator</str<strong>on</strong>g> <str<strong>on</strong>g>of</str<strong>on</strong>g> <str<strong>on</strong>g>Surface</str<strong>on</strong>g> <str<strong>on</strong>g>Defects</str<strong>on</strong>g> <strong>on</strong> <strong>Hot</strong> <strong>Rolled</strong> <strong>Steel</strong>’,Proceedings <str<strong>on</strong>g>of</str<strong>on</strong>g> Image and Visi<strong>on</strong> Computing New Zealand 2007, pp. 158–163, Hamilt<strong>on</strong>,New Zealand, December 2007.<str<strong>on</strong>g>Statistical</str<strong>on</strong>g> discriminator <str<strong>on</strong>g>of</str<strong>on</strong>g> surface defects <strong>on</strong> hot rolledsteelD. Djukic 1 , S. Spuzic 21 IIST, College <str<strong>on</strong>g>of</str<strong>on</strong>g> Sciences, Massey University, Wellingt<strong>on</strong>, New Zealand.2 ITE, College <str<strong>on</strong>g>of</str<strong>on</strong>g> Sciences, Massey University, Wellingt<strong>on</strong>, New Zealand.Email: d.djukic@massey.ac.nzAbstractA statistical approach to defect detecti<strong>on</strong> and discriminati<strong>on</strong> has been applied to the case <str<strong>on</strong>g>of</str<strong>on</strong>g> hot rolled steel. Theprobability distributi<strong>on</strong> <str<strong>on</strong>g>of</str<strong>on</strong>g> pixel intensities has been estimated from a small set <str<strong>on</strong>g>of</str<strong>on</strong>g> images without defects, andthis distributi<strong>on</strong> is used to select pixels with unlikely values as candidates for defects. Discriminati<strong>on</strong> <str<strong>on</strong>g>of</str<strong>on</strong>g> truedefects from random noise pixels is achieved by a dynamical thresholding procedure, which tracks the behaviour<str<strong>on</strong>g>of</str<strong>on</strong>g> clusters <str<strong>on</strong>g>of</str<strong>on</strong>g> selected pixels for varying threshold level. Boundary levels <str<strong>on</strong>g>of</str<strong>on</strong>g> the dynamic threshold range aredetermined from the estimated probability distributi<strong>on</strong> <str<strong>on</strong>g>of</str<strong>on</strong>g> the pixel intensities.Keywords: <strong>Steel</strong> rolling, <str<strong>on</strong>g>Surface</str<strong>on</strong>g> defect detecti<strong>on</strong>, Pixel statistics, Dynamical threshold1 Introducti<strong>on</strong>The c<strong>on</strong>sumers <str<strong>on</strong>g>of</str<strong>on</strong>g> rolled steel persistently set everincreasingrequirements <strong>on</strong> product quality. An <strong>on</strong>linediagnosis in manufacturing in general, andespecially in high volume fabricati<strong>on</strong> <str<strong>on</strong>g>of</str<strong>on</strong>g> flat metallicproducts, substantially enhances total quality c<strong>on</strong>trol.The purpose <str<strong>on</strong>g>of</str<strong>on</strong>g> an automated surface inspecti<strong>on</strong>system is to detect and classify surface defects asearly as possible in the manufacturing process.Digital image analysis is increasingly used in surfaceinspecti<strong>on</strong> and discriminati<strong>on</strong> <str<strong>on</strong>g>of</str<strong>on</strong>g> surface defects inhot, cold, and coated rolled steel products. Postfabricati<strong>on</strong>inspecti<strong>on</strong> systems for metallic surfacesbased <strong>on</strong> image processing techniques have beenavailable for some time, but the recent development<str<strong>on</strong>g>of</str<strong>on</strong>g> electr<strong>on</strong>ics and informati<strong>on</strong> technology has enabledimplementati<strong>on</strong> <str<strong>on</strong>g>of</str<strong>on</strong>g> <strong>on</strong>-line image analysis andautomated decisi<strong>on</strong> making, even in high ratemanufacturing processes, such as steel rolling andextrusi<strong>on</strong>.<str<strong>on</strong>g>Statistical</str<strong>on</strong>g> approach to automated inspecti<strong>on</strong> <str<strong>on</strong>g>of</str<strong>on</strong>g> rolledmetallic products is a rich source <str<strong>on</strong>g>of</str<strong>on</strong>g> a variety <str<strong>on</strong>g>of</str<strong>on</strong>g>algorithms for defect discriminati<strong>on</strong>. It appears that acombinati<strong>on</strong> <str<strong>on</strong>g>of</str<strong>on</strong>g> statistical pattern analyses, hard ands<str<strong>on</strong>g>of</str<strong>on</strong>g>t inference methods, with appropriate heuristicrules is a promising strategy to achieve an improvedreliability in defect detecti<strong>on</strong>.1.1 <str<strong>on</strong>g>Defects</str<strong>on</strong>g> <strong>on</strong> rolled steelIn this work, the problem <str<strong>on</strong>g>of</str<strong>on</strong>g> discriminating defectsrecorded in images <str<strong>on</strong>g>of</str<strong>on</strong>g> hot rolled steel taken in the nearinfra-red spectrum has been addressed. In particular,a statistical method for discriminati<strong>on</strong> <str<strong>on</strong>g>of</str<strong>on</strong>g> defectscaused by rolled-in oxide scale has been c<strong>on</strong>ceivedand tested <strong>on</strong> samples collected in an industrial millfor manufacturing flat steel products.Figure 1-a: Typical oxide scale defect <strong>on</strong> hot rolledsteel surface (sample A)Two typical examples (samples A and B) <str<strong>on</strong>g>of</str<strong>on</strong>g> thesurface defect analysed in this work is shown in Fig.1-a and 1-b. This class <str<strong>on</strong>g>of</str<strong>on</strong>g> defects appears in theimages as a dark area <str<strong>on</strong>g>of</str<strong>on</strong>g> variable size and irregularshape, usually el<strong>on</strong>gated in the rolling directi<strong>on</strong>.2 Defect discriminati<strong>on</strong>2.1 Pixel distributi<strong>on</strong> estimati<strong>on</strong>Even though the hot rolled steel surface appears to beflat and uniform at the macroscopic level relevant forobservati<strong>on</strong>, there is a c<strong>on</strong>siderable variability in pixelintensities in the image <str<strong>on</strong>g>of</str<strong>on</strong>g> the surface underinspecti<strong>on</strong>. This variability may be explained by then<strong>on</strong>-uniform reflecti<strong>on</strong> due to the surface topography158
and texture, by the changes in the ambient light, andby randomness in the c<strong>on</strong>versi<strong>on</strong> process from anoptical image to its digital representative. Because <str<strong>on</strong>g>of</str<strong>on</strong>g>this n<strong>on</strong>-uniformity, it is not possible to select pixelscorresp<strong>on</strong>ding to a defect simply by classifying theirintensities, e.g. by a uniform thresholding operati<strong>on</strong>.Figure 1-b: Typical oxide scale defect <strong>on</strong> hot rolledsteel surface (sample B)In the present work, the pixels in the image <str<strong>on</strong>g>of</str<strong>on</strong>g> theinspected surface are treated as realisati<strong>on</strong>s <str<strong>on</strong>g>of</str<strong>on</strong>g> arandom process described by a certain probabilitydistributi<strong>on</strong>. The founding postulate <str<strong>on</strong>g>of</str<strong>on</strong>g> the methoddeveloped here is the fact that the probabilitydistributi<strong>on</strong>s <str<strong>on</strong>g>of</str<strong>on</strong>g> the pixels which represent the regular,flawless surface, and <str<strong>on</strong>g>of</str<strong>on</strong>g> the pixels which reperesentdefects, differ significantly to provide adequatefiltering criteria.Cumulative probability0.750.50.25Observed frequenciesNormal distributi<strong>on</strong>Weibull distributi<strong>on</strong>0.45 0.5 0.55Relative pixel intensityFigure 2: Pixel distributi<strong>on</strong> estimati<strong>on</strong>Before defect discriminati<strong>on</strong> can be performed, it isnecessary to determine the probability distributi<strong>on</strong> <str<strong>on</strong>g>of</str<strong>on</strong>g>the pixel intensities in the images <str<strong>on</strong>g>of</str<strong>on</strong>g> the regularsurface. In this work, two cumulative distributi<strong>on</strong>functi<strong>on</strong>s are tried: <strong>on</strong>e based <strong>on</strong> Gaussian (normal),and another <strong>on</strong>e based <strong>on</strong> Weibull distributi<strong>on</strong>.1 1 I − µ( I)= + erf ( )2 2 2σP N(1)Wk⎛ I ⎞−⎜⎟⎝ λ ⎠P ( I ) = 1−e(2)Relevant functi<strong>on</strong>s are defined by equati<strong>on</strong> (1) for thenormal distributi<strong>on</strong>, and (2) for Weibull distributi<strong>on</strong>.The parameters <str<strong>on</strong>g>of</str<strong>on</strong>g> these distributi<strong>on</strong>s, µ and σ , andk and λ respectively, are estimated from arelatively small number (50 in this case) <str<strong>on</strong>g>of</str<strong>on</strong>g> images <str<strong>on</strong>g>of</str<strong>on</strong>g>the regular, faultless, surface.Fig. 2 presents the observed cumulative frequency <str<strong>on</strong>g>of</str<strong>on</strong>g>the pixel intensities, together with the cumulativeprobability functi<strong>on</strong>s corresp<strong>on</strong>ding to the estimatednormal and Weibull distributi<strong>on</strong>s. It has been notedthat Weibull distributi<strong>on</strong> shows better agreement withthe observed data, especially for low pixel intensities.2.2 Dynamical image thresholdingThe discriminati<strong>on</strong> <str<strong>on</strong>g>of</str<strong>on</strong>g> defects in the image is achievedby selecting pixels and pixel clusters which do notbehave according to the estimated probabilitydistributi<strong>on</strong> <str<strong>on</strong>g>of</str<strong>on</strong>g> the regular, faultless surface. Since theimage pixels are realisati<strong>on</strong>s <str<strong>on</strong>g>of</str<strong>on</strong>g> a random process,pixels with any intensity value are possible, howeverthey may be more or less likely. For thediscriminati<strong>on</strong> <str<strong>on</strong>g>of</str<strong>on</strong>g> defects in the image it is notsufficient <strong>on</strong>ly to detect pixels with extremely lowprobability <str<strong>on</strong>g>of</str<strong>on</strong>g> appearance. Further decisi<strong>on</strong> needs tobe made <strong>on</strong> whether the selected pixels do indeedcorresp<strong>on</strong>d to a true defect. Since typical scale roll-indefects are <str<strong>on</strong>g>of</str<strong>on</strong>g> certain size, the making <str<strong>on</strong>g>of</str<strong>on</strong>g> this decisi<strong>on</strong>is directed by the size <str<strong>on</strong>g>of</str<strong>on</strong>g> clusters <str<strong>on</strong>g>of</str<strong>on</strong>g> selected pixels.From the estimated probability distributi<strong>on</strong> functi<strong>on</strong>s,it is possible to deduce the quantile functi<strong>on</strong>s thatrelate pixel intensities to their corresp<strong>on</strong>dingcumulative probabilities. Selecti<strong>on</strong> <str<strong>on</strong>g>of</str<strong>on</strong>g> pixelsaccording to a certain probability level corresp<strong>on</strong>ds toa n<strong>on</strong>-uniform thresholding, where the thresholdinglevel for each pixel is determined from the estimatedprobability distributi<strong>on</strong>. In this process, a binaryvalued representative B xy(P)<str<strong>on</strong>g>of</str<strong>on</strong>g> the original image,Ixy, has been obtained, (3), where P is the givenprobability level, I is the intensity <str<strong>on</strong>g>of</str<strong>on</strong>g> the pixel atxycoordinates x and y in the original image, andq xy(P) is the corresp<strong>on</strong>ding quantile functi<strong>on</strong>.B⎧0( P)= ⎨⎩1IIxyxy≥ q< qxyxy( P)( P)xy(3)Reliable detecti<strong>on</strong> <str<strong>on</strong>g>of</str<strong>on</strong>g> defects requires resolving twoproblems: finding the correct probability level, andthe eliminati<strong>on</strong> <str<strong>on</strong>g>of</str<strong>on</strong>g> noise pixels.In addressing the first issue, <strong>on</strong>e needs to establish thecorrect probability level for discriminati<strong>on</strong> <str<strong>on</strong>g>of</str<strong>on</strong>g> pixels.159
The probability level at which the pixels are selected(discriminated) as pixels corresp<strong>on</strong>ding to a defect,depends <strong>on</strong> the actual defect, and also <strong>on</strong> thec<strong>on</strong>diti<strong>on</strong>s under which the image is taken. Thus, thislevel ought not to be fixed in advance; it has to beallowed to change according to the imagecircumstances.The sec<strong>on</strong>d problem, noise eliminati<strong>on</strong>, is related tothe fact that a pixel selected according to a fixedprobability threshold may also be a pixel that is not adeviati<strong>on</strong> from the probability distributi<strong>on</strong>, but is arealisati<strong>on</strong> from its tail. A low probability fixedthreshold would eliminate the noise but it wouldsimultaneously hinder the detecti<strong>on</strong> <str<strong>on</strong>g>of</str<strong>on</strong>g> actual features<str<strong>on</strong>g>of</str<strong>on</strong>g> a real defect. A high probability fixed thresholdpollutes the defect c<strong>on</strong>tours, due to the increase innoise density.Both issues may be satisfactorily resolved throughdynamical thresholding. In dynamical thresholding,the probability level P changes, and the behaviour <str<strong>on</strong>g>of</str<strong>on</strong>g>the selected pixels i.e. the pixels with value 1 in(P) , is tracked by means <str<strong>on</strong>g>of</str<strong>on</strong>g> this change.B xyThe probability level is varied between two values,which need not be precisely determined, but roughlycorresp<strong>on</strong>d to levels that allow the method todiscriminate pixels. The lower limit <str<strong>on</strong>g>of</str<strong>on</strong>g> the probabilitylevel <str<strong>on</strong>g>of</str<strong>on</strong>g> the moving threshold is that at which it isextremely unlikely that any <str<strong>on</strong>g>of</str<strong>on</strong>g> the pixels is selected asa candidate for defect. The upper limit <str<strong>on</strong>g>of</str<strong>on</strong>g> theprobability range is the level at which the number <str<strong>on</strong>g>of</str<strong>on</strong>g>selected pixels becomes approximately equal to theexpected number <str<strong>on</strong>g>of</str<strong>on</strong>g> the selected pixels, i.e. when theobserved frequency <str<strong>on</strong>g>of</str<strong>on</strong>g> the event becomes comparableto the probability <str<strong>on</strong>g>of</str<strong>on</strong>g> that event. In the problem treatedin this work, it has been observed that these twoprobability levels differ by several orders <str<strong>on</strong>g>of</str<strong>on</strong>g>magnitude.indicating a possible presence <str<strong>on</strong>g>of</str<strong>on</strong>g> a defect. As theprobability grows with further increments, new pixelsjoin the nucleus, and the cluster area increases.However, some pixels do not form clusters, and theyremain isolated as the probability level increases.Such pixels are c<strong>on</strong>sidered to be the noise.Eventually, as the probability level increases further,the number <str<strong>on</strong>g>of</str<strong>on</strong>g> noise pixels begins to increase rapidly,however, the growth <str<strong>on</strong>g>of</str<strong>on</strong>g> the pixel clusters indicatingthe presence <str<strong>on</strong>g>of</str<strong>on</strong>g> a defect ceases. In order to observethis behaviour, it is necessary to perform the variati<strong>on</strong><str<strong>on</strong>g>of</str<strong>on</strong>g> the probability level in several increments overseveral orders <str<strong>on</strong>g>of</str<strong>on</strong>g> magnitude. In practice, 12 to 15increments over 3 to 6 orders <str<strong>on</strong>g>of</str<strong>on</strong>g> magnitude are ampleto draw a c<strong>on</strong>clusi<strong>on</strong> <strong>on</strong> the behaviour <str<strong>on</strong>g>of</str<strong>on</strong>g> the selectedpixels. In a number <str<strong>on</strong>g>of</str<strong>on</strong>g> cases, using as few as 5 to 8increments has been sufficient for a successfuldiscriminati<strong>on</strong> <str<strong>on</strong>g>of</str<strong>on</strong>g> defects.Figure 3-a: B xy(P)(Gaussian distributi<strong>on</strong>),P = q( µ − 4σ) = 0.000032.3 Defect discriminati<strong>on</strong>As the probability level P changes from the lower tothe upper limit, the number <str<strong>on</strong>g>of</str<strong>on</strong>g> selected pixels inB xy(P) increases, where some <str<strong>on</strong>g>of</str<strong>on</strong>g> the pixels formclusters, and some appear and remain isolated. Sincethe isolated pixels represent a very small area <strong>on</strong> theinspected surface, in order to declare the presence <str<strong>on</strong>g>of</str<strong>on</strong>g> adefect, it is necessary to detect the presence <str<strong>on</strong>g>of</str<strong>on</strong>g> acluster <str<strong>on</strong>g>of</str<strong>on</strong>g> selected pixels.When the threshold is at the lower end <str<strong>on</strong>g>of</str<strong>on</strong>g> its range <str<strong>on</strong>g>of</str<strong>on</strong>g>values, <strong>on</strong>ly the pixels with extremely unlikely valuesare selected. In practice, this usually amounts to <strong>on</strong>ly<strong>on</strong>e or two isolated pixels. At this stage, they are allaccepted as the candidates. As the probability levelpasses <strong>on</strong>to the next higher increment, more pixels areselected. Some <str<strong>on</strong>g>of</str<strong>on</strong>g> these newly selected pixels areadjacent to, or in the immediate vicinity <str<strong>on</strong>g>of</str<strong>on</strong>g>, thepreviously selected pixels. Such pixels form a cluster,Figure 3-b: B xy(P)(Gaussian distributi<strong>on</strong>),P = q( µ − 4σ) = 0.00003Based <strong>on</strong> these observati<strong>on</strong>s, a pixel trackingprocedure for distinguishing defects from noise pixelshas been devised. The procedure is based <strong>on</strong> simpleheuristic rules:160
- Begin at such a low probability level that nopixels are selected.- Increase the probability level and mark thepixels as they appear.- Retain the pixels that form a cluster the size<str<strong>on</strong>g>of</str<strong>on</strong>g> which increases as the probability levelincreases.- Suppress isolated pixels that are distant fromany cluster, and that remain isolated after theprobability level has increased by more than<strong>on</strong>e order <str<strong>on</strong>g>of</str<strong>on</strong>g> magnitude.- Suppress isolated pixels that are near acluster, i.e. whose distance from a cluster isless than the size <str<strong>on</strong>g>of</str<strong>on</strong>g> that cluster, but that d<strong>on</strong>ot join it when the probability changes formore than 2 orders <str<strong>on</strong>g>of</str<strong>on</strong>g> magnitude.This procedure has enabled a robust and reliablediscriminati<strong>on</strong> <str<strong>on</strong>g>of</str<strong>on</strong>g> defects in all tested cases.3 Experimental resultsThe procedure for defect discriminati<strong>on</strong> described inthe previous secti<strong>on</strong> has been tested <strong>on</strong> a set <str<strong>on</strong>g>of</str<strong>on</strong>g> images<str<strong>on</strong>g>of</str<strong>on</strong>g> hot rolled steel, collected at New Zealand <strong>Steel</strong>producti<strong>on</strong> site at Glenbrook. The parameters <str<strong>on</strong>g>of</str<strong>on</strong>g> pixeldistributi<strong>on</strong>s have been estimated from a subset <str<strong>on</strong>g>of</str<strong>on</strong>g>images without defects, both for Gaussian and forWeibull distributi<strong>on</strong>s.In this secti<strong>on</strong>, the defect detecti<strong>on</strong> procedure hasbeen applied to two typical images, each showing alocal regi<strong>on</strong> with rolled-in oxide scale (Figs. 1-a and1-b). The detecti<strong>on</strong> procedure has been applied usingboth Gaussian and Weibull distributi<strong>on</strong>s. The process<str<strong>on</strong>g>of</str<strong>on</strong>g> surface defect discriminati<strong>on</strong> is presented herevisually, by means <str<strong>on</strong>g>of</str<strong>on</strong>g> B xy(P)images. These are bilevel(black and white) images in which the selectedpixels are shown in black.Figure 4-b: B xy(P)(Gaussian distributi<strong>on</strong>),P = q( µ − 2.5σ) = 0.006Figure 5-a: B xy(P)(Gaussian distributi<strong>on</strong>),P = q( µ −1.5σ) = 0.07Figure 5-b: B xy(P)(Gaussian distributi<strong>on</strong>),P = q( µ −1.5σ) = 0.07Figure 4-a: B xy(P)(Gaussian distributi<strong>on</strong>),P = q( µ − 2.5σ) = 0.006In the case <str<strong>on</strong>g>of</str<strong>on</strong>g> Gaussian distributi<strong>on</strong>, the thresholdlevels have been set directly from the distributi<strong>on</strong>parameters µ and σ , and the corresp<strong>on</strong>dingprobability level has been computed using equati<strong>on</strong>(1). This has been necessary, as, for very small161
probabilities, the numerical computati<strong>on</strong> <str<strong>on</strong>g>of</str<strong>on</strong>g> thequantile functi<strong>on</strong> becomes unreliable.very low. As the probability level increases (Figs. 4-aand 4-b), clusters that show a tendency to increase inarea are formed. Eventually (Figs. 5-a and 5-b), thepixel clusters indicating the defects stop growing, butthe number <str<strong>on</strong>g>of</str<strong>on</strong>g> noise pixels begins to rise rapidly.Figure 6-a: B xy(P)(Weibull distributi<strong>on</strong>),P = 0.00001Figure 7-b: B xy(P)(Weibull distributi<strong>on</strong>),P = 0.01Figure 6-b: B xy(P)(Weibull distributi<strong>on</strong>),P = 0.00001Figure 8-a: B xy(P)(Weibull distributi<strong>on</strong>),P = 0.1Figure 7-a: B xy(P)(Weibull distributi<strong>on</strong>),P = 0.01Figs. 3-a and 3-b, related to samples A and Brespectively, show selected pixels that are candidatesfor defect indicators; however the probability level isFigure 8-b: B xy(P)(Weibull distributi<strong>on</strong>),P = 0.1162
In the case <str<strong>on</strong>g>of</str<strong>on</strong>g> Weibull distributi<strong>on</strong>, the quantilefuncti<strong>on</strong> may be computed with adequate accuracy,and this functi<strong>on</strong> has been used to determine thethreshold levels from the desired probability levels.The behaviour <str<strong>on</strong>g>of</str<strong>on</strong>g> the selected pixels as the thresholdincreases is similar to the behaviour described in theprevious paragraph (Figs. 6-a and 6-b, Figs. 7-a and7-b, and Figs. 8-a and 8-b).When compared to Gaussian distributi<strong>on</strong>,thresholding levels determined by Weibulldistributi<strong>on</strong> tend to produce less noise pixels. Thisobservati<strong>on</strong> is <str<strong>on</strong>g>of</str<strong>on</strong>g> particular importance for the range<str<strong>on</strong>g>of</str<strong>on</strong>g> probability levels in which the clustercorresp<strong>on</strong>ding to the defect shows growth, as thisenables reliable eliminati<strong>on</strong> <str<strong>on</strong>g>of</str<strong>on</strong>g> noise pixels. Thisadvantage <str<strong>on</strong>g>of</str<strong>on</strong>g> Weibull distributi<strong>on</strong> has been expected,since the Weibull distributi<strong>on</strong> shows a betterc<strong>on</strong>cordance with the observed distributi<strong>on</strong> <str<strong>on</strong>g>of</str<strong>on</strong>g> pixelintensities. In additi<strong>on</strong>, when estimated Weibulldistributi<strong>on</strong> is being used, the defect discriminati<strong>on</strong>decisi<strong>on</strong> may be reached in fewer increments.4 C<strong>on</strong>clusi<strong>on</strong>In this work, the problem <str<strong>on</strong>g>of</str<strong>on</strong>g> detecti<strong>on</strong> <str<strong>on</strong>g>of</str<strong>on</strong>g> scale roll-indefects in hot rolled steel has been solved using astatistical approach. The probability distributi<strong>on</strong> <str<strong>on</strong>g>of</str<strong>on</strong>g>pixels <str<strong>on</strong>g>of</str<strong>on</strong>g> regular, faultless surface has been estimated.Two standard probability distributi<strong>on</strong> functi<strong>on</strong>s,Gaussian and Weibull, have been tried, and Weibulldistributi<strong>on</strong> has shown some superiority in this case.The estimated distributi<strong>on</strong>s are used in a process <str<strong>on</strong>g>of</str<strong>on</strong>g>dynamical n<strong>on</strong>-uniform thresholding, through whichcandidate pixels are selected. The candidate pixelsare further classified into defects and noise, by means<str<strong>on</strong>g>of</str<strong>on</strong>g> tracking <str<strong>on</strong>g>of</str<strong>on</strong>g> the candidate pixels as the thresholdinglevel varies.The method described here has been applied <strong>on</strong> a set<str<strong>on</strong>g>of</str<strong>on</strong>g> test images collected in an industrial steel mill forhot rolling. The results obtained in this test showclear potential <str<strong>on</strong>g>of</str<strong>on</strong>g> this method for robust and reliabledetecti<strong>on</strong> <str<strong>on</strong>g>of</str<strong>on</strong>g> scale roll-in defects.Two significant improvements <str<strong>on</strong>g>of</str<strong>on</strong>g> the methodpresented here are under c<strong>on</strong>siderati<strong>on</strong>. Oneimprovement would involve morphological andstatistical analysis <str<strong>on</strong>g>of</str<strong>on</strong>g> pixel clusters. The otherimprovement would involve estimating multivariatepixel statistics, which would result in a more definitecriteri<strong>on</strong> for noise filtering. This method will also beextended to allow detecti<strong>on</strong> <str<strong>on</strong>g>of</str<strong>on</strong>g> other types <str<strong>on</strong>g>of</str<strong>on</strong>g> hotrolling defects.References[1] T. Sugimoto, T, Kawaguchi "Development<str<strong>on</strong>g>of</str<strong>on</strong>g> a <str<strong>on</strong>g>Surface</str<strong>on</strong>g> Defect Inspecti<strong>on</strong> System UsingRadiant Light from <strong>Steel</strong> Products in a <strong>Hot</strong>Rolling Line", IEEE Trans Inst. Meas.vol. 47no. 2, April 1998, pp 409-416[2] C. Fernandez, S. Fernandez, P. Campoy, R.Aracil "On-line texture analysis for flatproducts inspecti<strong>on</strong>. Neural netsimplementati<strong>on</strong>", Proceedings <str<strong>on</strong>g>of</str<strong>on</strong>g> IECON'94., Sept. 1994, vol.2, pp 867 - 872[3] R.J. M<strong>on</strong>tague, J. Watt<strong>on</strong>, K.J. Brown "Amachine visi<strong>on</strong> measurement <str<strong>on</strong>g>of</str<strong>on</strong>g> slab camberin hot strip rolling", Journal <str<strong>on</strong>g>of</str<strong>on</strong>g> MaterialsProcessing Technology 168 (2005) 172–180[4] H. Jia, Y. L. Murphey, J. Shi, T.-S. Chang"An Intelligent Real-time Visi<strong>on</strong> System for<str<strong>on</strong>g>Surface</str<strong>on</strong>g> Defect Detecti<strong>on</strong>", Proceedings <str<strong>on</strong>g>of</str<strong>on</strong>g>ICPR’04, IEEE Computer Society, 2004[5] C. Fernandez; C. Platero; P. Campoy; R.Aracil "Visi<strong>on</strong> system for <strong>on</strong>-line surfaceinspecti<strong>on</strong> in aluminum casting process"Proceedings <str<strong>on</strong>g>of</str<strong>on</strong>g> IECON '93, Nov. 1993,vol.3, pp 1854-1859[6] J. J. Haapamaki, S. M. Tamminen, J. J.R<strong>on</strong>ing "Data mining methods in hot steelrolling for scale defect predicti<strong>on</strong>"Proceedings <str<strong>on</strong>g>of</str<strong>on</strong>g> AIA 2005, Feb. 2005, pp 453-4645 AcknowledgementsThe authors are grateful to Mr. H. Nieborak, Mr. R.Kimber, Mr. N. Joveljic, and Mr. P. Bagshaw <str<strong>on</strong>g>of</str<strong>on</strong>g> theNew Zealand <strong>Steel</strong>, for their kind provisi<strong>on</strong> <str<strong>on</strong>g>of</str<strong>on</strong>g> thesample images, and for their enthusiasm,encouragement and interest in this work.163