Long-wavelength adaptation reveals slow ... - Journal of Vision
Long-wavelength adaptation reveals slow ... - Journal of Vision
Long-wavelength adaptation reveals slow ... - Journal of Vision

Create successful ePaper yourself
Turn your PDF publications into a flip-book with our unique Google optimized e-Paper software.
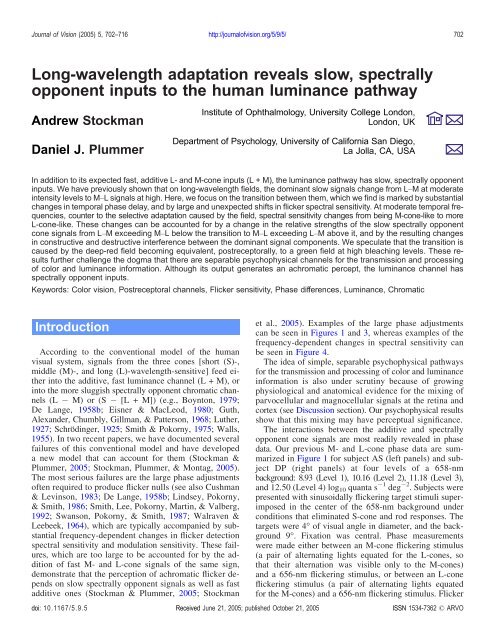
<strong>Journal</strong> <strong>of</strong> <strong>Vision</strong> (2005) 5, 702–716 http://journal<strong>of</strong>vision.org/5/9/5/ 702<strong>Long</strong>-<strong>wavelength</strong> <strong>adaptation</strong> <strong>reveals</strong> <strong>slow</strong>, spectrallyopponent inputs to the human luminance pathwayAndrew StockmanDaniel J. PlummerInstitute <strong>of</strong> Ophthalmology, University College London,London, UKDepartment <strong>of</strong> Psychology, University <strong>of</strong> California San Diego,La Jolla, CA, USAIn addition to its expected fast, additive L- and M-cone inputs (L + M), the luminance pathway has <strong>slow</strong>, spectrally opponentinputs. We have previously shown that on long-<strong>wavelength</strong> fields, the dominant <strong>slow</strong> signals change from LYM at moderateintensity levels to MYL signals at high. Here, we focus on the transition between them, which we find is marked by substantialchanges in temporal phase delay, and by large and unexpected shifts in flicker spectral sensitivity. At moderate temporal frequencies,counter to the selective <strong>adaptation</strong> caused by the field, spectral sensitivity changes from being M-cone-like to moreL-cone-like. These changes can be accounted for by a change in the relative strengths <strong>of</strong> the <strong>slow</strong> spectrally opponentcone signals from LYM exceeding MYL belowthetransitiontoMYL exceeding LYM above it, and by the resulting changesin constructive and destructive interference between the dominant signal components. We speculate that the transition iscaused by the deep-red field becoming equivalent, postreceptorally, to a green field at high bleaching levels. These resultsfurther challenge the dogma that there are separable psychophysical channels for the transmission and processing<strong>of</strong> color and luminance information. Although its output generates an achromatic percept, the luminance channel hasspectrally opponent inputs.Keywords: Color vision, Postreceptoral channels, Flicker sensitivity, Phase differences, Luminance, ChromaticIntroductionAccording to the conventional model <strong>of</strong> the humanvisual system, signals from the three cones [short (S)-,middle (M)-, and long (L)-<strong>wavelength</strong>-sensitive] feed eitherinto the additive, fast luminance channel (L + M), orinto the more sluggish spectrally opponent chromatic channels(L M) or (S [L + M]) (e.g., Boynton, 1979;De Lange, 1958b; Eisner & MacLeod, 1980; Guth,Alexander, Chumbly, Gillman, & Patterson, 1968; Luther,1927; SchrPdinger, 1925; Smith&Pokorny,1975; Walls,1955). In two recent papers, we have documented severalfailures <strong>of</strong> this conventional model and have developeda new model that can account for them (Stockman &Plummer, 2005; Stockman, Plummer, & Montag, 2005).The most serious failures are the large phase adjustments<strong>of</strong>ten required to produce flicker nulls (see also Cushman& Levinson, 1983; De Lange, 1958b; Lindsey, Pokorny,& Smith, 1986; Smith, Lee, Pokorny, Martin, & Valberg,1992; Swanson, Pokorny, & Smith, 1987; Walraven&Leebeek, 1964), which are typically accompanied by substantialfrequency-dependent changes in flicker detectionspectral sensitivity and modulation sensitivity. These failures,which are too large to be accounted for by the addition<strong>of</strong> fast M- and L-cone signals <strong>of</strong> the same sign,demonstrate that the perception <strong>of</strong> achromatic flicker dependson <strong>slow</strong> spectrally opponent signals as well as fastadditive ones (Stockman & Plummer, 2005; Stockmanet al., 2005). Examples <strong>of</strong> the large phase adjustmentscan be seen in Figures 1 and 3, whereas examples <strong>of</strong> thefrequency-dependent changes in spectral sensitivity canbe seen in Figure 4.The idea <strong>of</strong> simple, separable psychophysical pathwaysfor the transmission and processing <strong>of</strong> color and luminanceinformation is also under scrutiny because <strong>of</strong> growingphysiological and anatomical evidence for the mixing <strong>of</strong>parvocellular and magnocellular signals at the retina andcortex (see Discussion section). Our psychophysical resultsshow that this mixing may have perceptual significance.The interactions between the additive and spectrallyopponent cone signals are most readily revealed in phasedata. Our previous M- and L-cone phase data are summarizedin Figure 1 for subject AS (left panels) and subjectDP (right panels) at four levels <strong>of</strong> a 658-nmbackground: 8.93 (Level 1), 10.16 (Level 2), 11.18 (Level 3),and 12.50 (Level 4) log 10 quanta s 1 deg 2 . Subjects werepresented with sinusoidally flickering target stimuli superimposedin the center <strong>of</strong> the 658-nm background underconditions that eliminated S-cone and rod responses. Thetargets were 4- <strong>of</strong> visual angle in diameter, and the background9-. Fixation was central. Phase measurementswere made either between an M-cone flickering stimulus(a pair <strong>of</strong> alternating lights equated for the L-cones, sothat their alternation was visible only to the M-cones)and a 656-nm flickering stimulus, or between an L-coneflickering stimulus (a pair <strong>of</strong> alternating lights equatedfor the M-cones) and a 656-nm flickering stimulus. Flickerdoi: 10.1167/5.9.5 Received June 21, 2005; published October 21, 2005 ISSN 1534-7362 * ARVO
<strong>Journal</strong> <strong>of</strong> <strong>Vision</strong> (2005) 5, 702–716 Stockman & Plummer 703Figure 1. Phase advances <strong>of</strong> M-cone (green dotted circles) or L-cone (red dotted squares) stimuli required to null a 656-nm targetmeasured on 658-nm backgrounds <strong>of</strong> 8.93 (Level 1), 10.16 (Level 2), 11.18 (Level 3), or 12.50 (Level 4) log 10 quanta s 1 deg 2 . TheM-cone stimuli were alternating pairs <strong>of</strong> L-cone-equated 540 and 650 nm targets; and the L-cone stimuli were pairs <strong>of</strong> M-cone-equated650 and 550 nm targets. The continuous lines are fits <strong>of</strong> a model in which the cone signals are assumed to be the resultant <strong>of</strong> a fastsignal and a delayed <strong>slow</strong> signal <strong>of</strong> the same or opposite sign. Left panels: AS. Right panels: DP. For further details, see Stockman et al.(2005) and Stockman & Plummer (2005). At Levels 1, 2, and 3, the dominant cone signals underlying the phase data are assumed to be+fM+fL and sM+sL (lower right circuit), whereas at Level 4 they are assumed to be +fM+fL and +sM sL (upper right circuit).frequencies <strong>of</strong> between 2.5 and 25 Hz were used. Initially,the flickering stimuli were alternated, and the subjectswere asked to adjust their relative phase (and amplitude)to null or cancel the perception <strong>of</strong> flicker. The data inFigure 1 show the phase adjustments away from oppositephase that are required to null either M-cone flicker (greendotted circles) or L-cone flicker (red dotted squares) withthe 656-nm flicker (i.e., flicker Bequichromatic[ with thebackground, and which is thus unlikely to generate asubstantial spectrally opponent or chromatic flickersignal; see also below). Zero degree on these plots meansthat the two lights cancelled when they were physically inopposite phase (i.e., when they were alternated), whereasT180- means that they cancelled when they were in the samephase. Thus, the plotted phase delays indicate those delaysintroduced within the visual system. As can be seen, some<strong>of</strong> the phase adjustments are substantial even at moderatelyhigh temporal frequencies. They are inconsistentwith the conventional model <strong>of</strong> luminance, which, apartfrom phase differences that arise because <strong>of</strong> the selective<strong>adaptation</strong> <strong>of</strong> the L-cones by the long-<strong>wavelength</strong> field,predicts that no phase adjustments should be required.The data shown in Figure 1 illustrate another intriguingeffect. In our previous papers, we emphasized that some <strong>of</strong>the phase adjustments are large, particularly for the nullsinvolving M-cone flicker. What we did not emphasize isthe abrupt change in the signs <strong>of</strong> the M- and L-cone phasedelays that occurs between two critical level (Levels 3 and4). That change is the focus <strong>of</strong> the measurements andanalysis presented in this paper.Working modelFor the interpretation <strong>of</strong> our data, we assume that thechannel that underlies the perception <strong>of</strong> achromatic flicker
<strong>Journal</strong> <strong>of</strong> <strong>Vision</strong> (2005) 5, 702–716 Stockman & Plummer 704Phase delay <strong>of</strong> resultant (deg)180900-90Slow and fastsignals <strong>of</strong> thesame signSlow-1800 5 10 15 20 25 30∆tFastm∞421.3310.750.50.2500.250.50.7511.3324∞180900-90Slow∆tFastSlow and fastsignals <strong>of</strong> theopposite sign-1800 5 10 15 20 25 30m∞421.3310.750.50.2500.250.50.7511.3324∞Relative amplitude <strong>of</strong> resultant1.000.750.500.250.000 5 10 15 20 25 30m∞ or 04 or 0.252 or 0.51.33 or 0.7511.21.00.80.60.40.20.00 5 10 15 20 25 30m∞ or 04 or 0.252 or 0.51.33 or 0.751Frequency (Hz)Figure 2. Model predictions <strong>of</strong> the phase delay (upper panels) and relative amplitude (lower panels) <strong>of</strong> the resultant <strong>of</strong> the combination <strong>of</strong><strong>slow</strong> and fast signals <strong>of</strong> the same sign (left panels) and <strong>of</strong> opposite sign (right panels). Predictions are shown for <strong>slow</strong> to fast signal ratios,m, ranging from 0 to V, and for a time delay, Dt, between the <strong>slow</strong> and fast signals <strong>of</strong> 33.33 ms.generates a univariant flicker signal, although its severalinput signals can be substantially delayed relative to eachother and can be <strong>of</strong> either positive or negative sign. Thus,two flickering lights <strong>of</strong> any <strong>wavelength</strong> composition detectedsolely by that channel can be flicker-photometricallycancelled or nulled by adjusting their relative amplitudeand phase. Under the conditions <strong>of</strong> our experiments, wefind that nulls are generally possible near-flicker-thresholdat all frequencies above c. 5 Hz. Flicker nulls can also beset at 2.5 Hz under most conditions. In our previouswork, we found evidence for multiple cone inputs to theachromatic flicker channel, which we refer to as BM[ orBL[, according to the cone type from which the inputsignals originate, prefixed by Bf[ or Bs[ for fast or <strong>slow</strong>,and by B+[ or B [ according to their polarity withrespect to the fast signals. For a given condition, theresultant signal from a particular cone type is assumedto be the vector sum <strong>of</strong> its <strong>slow</strong> and fast signal components,which have some fixed ratio <strong>of</strong> signal amplitudes(m) and are separated by a delay <strong>of</strong> Dt (ms). Importantly,the <strong>slow</strong> cone signal can be <strong>of</strong> the same or opposite signas the fast cone signal. Some examples <strong>of</strong> the model predictionsare shown in Figure 2 for <strong>slow</strong> and fast signals<strong>of</strong> the same polarity (left panels) or <strong>of</strong> the opposite polarity(right panels). The horizontal and diagonal lines inthe upper panels, respectively, represent the phase delays<strong>of</strong> the fast signal alone (m ¼ 0) and the <strong>slow</strong> signal alone(m ¼ V) signals. The relative delay <strong>of</strong> the <strong>slow</strong> signal(Dt) in these examples is 33.3 ms, as a result <strong>of</strong> which<strong>slow</strong> and fast signals <strong>of</strong> the same polarity become oppositein phase at 15 Hz and destructively interfere (leftpanel), whereas <strong>slow</strong> and fast <strong>of</strong> the opposite polarity becomethe same in phase at 15 Hz and constructively interfere(right panel). Predictions are shown in Figure 2for several values <strong>of</strong> m.The upper panels show the predicted phase delay <strong>of</strong>the combined <strong>slow</strong> and fast signals, and the lower panelsshow their amplitudes. The phase delays are related to thephase adjustments required to null flickering lights(Figures 1 and 3), whereas the amplitudes are related tothe flicker detection sensitivities (Figures 4 and 5). Theamplitude predictions illustrate the effects <strong>of</strong> destructiveand constructive interference and its dependence on flickerfrequency. The phase predictions are characteristic
<strong>Journal</strong> <strong>of</strong> <strong>Vision</strong> (2005) 5, 702–716 Stockman & Plummer 705MLSubject Level Slow/fast (m) Dt Slow sign Slow/fast (m) Dt Slow signAS 1 1.79 39.82 Minus 0.03 25.22 Plus2 2.44 31.48 Minus 0.32 31.63 Plus3 2.87 22.72 Minus 0.49 21.60 Plus4 1.31 29.50 Plus 0.40 25.08 MinusDP 1 1.67 32.70 Minus 0.04 29.94 Plus2 3.15 30.74 Minus 0.33 28.81 Plus3 4.51 21.71 Minus 0.41 20.57 Plus4 27.96 33.56 Plus 0.63 27.79 MinusTable 1. Parameters <strong>of</strong> time delay model fitted to M- and L-cone phase data shown in Figure 1. The parameters are the ratio <strong>of</strong> <strong>slow</strong>/fastsignal size, the time delay (Dt) in ms between the <strong>slow</strong> and fast signals, and the sign <strong>of</strong> the <strong>slow</strong> signal with respect to that <strong>of</strong> the fast. Fordetails see text.Bsignatures[ that should be found in any experimentaldata that reflect the simple combination <strong>of</strong> <strong>slow</strong> and fastsignals. A comparison between the phase signatures andthe phase data <strong>of</strong> Figure 1 shows that the two are indeedsimilar, which suggests the phase data are broadly consistentwith our model. The continuous lines in Figure 1are fits <strong>of</strong> this model to the M- and L-cone phase data. AtLevels 1Y3 (8.93Y11.18 log 10 quanta s 1 deg 2 ), the dominant<strong>slow</strong> and fast signals are +sL, sM, +fL, and +fM, asillustrated in the lower right circuit diagram <strong>of</strong> Figure 1,whereas at Level 4 (12.50 log 10 quanta s 1 deg 2 ) theyare sL, +sM, +fL, and +fM, as illustrated in the upperright circuit diagram. Table 1 summarizes the best-fittingmodel parameters for the fits to the M- and L-cone datashown in Figure 1. The <strong>slow</strong>/fast signal ratios (m) aretypically small for L-cone signals and large for M-conesignals, whereas Dt varies between 20 and 40 ms. (Thevalues for Level 1 are anomalous, because the equichromatictarget is below M-cone threshold and is thereforean L-cone stimulus.)The crucial change in the model parameters thatoccurs between Levels 3 and 4 (11.18 and 12.50 logquanta s 1 deg 2 ) is that the polarities <strong>of</strong> the both the<strong>slow</strong> M-cone and the <strong>slow</strong> L-cone signals reverse. Thus,the <strong>slow</strong>, spectrally opponent signals change from+sL sM to sL+sM. In this paper, we focus on thechanges in phase delay and flicker spectral sensitivity thatoccur between Levels 3 and 4.MethodsApparatusThe optical apparatus was a conventional five-channel,Maxwellian-view optical system with a 2-mm entrancepupil illuminated by a 900-W Xenon arc. Wavelengthswere selected by the use <strong>of</strong> interference filters with fullwidthat half-maximum bandwidths <strong>of</strong> between 7 and11 nm (Ealing or Oriel). The radiance <strong>of</strong> each beam couldbe varied by the insertion <strong>of</strong> fixed neutral density filters(Oriel) or under computer control by the rotation <strong>of</strong>circular, variable neutral density filters (Rolyn Optics).Sinusoidal modulation was produced by the pulse-widthmodulation <strong>of</strong> fast, liquid crystal light shutters (Displaytech)at a carrier frequency <strong>of</strong> 400 Hz. The position <strong>of</strong> theobserver’s head was maintained by a dental wax impression.The apparatus is described in more detail elsewhere(Stockman et al., 2005).StimuliIn all experiments, target stimuli <strong>of</strong> 4- <strong>of</strong> visual anglein diameter were superimposed in the center <strong>of</strong> a steady658-nm background field <strong>of</strong> 9- in diameter. Fixation wascentral. Calibrations were carried out with the use <strong>of</strong> aUDT Radiometer and a spectroradiometer (E,G & G). Forfurther details, see Stockman et al. (2005).BackgroundsThe 658-nm background was varied in radiance from10.39 to 12.38 log 10 quanta s 1 deg 2 . Given the relativeinsensitivity <strong>of</strong> rods and S-cones to the long-<strong>wavelength</strong>fields, it was important to ensure that the rods and S-conesdid not detect the 520-nm target. To desensitize therods and S-cones, an auxiliary 410-nm background <strong>of</strong>10.30 log 10 quanta s 1 deg 2 was superimposed on the658-nm background. Given that the S-cones are one logunit more sensitive to the auxiliary background <strong>wavelength</strong><strong>of</strong> 410 nm than they are to the shortest target<strong>wavelength</strong> <strong>of</strong> 520 nm (Stockman & Sharpe, 2000), theS-cone modulations produced by the 520-nm targets (seeFigure 5 for the radiances used) were well below S-conemodulation threshold (see Stockman, MacLeod, & DePriest,1991). As expected, therefore, in control experiments wecould find no evidence that the S-cones contributed toour measurements.
<strong>Journal</strong> <strong>of</strong> <strong>Vision</strong> (2005) 5, 702–716 Stockman & Plummer 706We used single or combined 520 and 650 nm monochromatictargets. Flicker frequencies <strong>of</strong> 2.5, 7.5, 15, and22.5 Hz were used. Monochromatic targets were usedrather than cone-isolating targets, because <strong>of</strong> the large andabrupt changes in phase delay and spectral sensitivity thatoccur between Levels 3 and 4. M- and L-cone-isolatingtargets require the use <strong>of</strong> paired, alternating stimuli thatare equated for (and therefore invisible to) the unwantedcone type. We were concerned that paired targets that wereslightly imperfectly equated could generate small signalsfrom the unwanted cone type. Although usually well belowthreshold, such signals could become visually significantif the resultant signals from the wanted cone type arecancelled by destructive interference, which is likelyunder some <strong>of</strong> the conditions <strong>of</strong> our experiment. Usingmonochromatic lights avoids this problem but means thatthe phase lags are harder to interpret because mostspectral targets typically produce both M- and L-conesignals even on the 658-nm background (see below).The 520-nm targetAlthough the flickering 520-nm target generates predominantlyan M-cone signal on the long-<strong>wavelength</strong> background,it also generates a small L-cone signal (a shorter <strong>wavelength</strong>target would have reduced the L-cone contributionbut would have had the unwanted effect <strong>of</strong> increasing thelikelihood <strong>of</strong> an S-cone contribution). This small L-conesignal is evidenced by the <strong>slow</strong>/fast signal ratios (m)values for 500 and 540 nm flickering targets being lessthan the m values for pure M-cone targets (Stockman &Plummer, 2005; Stockman et al., 2005). The <strong>slow</strong> component<strong>of</strong> the L-cone signal produced by the 520-nm targetis much smaller than the fast L-cone component (seeTable 1) and is cancelled by the stronger opposite polarity<strong>slow</strong> M-cone signals. Consequently, the L-conesignal produced by the 520-nm target can be thought<strong>of</strong> as mainly a fast +fL signal, which adds to the fastM-cone signal (+fM).For the interpretation <strong>of</strong> our data, therefore, we assumethat the 520-nm flickering light generates sM, +fM, and+fL flicker signals at lower 658 nm intensity levels and+sM, +fM, and +fL flicker signals at higher levels.The 650-nm targetOn the long-<strong>wavelength</strong> 658-nm background, theflickering 650-nm target generates both M- and L-coneflicker signals (once, that is, the target is intense enoughto exceed M-cone flicker threshold, which is not the caseat Level 1). Because the 650-nm target is approximatelyequichromatic with the 658-nm background, it producesmainly luminance modulation with comparatively littlechromatic modulation. We assume, therefore, that it generatespredominantly fast signals (+fL and +fM). Thisassumption implies that the two opposing <strong>slow</strong> signals areroughly balanced under these conditions (i.e., sM +sLand +sM sL) and cancel; an assumption for whichthere is good evidence under a variety <strong>of</strong> conditions forconventional chromatic channels (Chaparro, Stromeyer,Chen, & Kronauer, 1995; Eskew, McLellan, & Giulianini,1999; Stromeyer, Cole, & Kronauer, 1985). If, contrary tothis assumption, the spectrally opponent signals are slightlyunbalanced, and the equichromatic flickering target doesgenerate a small <strong>slow</strong> signal, then the relative strengths<strong>of</strong> the <strong>slow</strong> signal will be underestimated for the 650-nmtarget and overestimated for the 520-nm target. For theinterpretation <strong>of</strong> our data, we assume that the 650-nmflickering light generates +fM and +fL flicker signals.The flickering targets were continuously presented, sothat in the central 4- observers were adapted to the meanradiance <strong>of</strong> the flickering targets plus the steady background.The amplitude threshold radiances <strong>of</strong> the flickeringtargets are plotted in Figure 5 (their mean radiancesare 0.3 log unit less than the plotted values). Under mostconditions, the target radiances are small relative to thebackground radiance, so that the targets shift the effectiveadapting <strong>wavelength</strong> from the field <strong>wavelength</strong> <strong>of</strong> 658 nmto <strong>wavelength</strong>s only 4-nm shorter or usually less. Theonly conditions under which the 520-nm target is brightenough to cause sizeable <strong>wavelength</strong> shifts are at 15 and22.5 Hz for DP at the very highest background radiances,where the loss <strong>of</strong> sensitivity to 520-nm flicker significantlyexceeds Weber’s Law (see Figure 5). The worst case isat 22.5 Hz at the highest background radiance, wherethe effective <strong>wavelength</strong> is shifted by 12nm to 646 nm.This slightly shifts the Weber predictions (see below) butdoes not affect the conclusions. The effective adapting<strong>wavelength</strong> was calculated by finding the <strong>wavelength</strong>that gives rise the same relative L- and M-cone excitationas the combined background and targets according to theStockman and Sharpe (2000) cone fundamentals.ProceduresSubjects light adapted to the target and background fieldsfor at least 3 min prior to any data collection. During theexperiment, each subject interacted with the computer bymeans <strong>of</strong> eight buttons on a keypad. The computer providedinstructions and gave verbal and other auditory feedbackby way <strong>of</strong> a voice synthesizer and tones.Flicker thresholds were found by the method <strong>of</strong> adjustment.The modulation <strong>of</strong> the flickering stimulus was set tothe maximum level <strong>of</strong> 92% and its amplitude was varied t<strong>of</strong>ind the threshold for detecting the flicker. Phase differenceswere measured between the superimposed 520 and650 nm flickering lights using a flicker cancellation technique.First, each subject adjusted the modulation <strong>of</strong> thetwo lights separately (with the other light set at zero modulation)until the flicker was just above threshold (typicallyc. 0.2 log 10 above threshold). Then, the subject adjustedthe phase difference between the two lights and if nec-
<strong>Journal</strong> <strong>of</strong> <strong>Vision</strong> (2005) 5, 702–716 Stockman & Plummer 707essary their relative modulation to find the best flicker null.Subjects could also reverse the relative phase <strong>of</strong> the twostimuli by 180- to help them find the correct nulling phase.Except where noted, all data points are averaged fromthree or four settings made on at least four separate runs.Other details <strong>of</strong> the experimental procedures are given inthe Results section.18090ASSubjects0The two observers in this work were the authors (ASand DP). Both observers were male, had normal colorvision, and were emmetropic. These studies conform tothe standards set by the Declaration <strong>of</strong> Helsinki, and theprocedures have been approved by local ethics committeesin the United Kingdom and United States.ResultsPhase delaysDelay <strong>of</strong> 520 nm stimulus (deg)-90-180180902.5 Hz7.5 Hz15 Hz22.5 HzDPThe phase delays <strong>of</strong> 520-nm flicker required to null the650-nm equichromatic flicker are shown in Figure 3 for AS(top panel) and DP (bottom panel), measured as a function<strong>of</strong> the radiance <strong>of</strong> the 658-nm background. Flicker frequencies<strong>of</strong> 2.5 (circles), 7.5 (squares), 15 (triangles),and 22.5 (inverted triangles) Hz were used. Below 11.21log 10 quanta s 1 deg 2 (highlighted by the pink area) andabove 12.13 log 10 quanta s 1 deg 2 (highlighted by thegreen area), the phase delays are relatively constant. Inbetween, there are substantial phase shifts.The black symbols show the M-cone phase delays measuredat the corresponding frequencies at Levels 3 and4 replotted from Figure 1 (2.5 Hz phase delays could notbe measured at the highest level). The phase differencesbelow 11.21 log 10 quanta s 1 deg 2 are similar to theM-cone phase delays measured at Level 3, whereas thoseabove 12.13 log 10 quanta s 1 deg 2 are similar to theM-cone phase delays measured at Level 4. In most cases,the 520-nm phase delays are slightly less than those forthe M-cones. This difference arises because the 520-nmtarget generates a small L-cone signal, which is also foundfor 500 and 540 nm targets (see Stockman & Plummer,2005; Stockman et al., 2005).The abrupt changes in the phase delay in the unshadedarea are largest at 2.5 Hz but then fall <strong>of</strong>f as the frequencyincreases. They are close to 180- at 2.5 Hz for both ASand DP. For AS, they then fall to c. 130- at 7.5 and 15 Hz,and to 50- at 22.5 Hz. For DP, they remain large at 170- at7.5 Hz and 200- at 15 Hz and then fall to 40- at 22.5 Hz.The differences between AS and DP are consistent withprevious measurements that indicate that the <strong>slow</strong> M-conesignals for DP are stronger (relative to his fast M-cone0-90-18010.5 11.0 11.5 12.0 12.5Log 10 background intensity (quanta s -1 deg -2 )Figure 3. Phase advances <strong>of</strong> a 520-nm target required to nulla 650-nm target measured as a function <strong>of</strong> the radiance <strong>of</strong> the658-nm background. Data are shown for 2.5 (dotted white circles),7.5 (dotted white squares), 15 (dotted white triangles), and22.5 (dotted white inverted triangles) Hz flicker. The pink area(here and in Figures 4 and 5) indicates the lower radiance rangewithin which the phase delays are consistent with the 520-nmflicker generating mainly a sM signal, whereas the green areaindicates the higher radiance range within which the phases areconsistent with it generating mainly a <strong>slow</strong> +sM signal. The filledsymbols are the corresponding M-cone phase delays fromFigure 1 for 2.5 (dotted black circles), 7.5 (dotted black squares),15 (dotted black triangles), and 22.5 (dotted white invertedtriangles) Hz. Top panel: AS. Bottom panel: DP.signals) than they are for AS (Stockman & Plummer, 2005;Stockman et al., 2005).According to our model, the changes in phase delaybetween 520 and 650 nm flicker should reflect the
<strong>Journal</strong> <strong>of</strong> <strong>Vision</strong> (2005) 5, 702–716 Stockman & Plummer 708transition from the 520-nm flicker generating predominantlysM+fM(+fL) signals at low levels to it generatingpredominantly +sM+fM(+fL) signals at highlevels. Our data are broadly consistent with such a reversal<strong>of</strong> the <strong>slow</strong> M-cone signal because the phaseadjustments change by c. 180- at low to moderate frequencies.At 22.5 Hz, however, the change is only 40- or50-. There are two likely reasons for the shortfall at thisfrequency. First, the <strong>slow</strong> +sM sL signals above thetransition are <strong>slow</strong>er than the sM+sL signals below it(compare the phase delay slopes in Figure 1 and the Dtestimates in Table 1 for Levels 3 and 4). As a result, thetwo opposing pairs <strong>of</strong> <strong>slow</strong> signals ( sM+sL versus+sM sL) are only about 90Y120- apart at 22.5 Hz.Second, the <strong>slow</strong> signals lose sensitivity with increasingfrequency more quickly than the fast signals, so that by22.5 Hz the measured phase delays are closer to those <strong>of</strong>the fast signal (i.e., closer to 0-) (Stockman & Plummer,2005; Stockman et al., 2005).Notice that the required phase adjustments fall to closeto 0- at a Bcritical[ radiance, which lies between 11.60and 11.70 log 10 quanta s 1 deg 2 for AS and between11.65 and 11.75 log 10 quanta s 1 deg 2 for DP. Giventhat the +sM sL signals grow relative to the sM+sLsignals as the background radiance increases, there shouldbe a critical background radiance at which the <strong>slow</strong>signals produced by the 520-nm target all cancel, with theresult that the phase delays will then be those <strong>of</strong> the fastsignals and therefore close to 0-Vas we find.the L-cones by 12.9 times more than the sensitivity <strong>of</strong> theM-conesVwith the result that the two adapted cone typesbecome equally sensitive to 658 nm. The Weber limitsshown in the figure are calculated by normalizing theL- and M-cone spectral sensitivities at 658 nm and thenLog 10 quantal sensitivity ratio (520/650)2.0 ASM-cone1.51.00.5WeberL-cone2.5 Hz7.5 Hz15 Hz22.5 Hz2.0 DP1.5M-coneWeberSpectral sensitivityIf, as our previous work suggests, the predominant signalschange from sM, +sL, +fM, and +fL below the transitionto +sM, sL, +fM, and +fL above it, there shouldbe clear evidence for both intensity- and frequency-dependentchanges in spectral sensitivity across the transition. Moreover,the direction <strong>of</strong> spectral sensitivity changes shouldindicate which cone signals destructively or constructivelyinterfere at a particular intensity level.Figure 4 shows the logarithmic quantal sensitivity ratiosfor detecting 520 and 650 nm flicker at 2.5, 7.5, 15,and 22.5 Hz for AS (upper panel) and DP (bottom panel).The M- and L-cone sensitivity ratios are shown by theupper and lower horizontal lines, respectively (Stockman& Sharpe, 2000). Two horizontal dashed lines are shown.They represent the spectral sensitivity predictions, ifboth the M- and the L-cone sensitivities are independentlycontrolled according to Weber’s Law, for an additiveBluminance[ mechanism with L:M cone input weights <strong>of</strong>1:1 (upper dashed line) and 2:1 (lower dashed line). IfWeber’s Law applies, the sensitivity losses for each conemechanism increase in proportion to the effective background<strong>adaptation</strong>. Consequently, if the L-cones are 12.9times more sensitive to the 658-nm field than theM-cones, the 658-nm field will reduce the sensitivity <strong>of</strong>1.00.5L-cone10.5 11.0 11.5 12.0 12.5Log 10 background intensity (quanta sec -1 deg -2 )Figure 4. Logarithmic quantal sensitivity ratios for detecting 520-and 650-nm flicker measured as a function <strong>of</strong> 658-nm backgroundradiance at 2.5 (dotted white circles), 7.5 (dotted whitesquares), 15 (dotted white triangles), and 22.5 (dotted whiteinverted triangles) Hz. The pink and green areas correspond tothe areas similarly highlighted in Figures 3 and 5. The continuoushorizontal lines labeled M- and L-cone are, respectively, the M-and L-cone sensitivity ratios for detecting 520 and 650 nm, andthe dashed lines are the Weber’s Law predictions. The Weber’sLaw predictions are calculated by scaling the linear L- and M-conespectral sensitivities to be equal at the adapting <strong>wavelength</strong> <strong>of</strong>658 nm, and then adding them together in the ratio <strong>of</strong> 1L:1M(upper dashed lines) or 2L:M (lower dashed lines). All spectralsensitivities are based on the Stockman and Sharpe (2000) conefundamentals. Upper panel: AS. Lower panel: DP.
<strong>Journal</strong> <strong>of</strong> <strong>Vision</strong> (2005) 5, 702–716 Stockman & Plummer 709linearly combining them with L:M cone weights <strong>of</strong> 1:1 or2:1. These weights were chosen to indicate the variationfound in the population, which on average favors L butshows considerable individual variability (e.g., Cicerone& Nerger, 1989; De Vries, 1948a; Sharpe, Stockman,Jagla, & Jägle, in press; Stromeyer, Cole, & Kronauer,1987; Vos & Walraven, 1971; Walraven, 1974). SubjectAS is known to have a weight <strong>of</strong> about 1.7 L:M on awhite daylight background (Sharpe et al., in press). If<strong>adaptation</strong> is limited by Weber’s Law, the spectral sensitivityshould not cross the appropriate Weber limit foreach subject.At the lowest 658-nm background intensities, the spectralsensitivity ratios for both subjects for detecting 15and 22.5 Hz flicker are closer to M than those for detecting2.5 and 7.5 Hz flicker. As the 658-nm backgroundradiance is increased, the selective attenuation <strong>of</strong> theL-cones by the deep-red field causes the 520/650-nmratios, as expected, to move towards the Weber limit.Between 11.0 and 11.2 log 10 quanta s 1 deg 2 , however,the Weber’s Law predictions are exceeded and the 520/650-nm ratios approach M. Although surprising, thisBsuper-Weber[ behavior has been reported at frequenciesbetween 15 and 22.5 Hz several times before (De Vries,1948b; Eisner & MacLeod, 1981; Stockman, MacLeod, &Vivien, 1993; Stromeyer et al., 1987).The most remarkable changes in spectral sensitivityoccur above 11.3 log quanta s 1 deg 2 , where the 520/650-nm ratios for the detection <strong>of</strong> 15- and 22.5-Hz flickerfall precipitously, cross the Weber limit again, and approachL (Stockman, Montag, & MacLeod, 1991). Indeed,the ratio for DP reaches as low as 1 log unit, whereasthat for AS reaches about 1.35 log unit. These changesare opposite to the expected effects <strong>of</strong> chromatic <strong>adaptation</strong>,which predicts the spectral sensitivities to be closeto the Weber limits. The sensitivity ratios for 2.5 Hz,in contrast, remain close to M, whereas those for 7.5 Hzremain roughly between M and the Weber limit. Thisfrequency-dependent difference is important because itshows that the change is not just an overall suppression<strong>of</strong> the M-cone signal.The interpretation <strong>of</strong> the spectral sensitivity data interms <strong>of</strong> the model can be simplified by considering separatelythe effects <strong>of</strong> signal interactions on the resultantM- and L-cone signals. According to our model, the predominantsignals at the lower levels are sM, +sL, +fM, and+fL. Thus, at low frequencies the M-cone signals canceland the L-cone signals sum (so causing a spectral sensitivityshift towards L), but at higher frequencies, because<strong>of</strong> the delay <strong>of</strong> the <strong>slow</strong> signals, the M-cone signals constructivelyinterfere and the L-cone signals destructivelyinterfere (so causing a shift towards M). In contrast, thepredominant signals at higher levels are +sM, sL, +fM,and +fL. Thus, at low frequencies the M-cone signals sumand the L-cone signals cancel (so causing a shift towardsM), whereas at higher frequencies, again because thedelay <strong>of</strong> the <strong>slow</strong> signals, the M-cone signals will destructivelyinterfere and the L-cone signals constructivelyinterfere (so causing a shift towards L). Our dataare broadly consistent with these predicted shifts.At the critical radiance at which the sM+sL and+sM sL signals are assumed to cancel, the spectral sensitivitywill be that <strong>of</strong> the fast signals (+fM and +fL). Giventhat the two fast signals are additive with little phasedelay between them, the spectral sensitivity at the criticalradiance should be close to the Weber’s Law prediction,which is roughly the case for both subjects at 7.5, 15, and22.5 Hz. At 2.5 Hz, the spectral sensitivity is probably influencedby that <strong>of</strong> the Btrue[ chromatic channel (which generatesa color percept but does not cancel luminance flicker).Photopigment bleaching becomes significant at the highestfield radiances. It has the effect <strong>of</strong> reducing the conephotopigment optical density and narrowing the cone spectralsensitivity functions (for a discussion, see Stockman&Sharpe,1999). Consequently, it increases the 520/650-nmsensitivity ratio and reduces the paradoxical shift towardsL that we find at the highest levels.Flicker detectionFigure 5 shows the flicker detection threshold versus radiance(FTVR) curves for AS (top panel) and DP (bottompanel) from which the sensitivity ratios shown in Figure 4are calculated. The dashed diagonal lines, which correspondto Weber’s Law (i.e., a slope <strong>of</strong> one in double-logarithmiccoordinates), are shown for comparison.Several features <strong>of</strong> the FTVR functions are noteworthy.The most obvious feature is that the slopes <strong>of</strong> the 15- and22.5-Hz curves for detecting 520-nm flicker exceedWeber’s Law in the unshaded area <strong>of</strong> the figure between11.21 and 12.13 log 10 quanta s 1 deg 2 (having a meanslope <strong>of</strong> c. 1.1 for AS and 1.3 for DP). A second feature isthat the 520-nm FTVR curves fall short <strong>of</strong> Weber’s Lawin the pink area below 11.21 log 10 quanta s 1 deg 2 . Thisshortfall reflects mainly the fact that Weber’s Law has notyet been reached by the M-cones on the deep-red field,but it may also be due in part to constructive interference.A third feature is that the 650-nm FTVR curves for bothAS and DP roughly follow Weber’s Law at all intensities,except perhaps for some slight steepening just before11.21 log 10 quanta s 1 deg 2 .According to our model, these FTVR curves, like thespectral sensitivity data, should reflect the effects <strong>of</strong> destructiveand constructive interference between the <strong>slow</strong>and fast signal components. Those regions within whichdestructive interference occurs might be expected to haverelatively steep slopes (because the signals cancel andreduce sensitivity), whereas those in which constructiveinterference occurs might be expected to have relativelyshallow slopes (because the signals add and increasesensitivity).
<strong>Journal</strong> <strong>of</strong> <strong>Vision</strong> (2005) 5, 702–716 Stockman & Plummer 710between the delayed +sM signal and fast +fM(+fL) signalsat higher levels. The slopes for the detection <strong>of</strong> 2.5and 7.5 Hz 520 nm are shallower than those for 15 and22.5 Hz but do not fall below Weber’s Law presumablybecause <strong>of</strong> cancellation between sM and +sM signals inthe transition region. The 650-nm FTVR curves for DPand AS roughly follow Weber’s Law at all frequencies,which is consistent with Weberian <strong>adaptation</strong> <strong>of</strong> the fastsignals, except for a slight elevation <strong>of</strong> the curves for ASbelow 11.21 log 10 quanta s 1 deg 2 . This elevation mayreflect an imbalance between the +sL and sM signals atthat level.DiscussionThe results presented here illustrate the large frequencyandintensity-dependent changes that occur as the radiance<strong>of</strong> a deep-red field is increased from moderate to highlevels. We interpret these changes as reflecting changes inthe relative strengths <strong>of</strong> three M-cone signals (+sM, sM,and +fM) and <strong>of</strong> three L-cone signals (+sL, sL, and+fL), all <strong>of</strong> which we assume contribute to Bluminance[(see Figure 6). Below deep-red background radiances <strong>of</strong>about 11.21 log 10 quanta s 1 deg 2 , the dominant <strong>slow</strong>signals are +sL and sM (Stockman & Plummer, 2005),whereas above about 12.13 log 10 quanta s 1 deg 2 theyare sL and +sM (Stockman et al., 2005). The two fastsignals (+fM and +fL) are consistent with the conventionalnonopponent inputs to the luminance channel,whereas the <strong>slow</strong> signals (+sL sM or +sM sL) arespectrally opponent inputs. The existence <strong>of</strong> opponentinputs might be taken as evidence that our flickercancellation paradigm is influenced not just by the output<strong>of</strong> the luminance pathway but also by the output <strong>of</strong> aclassical, red-green chromatic pathway. Two properties <strong>of</strong>Figure 5. FTVR curves measured at 2.5 (dotted circles), 7.5(dotted squares), 15 (dotted triangles), and 22.5 (dotted invertedtriangles) Hz for 520-nm (black symbols) and 650-nm (whitesymbols) flicker as a function <strong>of</strong> the 658-nm background radiance.The shaded areas correspond to the areas similarly shaded inFigures 3 and 4. Upper panel: AS. Lower panel: DP.We interpret the Bsuper-Weber[ behavior between 11.21and 12.13 log 10 quanta s 1 deg 2 for 15 and 22.5 Hz,520 nm flicker as being due to a change from constructiveinterference between the delayed sM signal and fast+fM(+fL) signals at low levels to destructive interferenceFigure 6. A model <strong>of</strong> the signals underlying achromatic luminanceflicker perception. Slow, spectrally opponent sM+sL and +sM sLcone signals are assumed to interact with faster, nonopponent+fM+fL cone signals. The <strong>slow</strong>, inverted S-cone input is based onearlier work (Lee & Stromeyer, 1989; Stockman, MacLeod, &DePriest, 1987; Stockman, MacLeod, et al., 1991).
<strong>Journal</strong> <strong>of</strong> <strong>Vision</strong> (2005) 5, 702–716 Stockman & Plummer 711the signals involved counter such an interpretation. First,the <strong>slow</strong> flicker signals produce an achromatic perceptthat can be flicker photometrically cancelled with luminanceflicker; they do not produce a chromatic perceptthat might be expected <strong>of</strong> a red-green chromatic signal.Second, the temporal frequency responses <strong>of</strong> the <strong>slow</strong>signals extend to moderately high frequencies (Stockman& Plummer, 2005; Stockman et al., 2005), well beyondthe temporal frequency response <strong>of</strong> the psychophysicallydefined chromatic pathway (see, for example, De Lange,1958a; Wisowaty, 1981). Further evidence for this modeland further discussion can be found in our previouspapers (Stockman & Plummer, 2005; Stockman et al.,2005). The idea that there can be a spectrally opponentsignal that does not contribute to chromatic perceptionwas also raised by Stromeyer, Kronauer, Ryu, Chaparro,and Eskew (1995) in the context <strong>of</strong> motion detection. In alater paper, Stromeyer, Chaparro, Tolias, and Kronauer(1997) argued that such signals might be advantageousbecause they can make isoluminant stimuli visible to theluminance pathway.The data collected for the main experiments describedhere were obtained at frequencies <strong>of</strong> 2.5, 7.5, 15,and 22.5 Hz. At 7.5 Hz and above, good flicker nulls werepossible under all conditions, which is consistent with therebeing little or no chromatic intrusion at those frequencies.In contrast, although 2.5 Hz flicker nulls couldbe set under nearly all conditions, they were sometimesflicker minima rather than perfect nulls. The 2.5-Hz data,therefore, probably reflect some mixing <strong>of</strong> luminance andchromatic signals.The focus <strong>of</strong> this paper was on the intensity-dependenttransition from +sL sM to +sM sL. Our data are consistentwith the transition being caused by a growth in thesize <strong>of</strong> the +sL sM signal relative to the size <strong>of</strong> +sM sLsignal as the background radiance is increased, the twosignals being equal in amplitude at some Bcritical[ radiance.Because the signals are opposite in polarity, thiscritical radiance will be marked, not only by the amplitude<strong>of</strong> the resultant <strong>slow</strong> signal falling to a minimum,but also by a phase reversal, as we find. We explicitly assume,therefore, that the phase reversal is due to a changein the balance <strong>of</strong> two underlying mechanisms rather thana change in the polarity <strong>of</strong> a unitary mechanism. Thesetransitions are not restricted to the 658-nm field: theycan also be found on fields <strong>of</strong> 578, 600, and 633 nm(Stockman & Plummer, personal communication).We note that our data do not allow us to exclude analternative hypothesis that the transition reflects the polarityreversals <strong>of</strong> a population <strong>of</strong> unitary mechanisms withslightly different reversal intensities. However, the observation(see above) that the <strong>slow</strong> signals above the transitionare <strong>slow</strong>er than those below it suggests that two distinctmechanisms are involved. Moreover, a model in which twopairs <strong>of</strong> <strong>slow</strong> inputs partially cancel each other helps to explainwhy the <strong>slow</strong> luminance signals are comparativelysmall under most conditions and why they become perceptuallysignificant only when one or the other is relativelysuppressed by chromatic <strong>adaptation</strong>.Earlier psychophysical workThe identification <strong>of</strong> the sM and +sM inputs and theirinteractions with the +fM and +fL signals were reportedby us in preliminary form (Stockman, Montag, et al.,1991; Stockman & Plummer, 1994). We have sinceextended our measurements and refined our analyses toproduce a more complete model, in which each <strong>slow</strong>M-cone signal is paired with a spectrally opponent <strong>slow</strong>L-cone signal (see Figure 6 and Stockman & Plummer,2005; Stockman et al., 2005). In the interim, some <strong>of</strong> ourwork has been replicated, confirming our preliminaryconclusions.Clear psychophysical evidence for <strong>slow</strong>, inverted inputsto the luminance channel can be found in the earlier phasedelay data <strong>of</strong> Lindsey et al. (1986) and Swanson et al.(1987), although the results were not originally interpretedas such. The +sM and sM inputs were explicitlyidentified as a luminance inputs by Stockman et al. (1991)and Stockman and Plummer (1994), respectively. Subsequentto this work, Stromeyer et al. (1997) replicatedsome <strong>of</strong> our original experiments and analysis, and it isgratifying that in their meticulous study they were able toidentify both M-cone signals.Stromeyer et al. (1997, 1995) inferred the presence <strong>of</strong>the spectrally opponent +sM sL and +sL sM signalsfrom phase data obtained mainly from motion experimentsand also from flicker experiments (see also Stromeyeret al., 2000). Their novel contribution was to observe that+sM sL signals predominate on shorter <strong>wavelength</strong>fields.Theideathat<strong>slow</strong>Bchromatic[ +sL sM signalsoppose faster Bluminance[ signals on longer <strong>wavelength</strong>fields was proposed several years earlier by Smith et al.(1992) to account for data obtained from macaque magnocellular(MC)-projecting ganglion cells. In their model,Smith et al. assume that the +fM+fL signals are thecenter response <strong>of</strong> the ganglion cell, whereas the chromaticallyopponent +sL sM signals are the surroundresponse.Physiological considerationsPhase characteristics comparable to the ones that weidentify psychophysically can be found not only in theresponses <strong>of</strong> some MC ganglion cells (Smith et al., 1992),but also in the responses <strong>of</strong> some macaque parvocellular(PC) ganglion or LGN cells (Gouras & Zrenner,1979; Lankheet, Lennie, & Krauskopf, 1998) (althoughother studies <strong>of</strong> PC responses show smaller temporal
<strong>Journal</strong> <strong>of</strong> <strong>Vision</strong> (2005) 5, 702–716 Stockman & Plummer 712frequency-dependent effects than we find here; Benardete& Kaplan, 1997; Derrington, Krauskopf, & Lennie, 1984;Lee, Martin, & Valberg, 1989; Lee, Pokorny, Smith, &Kremers, 1994; Smith et al., 1992). Such data point to aretinal source for the signal interactions that we identifypsychophysically. We should, however, be cautious aboutmaking overly simple connections between retinal physiologyand human psychophysics, because any signalsfound in the retina are likely to be modified by multiplestages before guiding the observer’s response in any psychophysicaltask. Nevertheless, the recent report that PCsignals can be identified in the responses <strong>of</strong> MC cells bySun and Lee (2004) lends support to the idea that theseinteractions might be occurring as early as the retina.A cortical origin for the signal interactions is also astrong possibility. The substantial delay between the <strong>slow</strong>and fast signals might arise because <strong>of</strong> differences in thetransmission times <strong>of</strong> parvocellular and magnocellularsignals to the cortex, where the two signals might then interactto generate an achromatic flicker signal. Indeed, theparvocellular system is delayed by on average 17 msrelative to the magnocellular system at the level <strong>of</strong> theLGN (e.g., Schmolesky et al., 1998), although other estimatesat the LGN or cortex are lower at about 10 ms (e.g.,Maunsell et al., 1999; Maunsell & Gibson, 1992). Thesedelays are comparable to the delays between the <strong>slow</strong> andfast signals that we find after correction for selectivereceptoral <strong>adaptation</strong> (see Figure 7 <strong>of</strong> Stockman & Plummer,2005). There is also plenty <strong>of</strong> evidence for color-luminanceinteractions in a sizeable fraction <strong>of</strong> cells in primary cortex(e.g., Conway, 2001; Cottaris & De Valois, 1998; Gouras,1974; Hubel & Wiesel, 1968; Lennie, Krauskopf, &Sclar, 1990; Vidyasagar, Kulikowski, Lipnicki, & Dreher,2002). In a recent, carefully controlled study <strong>of</strong> cone inputsto macaque V1, Johnson, Hawken, and Shapley (2004)classified 34% <strong>of</strong> cells as color-luminance cells, 10% ascolor-preferring cells, and 56% as luminance-preferringcells. Yet another possible route for the <strong>slow</strong> color signalsto interact with flicker (or motion) signals is suggestedby the recent finding <strong>of</strong> a direct geniculate inputfrom mostly koniocellular LGN neurons to MT (Sincich,Park, Wohlgemuth, & Horton, 2004).Wherever these signal interactions originate, their phaseand amplitude characteristics are distinctive enough thatthey should be unmistakable in physiological recordingsmade with the appropriate stimuliVassuming, that is, thatthe interaction can be measured in a single neurons (ratherthan in a network).Are very high intensity red fields effectivelygreen after the photoreceptors?The <strong>slow</strong>, spectrally opponent +sM sL signals thatprevail under conditions <strong>of</strong> very intense long-<strong>wavelength</strong><strong>adaptation</strong> also prevail on adapting fields <strong>of</strong> <strong>wavelength</strong>sshorter than c. 570 nm (Stockman & Plummer, personalcommunication; Stromeyer et al., 1997). But why shouldan intense long-<strong>wavelength</strong> field and a short or middle<strong>wavelength</strong>field both reveal the same postreceptoralsignals? Intensity-dependent changes in color appearance,which are known collectively as the BezoldYBrücke effect,are well documented. Purdy (1931), in a fairly extensivestudy, reported that the appearance <strong>of</strong> long-<strong>wavelength</strong>lights shifted from red towards yellow with increasingradiance, but no further; there being an invariant <strong>wavelength</strong>at about 575 at which no change in apparent colorwith radiance was found. This observation is consistentwith first-order kinetics, which predicts that the asymptoticsensitivity <strong>of</strong> a cone at high bleaching levels shouldbe limited by Weber’s Law. Thus, although intense long<strong>wavelength</strong>bleaching lights would be expected to becomepostreceptorally neutral at high intensities (becausethe two cone types become equally sensitive to the background;see also above), they would not be expected to havean effect comparable to a short- or middle-<strong>wavelength</strong> light.Purdy’s observations, however, were made on onlymoderate to high intensity long-<strong>wavelength</strong> fields. At veryhigh intensities, the apparent color <strong>of</strong> a long-<strong>wavelength</strong>field gradually changes from red to yellow and finallyto green, which remains the Bsteady-state[ appearance(Auerbach & Wald, 1955; Cornsweet, Fowler, Rabedeau,Whalen, & Williams, 1958). Indeed, we also observe thatvery intense long-<strong>wavelength</strong> backgrounds (above thetransition from +sL sM to sL+sM) obtain a green tingeunder steady-state conditions. Interestingly, Cornsweet(1962) later contradicted his earlier conclusions (whichwere inconsistent with a first-order model <strong>of</strong> kinetics) andreported that the green appearance eventually faded backto yellow. We do not observe such a change on ourbrightest 658-nm fields.For long-<strong>wavelength</strong> fields to become effectively greenafter the photoreceptors, the additional loss <strong>of</strong> sensitivityin the L-cones to the background caused by bleaching hasto exceed Weber’s Law before the loss <strong>of</strong> sensitivity inthe M-cones reaches the same level. There is, in fact,good evidence that the L-cone loss will exceed that <strong>of</strong>the M-cone, because, although first-order bleaching kineticsis a useful simplification, the kinetics are, nonlinear.Several studies now concur that bleaching actually fallsbelow the first-order prediction at low bleaching levelsand above it at high (e.g., Burns & Elsner, 1985, 1989;Mahroo & Lamb, 2004; Reeves, Wu, & Schirillo, 1998;Smith, Pokorny, & van Norren, 1983). See, in particular,Figure 11B and Equation A10 <strong>of</strong> Mahroo & Lamb (2004);and for a general discussion, see Lamb & Pugh (2004). Theadditional loss <strong>of</strong> L-cone sensitivity to the backgroundcaused by nonlinear kinetics at high bleaching levels couldbe sufficient to make a high intensity long-<strong>wavelength</strong>bleaching field act postreceptorally more like a short- ormiddle-<strong>wavelength</strong> field.We speculate that the critical long-<strong>wavelength</strong> backgroundradiance is equivalent to a physiologically Bneutral[
<strong>Journal</strong> <strong>of</strong> <strong>Vision</strong> (2005) 5, 702–716 Stockman & Plummer 713background in the sense that the M- and L-cone signals itgenerates are balanced postreceptorally. On such a background,we assume that the <strong>slow</strong> signals are minimized bydestructive interference (see Stockman & Plummer, 2005).Suppression <strong>of</strong> the fast M-cone signal(+fM) by long-<strong>wavelength</strong> fieldsWe assume that the weights <strong>of</strong> the +sM versus sL and+sL versus sM inputs are balanced so that no <strong>slow</strong>signal is found under equichromatic conditions, when thetarget and background are <strong>of</strong> the same <strong>wavelength</strong>. To theextent that this assumption is true, the differences betweenm for the M- and for the L-cones (see Table 1) musttherefore reflect differences between the amplitudes <strong>of</strong> thetwo fast signals (i.e., +fL 9 +fM, by the ratio <strong>of</strong> m for theM-cones divided by m for the L-cones). A stronger +fLthan +fM cone signal is expected in most subjects, simplybecause the L-cone contribution to luminance is usuallylarger than the M-cone contribution (e.g., De Vries, 1948a;Smith & Pokorny, 1975; Stromeyer et al., 1985; Vos&Walraven, 1971; Walraven, 1974; Sharpe et al., in press),an asymmetry that is also found for our subjects, ASand DP. The asymmetries that we find, however, are toolarge to be due solely to different L- and M-cone contributionsto luminance. We must suppose, therefore, thatthe intense long-<strong>wavelength</strong> field causes an additionaland selective suppression <strong>of</strong> the +fM signal (or M-cone luminanceinput).Another aspect <strong>of</strong> our data is also consistent withan additional suppression <strong>of</strong> the +fM signal by the long<strong>wavelength</strong>field. At Level 4, the flicker spectral sensitivityat 22.5 Hz is as close to the L-cone spectral sensitivityas it is at 15 Hz (see also Figure 3 <strong>of</strong> Stockman et al.,2005). Given that the <strong>slow</strong> M-cone signals (+sM) and fastM- and L-cone signals (+fM and +fL) are only about 90-(DP) or 120- (AS) apart at 22.5 Hz (according to themodel fits), the shift to an L-cone spectral sensitivity atthis frequency cannot be entirely due to destructiveinterference. Such a shift towards L is also consistentwith a selective suppression <strong>of</strong> the +fM signals underconditions <strong>of</strong> long-<strong>wavelength</strong> <strong>adaptation</strong>, as are the veryhigh <strong>slow</strong>/fast signal ratio (m) values for the M-cones butnot for L-cones (see Table 1). This suppression seems tobe confined to the fast M-cone signals because thespectral sensitivities at 2.5 Hz and 7.5 Hz are not similarlyshifted towards L even at the highest backgroundradiance.Our evidence for a relative suppression <strong>of</strong> the +fMsignal on deep-red fields might seem at odds with the conclusions<strong>of</strong> others, based on 15- and 22.5-Hz flicker spectralsensitivity data, that it is the +fL signal (or L-coneluminance input) that is suppressed (Eisner & MacLeod,1981; Stromeyer et al., 1997; Stromeyer et al., 1987). However,our evidence and model suggest that any Bsuppression[<strong>of</strong> L is restricted to moderate long-<strong>wavelength</strong>intensities (being largest near 11.21 log 10 quanta s 1 deg 2 )and is due to a large extent to destructive interference betweenthe <strong>slow</strong> and fast cone signals rather than to suppression.The suppression that we find under conditions <strong>of</strong>long-<strong>wavelength</strong> <strong>adaptation</strong> is mainly a suppression <strong>of</strong>the +fM signals (see the m values in Table 1).Stiles k mechanismsThe changes in the slopes <strong>of</strong> the FTVR curves shownin Figure 5 are reminiscent <strong>of</strong> the changes in the slopes<strong>of</strong> threshold-versus-radiance (TVR) curves identifiedby Stiles as a transition from k 4 to k 4 or from k 5 to k 5(Stiles, 1953). The transitions between low (k 4 ) and high(k 4) intensity forms <strong>of</strong> predominantly M-cone mechanisms,or between low (k 5 ) and high (k 5) intensity forms <strong>of</strong> predominantlyL-cone mechanisms, were the subject <strong>of</strong> someexperimental interest in the early 1980s (e.g., Kirk, 1985;Reeves, 1982; Sigel & Brousseau, 1982; Sigel & Pugh,1980; Wandell & Pugh, 1980). We suggest that the transitionfrom k 4 to k 4 found on deep-red 667-nm fieldsreflects the same underlying change from sM+sL to+sM sL that we report here.ConclusionsUnder long-<strong>wavelength</strong> <strong>adaptation</strong>, fast nonopponentsignals (+fM+fL) and <strong>slow</strong> spectrally opponent signals(+sM sL and sM+sL) contribute to achromatic luminanceflicker perception. These signals constructively anddestructively interfere to produce characteristic, frequencydependentchanges in spectral sensitivity and phase delaydata without producing visible color variation. The twospectrally opponent signals seem to coexist at some levels,but their relative contributions to luminance change from apredominance <strong>of</strong> sM+sL at low long-<strong>wavelength</strong> <strong>adaptation</strong>levels to a predominance <strong>of</strong> +sM sL at high levels.AcknowledgmentsWe thank Rhea Eskew, Ted Sharpe, and HannahSmithson for helpful comments. This work was previouslysupported by NIH grant EY10206 and is currently supportedby a Wellcome Trust grant, both awarded to AS.Commercial relationships: none.Corresponding author: Andrew Stockman.Email: a.stockman@ucl.ac.uk.Address: Institute <strong>of</strong> Ophthalmology, University CollegeLondon, 11Y43 Bath Street, London EC1V 9EL, UK.
<strong>Journal</strong> <strong>of</strong> <strong>Vision</strong> (2005) 5, 702–716 Stockman & Plummer 714ReferencesAuerbach, E., & Wald, G. (1955). The participation <strong>of</strong> differenttypes <strong>of</strong> cones in human light and dark <strong>adaptation</strong>.American <strong>Journal</strong> <strong>of</strong> Ophthalmology, 39, 24Y40.[PubMed]Benardete, E. A., & Kaplan, E. (1997). The receptive field<strong>of</strong> primate P retinal ganglion cell: I. Linear dynamics.Visual Neuroscience, 14, 169Y185. [PubMed]Boynton, R. M. (1979). Human color vision. New York:Holt, Rinehart and Winston.Burns, S. A., & Elsner, A. E. (1985). Color matching athigh luminances: The color-match-area effect and photopigmentbleaching. <strong>Journal</strong> <strong>of</strong> the Optical Society<strong>of</strong> America A, 2, 698Y704. [PubMed]Burns, S. A., & Elsner, A. E. (1989). Localizing colorvision deficiencies in eye disease. Documenta OpthalmologicaProceedings Series, IX (pp. 167Y180).Dordrecht: Kluwer Academic Publishers.Chaparro, A., Stromeyer, C. F., III, Chen, G., & Kronauer,R. E. (1995). Human cones appear to adapt at low lightlevels: Measurements on the red-green detection mechanism.<strong>Vision</strong> Research, 35, 3103Y3118. [PubMed]Cicerone, C. M., & Nerger, J. L. (1989). The relative numbers <strong>of</strong> long-<strong>wavelength</strong>-sensitive to middle-<strong>wavelength</strong>sensitivecones in the human fovea centralis. <strong>Vision</strong>Research, 29, 115Y128. [PubMed]Conway, B. R. (2001). Spatial structure <strong>of</strong> cone inputsto color cells in alert macaque primary visual cortex(V-1). <strong>Journal</strong> <strong>of</strong> Neuroscience, 21, 2768Y2783.[PubMed]Cornsweet, T. N. (1962). Changes in the appearance <strong>of</strong>stimuli <strong>of</strong> very high luminance. Psychological Review,69, 257Y273. [PubMed]Cornsweet, T. N., Fowler, H., Rabedeau, R. G., Whalen,R. E., & Williams, D. R. (1958). Changes in theperceived color <strong>of</strong> very bright stimuli. Science, 128,898Y899. [PubMed]Cottaris, N. P., & De Valois, R. L. (1998). Temporaldynamics <strong>of</strong> chromatic tuning in macaque primaryvisual cortex. Nature, 395, 896Y900. [PubMed]Cushman, W. B., & Levinson, J. Z. (1983). Phase shift inred and green counter-phase flicker at high frequencies.<strong>Journal</strong> <strong>of</strong> the Optical Society <strong>of</strong> America, 73,1557Y1561. [PubMed]De Lange, H. (1958a). Research into the dynamic nature<strong>of</strong> the human fovea-cortex systems with intermittentand modulated light: I. Attenuation characteristicswith white and colored light. <strong>Journal</strong> <strong>of</strong> the OpticalSociety <strong>of</strong> America, 48, 777Y784.De Lange, H. (1958b). Research into the dynamic nature<strong>of</strong> the human fovea-cortex systems with intermittentand modulated light: II. Phase shift in brightness anddelay in color perception. <strong>Journal</strong> <strong>of</strong> the Optical Society<strong>of</strong> America, 48, 784Y789.De Vries, H. (1948a). The heredity <strong>of</strong> the relative numbers<strong>of</strong> red and green receptors in the human eye. Genetica,24, 199Y212.De Vries, H. (1948b). The luminosity curve <strong>of</strong> the eye asdetermined by measurements with the flicker photometer.Physica, 14, 319Y348.Derrington, A. M., Krauskopf, J., & Lennie, P. (1984).Chromatic mechanisms in lateral geniculate nucleus<strong>of</strong> macaque. <strong>Journal</strong> <strong>of</strong> Physiology, 357, 241Y265.[PubMed]Eisner, A., & MacLeod, D. I. A. (1980). Blue sensitivecones do not contribute to luminance. <strong>Journal</strong> <strong>of</strong> theOptical Society <strong>of</strong> America, 70, 121Y123. [PubMed]Eisner, A., & MacLeod, D. I. A. (1981). Flicker photometricstudy <strong>of</strong> chromatic <strong>adaptation</strong>: Selective suppression<strong>of</strong> cone inputs by colored backgrounds.<strong>Journal</strong> <strong>of</strong> the Optical Society <strong>of</strong> America, 71,705Y718. [PubMed]Eskew, R. T., McLellan, J. S., & Giulianini, F. (1999).Chromatic detection and discrimination. In K.Gegenfurtner & L. T. Sharpe (Eds.), Color vision:From genes to perception. Cambridge: CambridgeUniversity Press.Gouras, P. (1974). Opponent-colour cells in different layers<strong>of</strong> foveal striate cortex. <strong>Journal</strong> <strong>of</strong> Physiology, 238,583Y602. [PubMed]Gouras, P., & Zrenner, E. (1979). Enhancement <strong>of</strong> luminanceflicker by color-opponent mechanisms. Science,205, 587Y589. [PubMed]Guth, S. L., Alexander, J. V., Chumbly, J. I., Gillman,C. B., & Patterson, M. M. (1968). Factors affecting luminanceadditivity at threshold. <strong>Vision</strong> Research, 8,913Y928. [PubMed]Hubel, D. H., & Wiesel, T. N. (1968). Receptive fieldsand functional architecture <strong>of</strong> monkey striate cortex.<strong>Journal</strong> <strong>of</strong> Physiology, 195, 215Y243. [PubMed]Johnson, E. N., Hawken, M. J., & Shapley, R. (2004). Coneinputs in macaque primary visual cortex. <strong>Journal</strong> <strong>of</strong>Neurophysiology, 91, 2501Y2514. [PubMed]Kirk, D. B. (1985). The putative k 4 mechanism: Failure<strong>of</strong> shape invariance and field additivity. InvestigativeOphthalmology and Visual Science, 26(Suppl.),184.Lamb, T. D., & Pugh, E. N., Jr. (2004). Dark <strong>adaptation</strong>and the retinoid cycle <strong>of</strong> vision. Progress in Retinaland Eye Research, 23, 307Y380. [PubMed]Lankheet, M. J. M., Lennie, P., & Krauskopf, J. (1998).TemporalYchromatic interactions in LGN P-cells.Visual Neuroscience, 15, 47Y54. [PubMed]
<strong>Journal</strong> <strong>of</strong> <strong>Vision</strong> (2005) 5, 702–716 Stockman & Plummer 715Lee, B. B., Martin, P. R., & Valberg, A. (1989). Sensitivity<strong>of</strong> macaque retinal ganglion cells to chromatic andluminance flicker. <strong>Journal</strong> <strong>of</strong> Physiology, 414, 223Y243. [PubMed]Lee, B. B., Pokorny, J., Smith, V. C., & Kremers, J.(1994). Responses to pulses and sinusoids in macaqueganglion cells. <strong>Vision</strong> Research, 34, 3081Y3096.[PubMed]Lee, J., & Stromeyer, C. F., III. (1989). Contribution<strong>of</strong> human short-wave cones to luminance and motiondetection. <strong>Journal</strong> <strong>of</strong> Physiology, 413, 563Y593.[PubMed]Lennie, P., Krauskopf, J., & Sclar, G. (1990). Chromaticmechanisms in striate cortex <strong>of</strong> macaque. <strong>Journal</strong> <strong>of</strong>Neuroscience, 10, 649Y669. [PubMed]Lindsey, D. T., Pokorny, J., & Smith, V. C. (1986). Phasedependentsensitivity to heterochromatic flicker. <strong>Journal</strong><strong>of</strong> the Optical Society <strong>of</strong> America A, 3, 921Y927.[PubMed]Luther, R. (1927). Aus dem Gebiet der Farbreizmetrik.Zeitschrift fu.ṙTtechnischePhysik, 8, 540Y558.Mahroo, O. A. R., & Lamb, T. D. (2004). Recovery <strong>of</strong>the human photopic electroretinogram after bleachingexposures: Estimation <strong>of</strong> pigment regenerationkinetics. <strong>Journal</strong> <strong>of</strong> Physiology, 554, 417Y437.[PubMed]Maunsell, J. H., Ghose, G. M., Assad, J. A., McAdams,C. J., Boudreau, C. E., & Noerager, B. D. (1999).Visual response latencies <strong>of</strong> magnocellular andparvocellular LGN neurons in macaque monkeys.Visual Neuroscience, 16, 1Y14. [PubMed]Maunsell, J. H., & Gibson, J. R. (1992). Visual responselatencies in striate cortex <strong>of</strong> the macaque monkey.<strong>Journal</strong> <strong>of</strong> Neurophysiology, 68, 1332Y1344. [PubMed]Purdy, D. M. (1931). Spectral hue as a function <strong>of</strong> intensity.American <strong>Journal</strong> <strong>of</strong> Psychology, 63, 541Y559.Reeves, A. (1982). k 4 : Adaptation <strong>of</strong> one class <strong>of</strong> cone.<strong>Journal</strong> <strong>of</strong> the Optical Society <strong>of</strong> America, 72,1437Y1438.Reeves, A., Wu, S., & Schirillo, J. (1998). The effect <strong>of</strong>photon noise on the detection <strong>of</strong> white flashes. <strong>Vision</strong>Research, 38, 691Y703. [PubMed]Schmolesky, M. T., Wang, Y., Hanes, D. P., Thompson,K. G., Leutgeb, S., Schall, J. D., et al. (1998). Signaltiming across the macaque visual system. <strong>Journal</strong> <strong>of</strong>Neurophysiology, 79, 3272Y3278. [PubMed]Schrödinger, E. (1925). Über das Verhältnis der Vierfarbenzur Dreifarbentheorie. Sitzungberichte. Abt. 2a,Mathematik, Astronomie, Physik, Meteorologie undMechanik. Akademie der Wissenschaften in Wien,Mathematisch-Naturwissenschaftliche Klasse, 134,471.Sharpe, L. T., Stockman, A., Jagla, W., & Jägle, H.(in press). A luminous efficiency function, V*(E), fordaylight <strong>adaptation</strong>. <strong>Journal</strong> <strong>of</strong> <strong>Vision</strong>.Sigel, C., & Brousseau, L. (1982). k 4 : Adaptation <strong>of</strong> morethan one class <strong>of</strong> cone. <strong>Journal</strong> <strong>of</strong> the Optical Society<strong>of</strong> America, 72, 237Y246. [PubMed]Sigel, C., & Pugh, E. N., Jr. (1980). Stiles’s k 5 colormechanism: Tests <strong>of</strong> field displacements and fieldadditivity properties. <strong>Journal</strong> <strong>of</strong> the Optical Society<strong>of</strong> America, 70, 71Y81. [PubMed]Sincich, L. C., Park, K. F., Wohlgemuth, M. J., & Horton,J. C. (2004). Bypassing V1: A direct geniculate inputto area MT. Nature Neuroscience, 7, 1123Y1128.[PubMed]Smith, V. C., Lee, B. B., Pokorny, J., Martin, P. R., &Valberg, A. (1992). Responses <strong>of</strong> macaque ganglioncells to the relative phase <strong>of</strong> heterochromatically modulatedlights. <strong>Journal</strong> <strong>of</strong> Physiology, 458, 191Y221.[PubMed]Smith, V. C., & Pokorny, J. (1975). Spectral sensitivity<strong>of</strong> the foveal cone photopigments between 400 and500 nm. <strong>Vision</strong> Research, 15, 161Y171. [PubMed]Smith, V. C., Pokorny, J., & van Norren, D. (1983).Densitometric measurement <strong>of</strong> human cone photopigmentkinetics. <strong>Vision</strong> Research, 23, 517Y524.[PubMed]Stiles, W. S. (1953). Further studies <strong>of</strong> visual mechanismsby the two-colour threshold technique. Coloquio SobreProblemas Opticos de la <strong>Vision</strong>, 1, 65Y103.Stockman, A., MacLeod, D. I. A., & DePriest, D. D.(1987). An inverted S-cone input to the luminancechannel: Evidence for two processes in S-cone flickerdetection. Investigative Ophthalmology and VisualScience, 28(Suppl.), 92.Stockman, A., MacLeod, D. I. A., & DePriest, D. D.(1991). The temporal properties <strong>of</strong> the human shortwavephotoreceptors and their associated pathways.<strong>Vision</strong> Research, 31, 189Y208. [PubMed]Stockman, A., MacLeod, D. I. A., & Vivien, J. A. (1993).Isolation <strong>of</strong> the middle- and long-<strong>wavelength</strong> sensitivecones in normal trichromats. <strong>Journal</strong> <strong>of</strong> the OpticalSociety <strong>of</strong> America A, 10, 2471Y2490. [PubMed]Stockman, A., Montag, E. D., & MacLeod, D. I. A.(1991). Large changes in phase delay on intensebleaching backgrounds. Investigative Ophthalmologyand Visual Science, 32(Suppl.), 841.Stockman, A., & Plummer, D. J. (1994). The luminancechannel can be opponent? Investigative Ophthalmologyand Visual Science, 35(Suppl.), 1572.Stockman, A., & Plummer, D. J. (2005). Spectrally opponentinputs to the human luminance pathway: Slow+L and M cone inputs revealed by low to moderate
<strong>Journal</strong> <strong>of</strong> <strong>Vision</strong> (2005) 5, 702–716 Stockman & Plummer 716long-<strong>wavelength</strong> <strong>adaptation</strong>. <strong>Journal</strong> <strong>of</strong> Physiology,566, 77Y91. [PubMed]Stockman, A., & Plummer, D. J. (in preparation). Slow,spectrally-opponent inputs to the human luminancepathway.Stockman, A., Plummer, D. J., & Montag, E. D. (2005).Spectrally-opponent inputs to the human luminancepathway: Slow +M and L cone inputs revealed byintense long-<strong>wavelength</strong> <strong>adaptation</strong>. <strong>Journal</strong> <strong>of</strong> Physiology,566, 61Y76. [PubMed]Stockman, A., & Sharpe, L. T. (1999). Cone spectralsensitivities and color matching. In K. Gegenfurtner& L. T. Sharpe (Eds.), Color vision: From genes toperception (pp. 53Y87). Cambridge: Cambridge UniversityPress.Stockman, A., & Sharpe, L. T. (2000). Spectral sensitivities<strong>of</strong> the middle- and long-<strong>wavelength</strong> sensitivecones derived from measurements in observers<strong>of</strong> known genotype. <strong>Vision</strong> Research, 40, 1711Y1737.[PubMed]Stromeyer, C. F., III, Chaparro, A., Tolias, A. S., &Kronauer, R. E. (1997). Colour <strong>adaptation</strong> modifiesthe long-wave versus middle-wave cone weights andtemporal phases in human luminance (but not redgreen)mechanism. <strong>Journal</strong> <strong>of</strong> Physiology, 499,227Y254. [PubMed]Stromeyer, C. F., III, Cole, G. R., & Kronauer, R. E.(1985). Second-site <strong>adaptation</strong> in the red-green chromaticpathways. <strong>Vision</strong> Research, 25, 219Y237.[PubMed]Stromeyer, C. F., III, Cole, G. R., & Kronauer, R. E.(1987). Chromatic suppression <strong>of</strong> cone inputs to theluminance flicker mechanisms. <strong>Vision</strong> Research, 27,1113Y1137. [PubMed]Stromeyer, C. F., III, Gowdy, P. D., Chaparro, A.,Kladakis, S., Willen, J. D., & Kronauer, R. E. (2000).Colour <strong>adaptation</strong> modifies the temporal properties <strong>of</strong>the long- and middle-wave cone signals in the humanluminance mechanism. <strong>Journal</strong> <strong>of</strong> Physiology, 526,177Y194. [PubMed]Stromeyer, C. F., III, Kronauer, R. E., Ryu, A., Chaparro,A., & Eskew, R. T. (1995). Contributions <strong>of</strong> humanlong-wave and middle-wave cones to motion detection.<strong>Journal</strong> <strong>of</strong> Physiology, 485, 221Y243. [PubMed]Sun, H., & Lee, B. B. (2004). The origin <strong>of</strong> the chromaticresponse <strong>of</strong> magnocellular ganglion cells [Abstract].<strong>Journal</strong> <strong>of</strong> <strong>Vision</strong>, 4(11), 18a, http://journal<strong>of</strong>vision.org/4/11/18/, doi:10.1167/4.11.18.Swanson, W. H., Pokorny, J., & Smith, V. C. (1987).Effects <strong>of</strong> temporal frequency on phase-dependentsensitivity to heterochromatic flicker. <strong>Journal</strong> <strong>of</strong> theOptical Society <strong>of</strong> America A, 4, 2266Y2273. [PubMed]Vidyasagar, T. R., Kulikowski, J. J., Lipnicki, D. M., &Dreher, B. (2002). Convergence <strong>of</strong> parvocellular andmagnocellular information channels in the primaryvisual cortex <strong>of</strong> the macaque. European <strong>Journal</strong> <strong>of</strong>Neuroscience, 16, 945Y956. [PubMed]Vos, J. J., & Walraven, P. L. (1971). On the derivation <strong>of</strong>the foveal receptor primaries. <strong>Vision</strong> Research, 11,799Y818. [PubMed]Walls, G. L. (1955). A branched-pathway schema forthe color-vision system and some <strong>of</strong> the evidencefor it. American <strong>Journal</strong> <strong>of</strong> Ophthalmology, 39, 8Y23.[PubMed]Walraven, P. L. (1974). A closer look at the tritanopicconfusion point. <strong>Vision</strong> Research, 14, 1339Y1343. [PubMed]Walraven, P. L., & Leebeek, H. J. (1964). Phase shift <strong>of</strong>sinusoidally alternating colored stimuli. <strong>Journal</strong> <strong>of</strong> theOptical society <strong>of</strong> America, 54, 78Y82. [PubMed]Wandell, B. A., & Pugh, E. N., Jr. (1980). Detection <strong>of</strong>long-duration incremental flashes by a chromaticallycoded pathway. <strong>Vision</strong> Research, 20, 625Y635. [PubMed]Wisowaty, J. J. (1981). Estimates for the temporalresponse characteristics <strong>of</strong> chromatic pathways. <strong>Journal</strong><strong>of</strong> the Optical Society <strong>of</strong> America, 71, 970Y977.[PubMed]