High-resolution wave climate analysis in the Helgoland area - GKSS
High-resolution wave climate analysis in the Helgoland area - GKSS
High-resolution wave climate analysis in the Helgoland area - GKSS

You also want an ePaper? Increase the reach of your titles
YUMPU automatically turns print PDFs into web optimized ePapers that Google loves.
2.2 Model validation 13<br />
data was compared with HF <strong>wave</strong> simulation for <strong>the</strong> sou<strong>the</strong>rn North Sea and slight overestimation<br />
of high <strong>wave</strong>s by <strong>the</strong> model has been revealed (Matthias Zahn pers. com.). In<br />
<strong>the</strong> present study a similar comparison has been made for <strong>the</strong> surround<strong>in</strong>gs of <strong>Helgoland</strong><br />
us<strong>in</strong>g three sources of altimeter data. The TOPEX <strong>wave</strong> data was obta<strong>in</strong>ed from <strong>the</strong> GFZ-<br />
Potsdam dataset (Schöne et al. [2000]). Two differently processed datasets for <strong>the</strong> same<br />
period were available from <strong>the</strong> ERS2 satellite, namely, <strong>the</strong> Meteomer dataset (Bonicel et al.<br />
[1997]), later referred to as ERS Met and <strong>the</strong> GFZ-Potsdam dataset (ERS Pot). All <strong>the</strong><br />
data for significant <strong>wave</strong> height (SWH) was selected for <strong>the</strong> period 1998-2000 and <strong>the</strong> <strong>area</strong><br />
from 6 ◦ E to 8.4 ◦ E and from 53.6 ◦ N to 55.8 ◦ N. Each observation record was representative<br />
for mean over an <strong>area</strong> of about 6x6 km. Hourly SWH fields from <strong>the</strong> HF simulation were<br />
used for comparison. Only <strong>the</strong> altimeter data, for which times differ from <strong>the</strong> HF model<br />
times by less than 10 m<strong>in</strong>utes, were used so as to avoid <strong>the</strong> time <strong>in</strong>terpolation.<br />
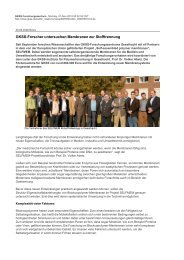
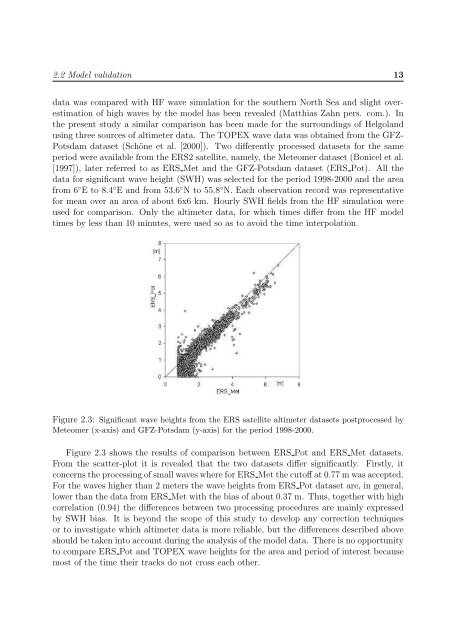
Figure 2.3: Significant <strong>wave</strong> heights from <strong>the</strong> ERS satellite altimeter datasets postprocessed by<br />
Meteomer (x-axis) and GFZ-Potsdam (y-axis) for <strong>the</strong> period 1998-2000.<br />
Figure 2.3 shows <strong>the</strong> results of comparison between ERS Pot and ERS Met datasets.<br />
From <strong>the</strong> scatter-plot it is revealed that <strong>the</strong> two datasets differ significantly. Firstly, it<br />
concerns <strong>the</strong> process<strong>in</strong>g of small <strong>wave</strong>s where for ERS Met <strong>the</strong> cutoff at 0.77 m was accepted.<br />
For <strong>the</strong> <strong>wave</strong>s higher than 2 meters <strong>the</strong> <strong>wave</strong> heights from ERS Pot dataset are, <strong>in</strong> general,<br />
lower than <strong>the</strong> data from ERS Met with <strong>the</strong> bias of about 0.37 m. Thus, toge<strong>the</strong>r with high<br />
correlation (0.94) <strong>the</strong> differences between two process<strong>in</strong>g procedures are ma<strong>in</strong>ly expressed<br />
by SWH bias. It is beyond <strong>the</strong> scope of this study to develop any correction techniques<br />
or to <strong>in</strong>vestigate which altimeter data is more reliable, but <strong>the</strong> differences described above<br />
should be taken <strong>in</strong>to account dur<strong>in</strong>g <strong>the</strong> <strong>analysis</strong> of <strong>the</strong> model data. There is no opportunity<br />
to compare ERS Pot and TOPEX <strong>wave</strong> heights for <strong>the</strong> <strong>area</strong> and period of <strong>in</strong>terest because<br />
most of <strong>the</strong> time <strong>the</strong>ir tracks do not cross each o<strong>the</strong>r.