Performance of Grey Mullet (Mugil cephalus L.) - Arabaqs.org
Performance of Grey Mullet (Mugil cephalus L.) - Arabaqs.org
Performance of Grey Mullet (Mugil cephalus L.) - Arabaqs.org
Create successful ePaper yourself
Turn your PDF publications into a flip-book with our unique Google optimized e-Paper software.
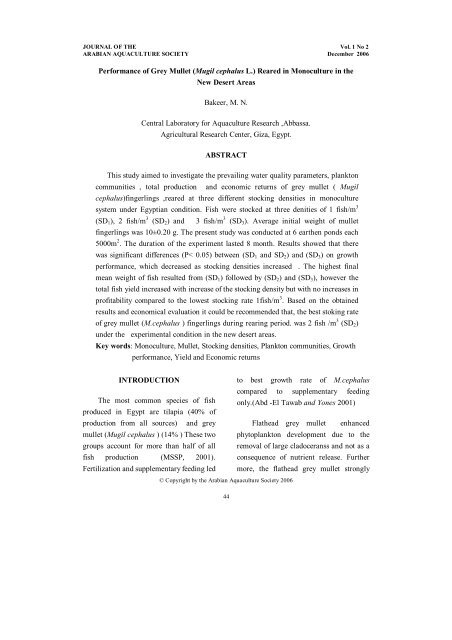
JOURNAL OF THE Vol. 1 No 2ARABIAN AQUACULTURE SOCIETY December 2006<strong>Performance</strong> <strong>of</strong> <strong>Grey</strong> <strong>Mullet</strong> (<strong>Mugil</strong> <strong>cephalus</strong> L.) Reared in Monoculture in theNew Desert AreasBakeer, M. N.Central Laboratory for Aquaculture Research ,Abbassa.Agricultural Research Center, Giza, Egypt.ABSTRACTThis study aimed to investigate the prevailing water quality parameters, planktoncommunities , total production and economic returns <strong>of</strong> grey mullet ( <strong>Mugil</strong><strong>cephalus</strong>)fingerlings ,reared at three different stocking densities in monoculturesystem under Egyptian condition. Fish were stocked at three denities <strong>of</strong> 1 fish/m 3(SD 1 ), 2 fish/m 3 (SD 2 ) and 3 fish/m 3 (SD 3 ). Average initial weight <strong>of</strong> mulletfingerlings was 10±0.20 g. The present study was conducted at 6 earthen ponds each5000m 2 . The duration <strong>of</strong> the experiment lasted 8 month. Results showed that therewas significant differences (P< 0.05) between (SD 1 and SD 2 ) and (SD 3 ) on growthperformance, which decreased as stocking densities increased . The highest finalmean weight <strong>of</strong> fish resulted from (SD 1 ) followed by (SD 2 ) and (SD 3 ), however thetotal fish yield increased with increase <strong>of</strong> the stocking density but with no increases inpr<strong>of</strong>itability compared to the lowest stocking rate 1fish/m 3 . Based on the obtainedresults and economical evaluation it could be recommended that, the best stoking rate<strong>of</strong> grey mullet (M.<strong>cephalus</strong> ) fingerlings during rearing period. was 2 fish /m 3 (SD 2 )under the experimental condition in the new desert areas.Key words: Monoculture, <strong>Mullet</strong>, Stocking densities, Plankton communities, Growthperformance, Yield and Economic returnsINTRODUCTIONThe most common species <strong>of</strong> fishproduced in Egypt are tilapia (40% <strong>of</strong>production from all sources) and greymullet (<strong>Mugil</strong> <strong>cephalus</strong> ) (14% ) These twogroups account for more than half <strong>of</strong> allfish production (MSSP, 2001).Fertilization and supplementary feeding ledto best growth rate <strong>of</strong> M.<strong>cephalus</strong>compared to supplementary feedingonly.(Abd -El Tawab and Yones 2001)Flathead grey mullet enhancedphytoplankton development due to theremoval <strong>of</strong> large cladoceranss and not as aconsequence <strong>of</strong> nutrient release. Furthermore, the flathead grey mullet strongly© Copyright by the Arabian Aquaculture Society 200644
GREY MULLET REARED IN MONOCULTURE IN THE NEW DESERT AREASmodified the benthic community ,probably due to direct predation (Torras etal., 2000).The survival <strong>of</strong> mullet exceeded97% and it did not appear to be affected bythe quantity or quality <strong>of</strong> food presentedand it also had the ability to digest andutilize the artificial diet (Abd El-Ghany etal., 1996) .<strong>Mullet</strong> have a world widedistribution because they feed at the lowesttrophic levels on plant detritus and algae.They are extremely abundant in estuaries ,and are easily caught and transported .They are especially suited for farming infish ponds ( Oren,1981 ).The aim <strong>of</strong> the present study was toinvestigate the water quality criteria,plankton communities, growth parameters,survival rate, body composition, total fishproduction and economic efficiency <strong>of</strong>grey mullet (M.<strong>cephalus</strong> ) reared atdifferent densities in the new desert areasunder monoculture conditions.MATERIALS AND METHODSThe present study was carried out inprivate fish farm at Wady-El Natron, BehiraGovernorate , Egypt .Six brackish waterearthen ponds <strong>of</strong> 5000 m 2 each and waterdepth 1.00 m. in average were used duringthe experimental period. Ponds werestocked with grey mullet (<strong>Mugil</strong> <strong>cephalus</strong>L.) fingerlings in monoculture system atstocking density <strong>of</strong> 1 fish/m 3 (SD 1 ), 2fish/m 3 (SD 2 ) and 3 fish/m 3 (SD 3 ). Threetreatments in two replicates each were used.Fish were adapted for two weeks period inconcrete pond before the start <strong>of</strong> theexperiment fed diet formulated from locallyavailable ingredients. Then active fishaveraging 10 ±0.20g. in weight wereallotted randomly to six earthen ponds. Dietwas formulated to contain nearly 20%crude protein and 3420 k. cal gross energyper kg. The protein, carbohydrate and lipidssources were fishmeal, yellow corn, wheatbran, wheat flour and corn oil respectively(Table, 1). Feed was distributed in thepelleted form <strong>of</strong> 2.0 mm. Feed was given tothe fish at 3% <strong>of</strong> the total biomass per day (5 days per week). The daily ration was<strong>of</strong>fered into two portions at 9.00, a.m. and2.00 p.m.. A sample <strong>of</strong> 100 fish from eachpond were weight at fortnight intervals andthe amount <strong>of</strong> feed <strong>of</strong>fered was readjusted.Individual weight and length were recorded(150 fish/pond) at the end <strong>of</strong> the presentstudy.Feed ingredients and sample werepulverized and homogenized. In thishomogenate, dry weight, nitrogen, fat,fiber and nitrogen free extract ( N.F.E.)were determined according to A.O.A.C.(1990). Whole body <strong>of</strong> fish samples wereground together after deep freezing andthe following were determined, dry matter,ash, lipid and protein according to A.O.A.C.(1990) . The experiment, wasstarted on 25 March and lasted for 32weeks. Organic and chemical fertilizerwere used in all experimental ponds, toaccelerate phytoplankton and zooplankton,at a rate <strong>of</strong> 200 kg cattle manure, 20 kg.superphosphate and 10 kg ammoniumsulfate biweekly.45
BAKEERTable (1) Composition and proximate chemical analyses <strong>of</strong> the experimental diet (As % <strong>of</strong> drymatter basis).Ingredients %Fish meal 20Yellow corn 33Wheat bran 33Wheat flour 7Corn oil 2Vitamin premix* 2.5Mineral premix** 2.5Total 100Chemical analysisDry matter 86.51Crude protein 19.81Ether extract 3. 38Ash 19.02Crude fiber 9.11Nitrogen free extract+ 48.68Gross Energy (kcal/g diet) ++ 3.42**Vitamins mixture contained (as g/ kg premix ) : Thiamine 2.5 ; Rib<strong>of</strong>lavin 2.5 , acidpyridxine 2.0 Inositol 100.0 ;Biotin 0.3; Pantothenic acid 100.0 ; Folic acid 0.75;Para-aminobenzioic 2. 5 Choline 200.0 Nicotinic acid 10. Cyanocobalmine 0.005;Tocopherol acetate 20.1 ;Ascorbic acid 50.0 ; Menadione 2.0 . ; Retinol palmitate100.000IU ; Cholecalciferol 500.000 IU.*** Minerals premix (as g/ kg <strong>of</strong> premix ) CaHPO4.2H20 727.7775; MgSO4 ; H20 127.5 ;KCal 50.0; NaCl 60.; FeSO4. 7H20 25.; ZnSO4. 7H20 5.5; MnSO4. 4H20 2.53;CuSO4.5H200.785; CoSO4. 7 H20 0.4775; Calo3.6H2 0.295; CrC13.6H20 0.1275+ Calculated by difference++ Gross energy were calculated , the energy value (Kcal/ g) for protein 5.65; for lipid 9.45and for carbohydrate 4.1 (Jobling , 1983)46
GREY MULLET REARED IN MONOCULTURE IN THE NEW DESERT AREASTo process the data, total gain wascalculated according to the equations.Total gain g / fish = Average final fishweight ( g) – Average Initial fish weight(g)Absolute Growth Rate (g / day) =Final fish weight (g) – Initial fish weight (g)Time in dayWater Quality MeasurementsTemperature, dissolved oxygen andpH were measured daily using temperatureand dissolved oxygen meter (YSI model57) and pH meter (model corning 345).Transparency and Turbidity were measureddaily by Secchi disk. Determinations <strong>of</strong>phosphorous and ammonia were carriedout every two weeks according to methods<strong>of</strong> Boyd (1990). Phytoplankton andzooplankton communities in pond waterdetermined every two weeks according tothe methods described by Boyd and Tucker(1992). Samples were collected fromdifferent sites <strong>of</strong> the experimental pondsrandomly to represent the water <strong>of</strong> thewhole pond.Statistical AnalysisOne way analysis <strong>of</strong> variance wastested after Steel and Torrie (1980).Duncan’s Multiple Range test (Duncan,1955) was applied to compare thesignificance means <strong>of</strong> the variousparameters at 5% probability level.RESULTS AND DISCUSSIONA) Water quality criteria1- Physial characteristicsAverage water quality criteria asaffected by different stocking densities arepresented in Table(2).Results revealed thatthere are no significant differences in watertemperature, which was ranged between22.4 and 29.3 o C in all treatments.Transparency (Secchi disk reading in cm)was significantly affected by differentstocking densities. The maximum averageswere obtained from treatment 1(SD 1 ) andtreatment 2 (SD 2 ) [14.65 and 15.0 cm,respectively], where third treatment was thelowest( 13.5cm). These mean that , athigher densities the water are more turbidwhich may be resulted from fish movementin the ponds. These values (watertemperature o C and Secchi disk readingcm.) are beneficial to fish cultivation. Inthis connection, Oren (1981); Marai et al.(2003) and Lupatsch et al. (2003) reportedthat no significant deferences intemperature was observed in ponds withdifferent stocking densities. In this respect,Abd-El Tawab and Yones (2001) found thattemperature <strong>of</strong> El-Fayoum fish farmsranged between 25.6 to 30.6, which arenear to our findings. Temperature andtransparency values are in the rangerecommended for the fish species culturedin the three treatments ( Boyd , 1990).47
BAKEER2- Chemical CharacteristicsAverage <strong>of</strong> pH values fortreatments (SD 1 ); (SD 2 ) and (SD 3 ) were8.25; 8.8 and 8.4, respectively. Anddifferences were insignificant (P≤0.05).Average <strong>of</strong> dissolved oxygen (DO) valueswere ranged between 3.82 to 8.95 mg/L.These values may be beneficial to fishcultivation and indicate also that dissolvedoxygen concentrations were decreased atearly moring in all experimental ponds.This values were agreed with the findings<strong>of</strong> Boyd and Tucker(1998).Unionized (free) ammonia values(NH 3 ) in Table (2) were low to be toxic t<strong>of</strong>ish , and it was < 0.5 mg/L and lay in thenormal range. These values are beneficialto fish cultivation and agreed with thefindings <strong>of</strong> Wurts (2003) and Samra (2006)who concluded that the toxic levels forunionized ammonia for short timeexposure usually lie between 0.6 to 2.0mg/L for pond fish. Averages <strong>of</strong> salinityand total hardness were no significantlyaffected by treatments (Table, 2). Thesevalues showed no variations and they layin the disirable range for mullet, cultured inthe three treatments Oren,(1981).Averages<strong>of</strong> phosphorus had ranged between 1.8 and2.5mg/L, which were insignificantlydifferences ( Table, 2) and showed nonutrient limitations ( Boyd, 1990).3-Hydro-Biological Features( Plankton communities)3-1-PhytoplanktonResults presented in Table (3)illustrated the effect <strong>of</strong> stocking densities<strong>of</strong> grey mullet on phytoplanktoncommunities. The total phytoplanktonproductivity for treatments (SD 1 ); (SD 2 )and (SD 3 ) were found to be 1860; 1254 and840 thousand <strong>org</strong>anism/L, respectively.Theresults in Table (3) indicate also that thehighest phytoplankton values wereobtained by the lowest density(SD 1 ) als<strong>of</strong>ollowed in a decreasing order with higherdensity, (SD 2 ) and (SD 3 ) treatments,respectively. The present study indicatedalso that green algae are the dominantgroup followed by euglena; blue greenalgae and diatoms in the all treatmentmullet groups. This means that,M.<strong>cephalus</strong> fingerlings preferred diatomsand blue green algae in their feeding habitsand this recommended by Essa and Salama(1990). This community composition <strong>of</strong>phytoplankton reported in this study is inagreement with observations <strong>of</strong> Abdel –Hakim et al. (2000). On the other handAbd-El Tawab (1994) gave differentcommunity compositions <strong>of</strong>phytoplankton, which may be due to thedifferences in the ecological conditions <strong>of</strong>the ecosystems studied.48
BAKEERTable (3): Average numbers <strong>of</strong> phytoplankton and zooplankton in the ponds water <strong>of</strong> mullet,reared at different densities.Org anisms(SD 1 )(SD 2 )(SD 3 )1fish/m 3 2fish/m 3 3fish/m 3Phytoplankton (thousands <strong>org</strong>anism / L)Blue green algae 420 400 309Green algae 680 558 410Diatoms 230 188 120Euglena 600 508 310(Biomass)Thou. <strong>org</strong>./L 1860 1254 840% <strong>of</strong> the smallest value 179.76% 149.28% 100%Zooplankton (<strong>org</strong>anism / L)Rotifera 2551 2120 1840Copepoda 86 51 26Cladocera 95 80 46Crustacea 1610 850 620(Biomass) <strong>org</strong>./L 4342 3101 2526% <strong>of</strong> the smallest value 171.89% 122.76% 100%B) Survival Ratepreferred crustacean <strong>org</strong>anisms in theirfeeding habits and the results <strong>of</strong> Essa andSalama (1990) recommended this finding.These results may be due to the feedinghabits <strong>of</strong> mullet species. The resultsindicted that the community composition<strong>of</strong> phytoplankton and zooplankton in alltreatment ponds fluctuated greatly withstocking densities and feeding habits <strong>of</strong>mullet whether phytoplanktonphagic orzooplanktonphagicAverages survival rate as affected bydifferent stocking densities are presentes inTable (4). The results revealed that thereare no significant differences in survivalrate , which has ranged between 85.3 %and 85.7 % in all treatments. Generally ,the survival rate <strong>of</strong> grey mullet exceeded85% in all treatments and it did not appearto be affected by the stocking densities.These results are in agreement with Oren,(1981) and Lupatsch et al. (2003).50
GREY MULLET REARED IN MONOCULTURE IN THE NEW DESERT AREASTable (4): Effect <strong>of</strong> stocking density on growth performance <strong>of</strong> grey mullet (<strong>Mugil</strong> <strong>cephalus</strong>).TreatmentsAvg. Initialbodyweightg/fishAvg. finalBodyweightg/ fishAvg.weightgaing/fishGrowthrateg/ day% <strong>of</strong> thesmallestvalue%survivalrate(SD 1 ) 10.0 a 210 a 200 a 0.89 a % 141.26a 85.3 a(SD 2 ) 9.8 a 205.8 ab 196 ab 0.87 ab %138.09ab 85.7 a(SD 3 ) 10.2 a 150.5 b 140.3 b 0.63 b % 100b 85.4 aMeans with common superscripts in each column were not significantly difference at the 5%level.affected the chemical composition <strong>of</strong>C) Growth performanceM.<strong>cephalus</strong> body, The lipid content washigher in highest density (SD 3 ), whileAs shown in Table (4) the averagefinal body weight <strong>of</strong> grey mullet were 210 ,205.8 and 150.5 g. for (SD 1 ) ; (SD 2 ) and(SD 3 ), respectively. Daily gains wereprotein content was lowest compared toother treatments .Moisture and ash contents<strong>of</strong> fish were some what similar and showedno trends related to stocking rates .between 0.63 and 0.89 g/day. Thesevalues are in agreement with that report byThese values are in a partlyOjaveer et al. (1996) , Abe- El Tawab andYones (2001) and Abdel Hakim et al.(2006) who found that the growth <strong>of</strong> greymullet was influenced by the differentagreement with that reported by Hepher(1988) who reported that stocking rate hadaffected the consuming natural food,<strong>org</strong>anisms contain low energy , whilestocking densities, fertilization and protein is in excess, therefore it is expectedsupplementary feeding which led to bestgrowth <strong>of</strong> M. cephalues. The obtainedresults reported that the stocking rate <strong>of</strong> 2that low stocking density fish consumingnatural food have minimal fat and maximalprotein accumulation in their body.fish/m 3 led to assign the largest growth <strong>of</strong>grey mullet.E) Total fish production (kg/Feddan)D) Chemical composition <strong>of</strong> whole bodyThe chemical compositions <strong>of</strong> thewhole body <strong>of</strong> grey mullet at the end <strong>of</strong> thestudy showed in Table (5). The differencestocking rates (1,2,3 fish/m 3 ) markedlyTotal fish yield (kg / Feddan) <strong>of</strong> thegrey mullet in relation to stocking rates arepresented in Table (6). Results revealedthat total fish yields at harvesting for(SD 1 ); (SD 2 ) and (SD 3 ) were found to be895.65; 1763.70 and 1927.90 kg51
BAKEERTable (5): Proximate chemical composition <strong>of</strong> whole body <strong>of</strong> grey mullet reared in pondsstocked with different densities .Treatments Moisture %Crude protein%Fat% Ash%Initial 80.22 a ±0.1258.80 c ±0.2211.20c ±0.1229.9 a ±0.18Final Stocking rate(SD 1 )76.19 b ±0.5361.32 a ±1.4012.98 b ±0.1225.71 a ±1.56Final Stocking rate(SD 2 )76.94 b ±0.2461.68 a ±0.6712.85 b ±0.0825.37 a ±0.54Final Stocking rate(SD 3 )73.36 c ±0.5360.51 b ±0.6513.84 a ±0.1525.65 a ±0.85Means with common superscripts in each column were not significantly difference at the 5%level.Table (6): Economical Efficiency <strong>of</strong> grey mullet (kg/feddan) in L.E.Item (SD 1 ) (SD 2 ) (SD 3 )Production kg./feddan 895.65 1763.70 1927.90% <strong>of</strong> the smallest value 100% 196.9% 215.25%(A) Operating costsFish fingerlings 3750 7500 11250Food 3642.29 622569 8916.53Chicken manure 200 200 200(B )Fixed costTaxes 100 100 100Labor 300 300 300Depreciation 100 100 100Total fixed cost 500 500 500(C) Total costs (kg./feddan) 8092.29 14425.69 20866.53(D) ReturnTotal Return /feddan 11195.62 22046.25 21206.9Net Return /feddan 3103.33 7620.56 340.37(E) % Net returns to total costs 27.71% 34.56% 1.60%The economical evaluation <strong>of</strong> results carried out according market price in 2005 in L.E.52
GREY MULLET REARED IN MONOCULTURE IN THE NEW DESERT AREASFish / Feddan respectively. These resultsindicate that increasing the stocking ratesfrom 1 to 2 fish/m 3 resulted in an increasein fish total yield by 96.9 % and a furtherincrease in the stocking rate 3 fish /m 3resulted in increase in the total yield by115.25% but with no increases inpr<strong>of</strong>itability compared to the loweststocking rate 1 fish/m 3 . These results mayindicate that in monoculture system <strong>of</strong> greymullet stocking rate 2 fish/m 3 is requiredfor better yield. These results areagreement with Abd-El Tawab (1994) andAbd-El Tawab and Yones (2001).Regarding to the more effective stockingratio 2 fish/m 3 for marketable size, it wasobvious that the stocked 2 fish/m 3 in pondswere valuable (Table, 6), since producedabout 60% <strong>of</strong> the total fish production asan marketable size, followed by 1 fish /m 3 .These results led also to conclude that thestocking rate <strong>of</strong> 2 fish/m 3 led to assigneconomic value.ACKNOWLEDGMENTAppreciation is extended to Mr.Mamduoh. Ibrahim Nossiear head <strong>of</strong>Aquaculture Department, Behira RuralDevelopment Project ,for providing helpand assistance during the study.Digestibility <strong>of</strong> feed and growthresponse <strong>of</strong> grey <strong>Mullet</strong> (<strong>Mugil</strong><strong>cephalus</strong> L.) fed on natural food and /or formulated diet in fresh water ponds.Egypt J. Agric. Res 73(2). 1996 .Abdel – Hakim,N.F.; Bakeer ,M.N. andSoltan, M.A. 2000.Effect <strong>of</strong> twomanuring systems on water quality andplankton communities in fish ponds.Conference <strong>of</strong> social and agriculturedevelopment <strong>of</strong> Sinai (D43 – 59) . 147-158, EL –Arish fac.<strong>of</strong> Unv.Agr.Sci.Abdel.,Hakim.N.F., Mohmmed S.Lashena; Mohammed, N. Bakeerand Adel Rahman, A. Khattaby2006. Effect <strong>of</strong> different feeding levelson growth performance and pondproductivity <strong>of</strong> Nile tilapia (Orechrmis niloticus), <strong>Grey</strong> mullet (<strong>Mugil</strong> cephalius ) and common carp(Cyprinus carpio ) reard in polyculturesystem. Egyptian J. <strong>of</strong> Aquatic Biologyand Fisheries 10(4)A.O.A.C. 1990. Official Methods <strong>of</strong>Analysis , 15 th edit , Association <strong>of</strong>Official Analysis Chemists. PP. 1298,Virginia .REFERENCESAbd El-Ghany, A. E.; Eid, A. E; Hermis,I. H. and Ibrahim, H. I. 1996.Abd- El Tawab, A. A. M. 1994. Somestudies in effects <strong>of</strong> some mineralelements on production performance <strong>of</strong>53
BAKEER<strong>Mugil</strong>idae family reared in Egyptianfish farms .M.Sc, University <strong>of</strong> theZagazic .Abd- El Tawab, A.A.M. and Yones,A.A.2001. Environmental and nutritionalstudies on rearing <strong>of</strong> mullet M.<strong>cephalus</strong>in Fayoum fish farms .Egyptian .J.Nutrition and Feeds, 4:719-730.Boyd, C.E. 1990. Water quality in pondsfor Aquaculture Alabama AgricultureExperiment Station Auburn University,Alabama. P.462.Boyd, E.C. and Tucker, C.S. 1992. Waterquality and soil analyses forAquaculture. Agricultural ExperimentStation, Aubrn University. Alabama.pp.183.Boyd E.C. and Tucker, C.S. 1998. Pondaquaculture water quality management.Kluwer , Boston.Duncan , D.B. 1955. Multiple range andmultiple F test . Biaetrics, 11 : 1-42.Essa,M.A. and Salama, M.E. 1990.Observations on the use <strong>of</strong> <strong>org</strong>anicfertilizer in rearing ponds <strong>of</strong> younggrey mullet ,<strong>Mugil</strong> <strong>cephalus</strong>.Communications in Science andDevelopment Research .,Vol .31:177-194.Hepher Balfour 1988. Nutration <strong>of</strong> pondfishes, formerly <strong>of</strong> fish and aquaculturestation, Dor , Israel .The presssyndicate <strong>of</strong> the university <strong>of</strong> combridge P.P 388.Jobling, M. 1983. A short review andcritique <strong>of</strong> mythology used in fishgrowth and nutrition studies. d .fish Biv., 23 : 685 – 703.Lupatsch, I.; Ktz, T. and Angel , D.L.2003. Assessment <strong>of</strong> the removalefficiently <strong>of</strong> fish farm effluents bygrey mullets .Israel Oceanographic andLimnlogical Research , National Centerfor Mari culture , POB 1212, 88112Eilat, Israel .34(15): 1367-1377.Marai-IFM; Gabr-HA. and Akar-AM.2003. Fish polyculture as affected byculture season , stocking density andbreeds under subtropical conditions <strong>of</strong>Egypt. Indian –Journal- <strong>of</strong> – Animal –Sciences 73: 2, 204- 208; 27 ref.MSSP 2001. Technical report, MarineAquaculture Development in Egypt.Multi –Sector Support Programmer(November, 2001) by Dr Ian Goulding.Ojaveer , H.;Morris, P.C. ;Davies , S.J.and Russell, P. 1996. Proteinrequirements <strong>of</strong> young grey mullet,<strong>Mugil</strong> capito.Aquacult ., 52 : 105-115 .Oren, OH. 1981. Aquaculture <strong>of</strong> greymullet. Book , 507pp.54
GREY MULLET REARED IN MONOCULTURE IN THE NEW DESERT AREASSamra,I.M. 2006. Some factors effectingon the growth <strong>of</strong> Nile tilapia . Thesis <strong>of</strong>Ph.D in fish production Depart. <strong>of</strong>Animal production. Fac. <strong>of</strong> Agric.Benha Unive.Steel, R.G.D. and Torrie J.H 1980.Principals and procedures <strong>of</strong> statistics.Mc Grow Hill Book Co. New York.Torras , X; Cardona, L. and Gisbert, E.2000. Cascading effects <strong>of</strong> the flatheadgrey mullet <strong>Mugil</strong> <strong>cephalus</strong> in freshwater eutrophic microcosmos. Aquac.Lab., Dep. Of Animal Bio. Fac.<strong>of</strong> Bio.,Univ at Avda. Diagonal 645, 08028 –Barcelona, Spain.Wurts, W.A. 2003. Daily pH cycle andammonia toxicity .World AquacultureMagazine , 34(2):20.أداء النمو لأسماك البورى الحرالمرباه فى النظام الآحادى النوع فى المناطق الصحراویة الجدیدة55
BAKEERمحمد نجیب بكیرالمعمل المركزى لبحوث الثروة السمكیة بالعباسةمركز البحوث الزراعیة –الجیزةمصر –أجری ت ھ ذا الدراس ة بھ دف التع رف عل ى ت أثیر مع دل التخ زین الس مكى عل ى ج ودة المی اهوالمجموع ات البلانكتونی ة والإنت اج الكل ى والكف اءة الاقتص ادیة لأس ماك الب ورى الح ر(<strong>Mugil</strong>Cephalus L.)وق د ت م اس تزراع اص بعیات الب ورى ف ى ث لاث كثاف ات مختلف ة ١٣ ، ٢ ،اص بعیةللمتر المكع ب) بمتوس ط وزن ± ١٠ ٠.٢٠ ج رام للس مكة الواح دة وق د ت م اس تخدا م ٦ أح واض ترابیةمساحة الحوض٥٠٠٠مت ر مرب ع واس تمرت التجربة ٨ ش ھور.وق د أش ارت النت ائج إل ى أن ھن اكاختلافات معنویة بین المعاملات الثلاثة فى أداء النمو وكان أفض ل مع دل نم و للأس ماك ت م الحص ولعلیھ فى معدل الكثافات الأقل مقارنة بمعدل الكثافة الأكبر على درجة معنویة ٥%وزن للأسماك ناتج من المعاملة الأولى ١سمكة/م٣٣٣سمكة/م (٢٠٥ جرام) ثم المعاملة الثالثة ٣ س مكة /مللأس ماك ك ان أعل ى ف ى الكثاف ة الأكبراقتصادیة مناسبة) ٢١٠ ج رام)) ١٥٠ج را م(.وكان أكب ر متوسطیلیھ ا ف ى الترتی ب المعامل ة الثانیة ٢وعل ى العك س ف أن الإنت اج الكلى٣(٣س مكة/م ( عن ھ ف ى الكثاف ة الأق ل ولك ن دون تحقی ق ج دوىوبناء على النتائج التى تم التحصل علیھا وكذلك التقییم الاقتصادى یمك ن أن نوص ى باس تزراعاصبعیات البورى الحر (.L (<strong>Mugil</strong> Cephalusبمتوسط وزن ١٠ جرام بمعدل كثافةسمكة للمتر 2المكعب تحت نفس ظروف التجربة فى المناطق الصحراویة الجدیدة وذلك للحصول عل ى أفض ل إنتاجوعائد اقتصادى ممكن.56


