Groundwater and Surface Water Contamination from Resource ...
Groundwater and Surface Water Contamination from Resource ...
Groundwater and Surface Water Contamination from Resource ...

You also want an ePaper? Increase the reach of your titles
YUMPU automatically turns print PDFs into web optimized ePapers that Google loves.
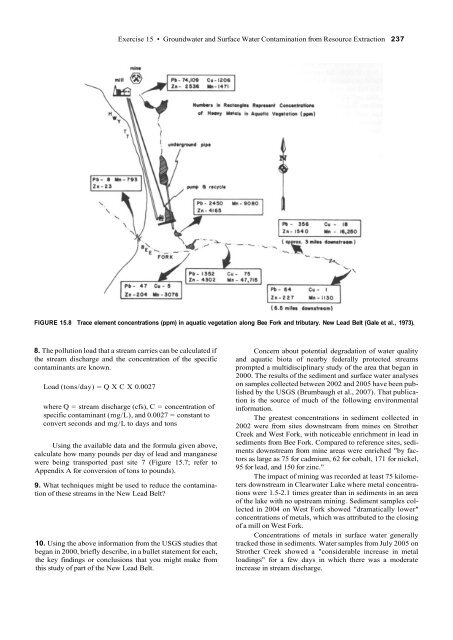
Exercise 15 • <strong>Groundwater</strong> <strong>and</strong> <strong>Surface</strong> <strong>Water</strong> <strong>Contamination</strong> <strong>from</strong> <strong>Resource</strong> Extraction 237FIGURE 15.8 Trace element concentrations (ppm) in aquatic vegetation along Bee Fork <strong>and</strong> tributary. New Lead Belt (Gale et al., 1973).8. The pollution load that a stream carries can be calculated ifthe stream discharge <strong>and</strong> the concentration of the specificcontaminants are known.Load (tons/day) = Q X C X 0.0027where Q = stream discharge (cfs), C = concentration ofspecific contaminant (mg/L), <strong>and</strong> 0.0027 = constant toconvert seconds <strong>and</strong> mg/L to days <strong>and</strong> tonsUsing the available data <strong>and</strong> the formula given above,calculate how many pounds per day of lead <strong>and</strong> manganesewere being transported past site 7 (Figure 15.7; refer toAppendix A for conversion of tons to pounds).9. What techniques might be used to reduce the contaminationof these streams in the New Lead Belt?10. Using the above information <strong>from</strong> the USGS studies thatbegan in 2000, briefly describe, in a bullet statement for each,the key findings or conclusions that you might make <strong>from</strong>this study of part of the New Lead Belt.Concern about potential degradation of water quality<strong>and</strong> aquatic biota of nearby federally protected streamsprompted a multidisciplinary study of the area that began in2000. The results of the sediment <strong>and</strong> surface water analyseson samples collected between 2002 <strong>and</strong> 2005 have been publishedby the USGS (Brumbaugh et al., 2007). That publicationis the source of much of the following environmentalinformation.The greatest concentrations in sediment collected in2002 were <strong>from</strong> sites downstream <strong>from</strong> mines on StrotherCreek <strong>and</strong> West Fork, with noticeable enrichment in lead insediments <strong>from</strong> Bee Fork. Compared to reference sites, sedimentsdownstream <strong>from</strong> mine areas were enriched "by factorsas large as 75 for cadmium, 62 for cobalt, 171 for nickel,95 for lead, <strong>and</strong> 150 for zinc."The impact of mining was recorded at least 75 kilometersdownstream in Clearwater Lake where metal concentrationswere 1.5-2.1 times greater than in sediments in an areaof the lake with no upstream mining. Sediment samples collectedin 2004 on West Fork showed "dramatically lower"concentrations of metals, which was attributed to the closingof a mill on West Fork.Concentrations of metals in surface water generallytracked those in sediments. <strong>Water</strong> samples <strong>from</strong> July 2005 onStrother Creek showed a "considerable increase in metalloadings" for a few days in which there was a moderateincrease in stream discharge.