Groundwater and Surface Water Contamination from Resource ...
Groundwater and Surface Water Contamination from Resource ...
Groundwater and Surface Water Contamination from Resource ...

You also want an ePaper? Increase the reach of your titles
YUMPU automatically turns print PDFs into web optimized ePapers that Google loves.
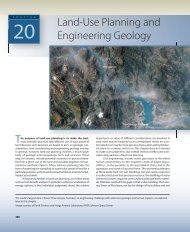
EXERCISE 15<strong>Groundwater</strong> <strong>and</strong> <strong>Surface</strong><strong>Water</strong> <strong>Contamination</strong><strong>from</strong> <strong>Resource</strong> ExtractionINTRODUCTIONGROUNDWATER AND SURFACE WATER MAY BE CONTAMINATED BY ACCIDENT OR BY IMPROPER STORAGE OR DISPOSALOF WASTES AT THE SURFACE. IMPROPER STORAGE OR DISPOSAL HAS OCCURRED IN MANY AREAS DUE TO OUR IGNORANCE ABOUT GROUNDWATER FLOW AND POTENTIAL HEALTHEFFECTS, THE LACK OF CONCERN FOR WATER SUPPLIES, AND ASHORT-TERM VIEW OF THE BEHAVIOR OF GROUNDWATER ANDOUR FUTURE NEEDS FOR WATER.IN THIS EXERCISE WE LOOK AT CASES IN WHICH PITSAND HOLDING PONDS WERE USED TO DISPOSE OF OR STORELIQUID WASTES. IN THE PAST IT WAS EXPEDIENT TO CREATEWASTE PONDS, WHERE THE WASTES DECREASED IN VOLUMETHROUGH EVAPORATION OR INFILTRATION. IN THIS EXERCISE WEEXPLORE THE CAUSE AND EXTENT OF CONTAMINATION FROMOIL FIELD BRINES AND RUNOFF FROM A LEAD MINE.PART A. GROUND WATER CONTAMINATIONFROM OIL FIELD BRINES IN CENTRAL OHIOIn many oil-producing areas, severe problems ofgroundwater contamination were common. Thesewere caused primarily by the infiltration of saltwaterinto the ground. Saltwater, or brine, is produced withthe oil <strong>and</strong>, since the brine often is a by-product of littleor no economic value, when unregulated it wascommonly disposed of in the most economical mannerpossible. In most areas this is done by reinjection intothe oil-producing zone by means of a well. In others itis accomplished by pumping the brine into holdingponds or pits, where a small percentage evaporatesbut most of it infiltrates. Infiltration can lead to severegroundwater pollution since the chloride concentrationsof the brines may exceed 35,000 mg/L. In contrastmany areas have groundwater with backgroundor naturally occurring chloride concentrations of lessthan 25 mg/L. Sea water is less salty than the brines,with a chlorinity of 19,000 mg/L, which makes up 55percent of the total salt content of sea water.Once the oil wells <strong>and</strong> pits are closed, the chemicalquality of the groundwater tends to improve, usuallyvery slowly, as the concentrated solutions migrate toareas of discharge such as springs, streams, or wells. Thenatural flushing of the groundwater system depends onthe hydraulic conductivity of the rocks, the hydraulicgradient, the effective porosity, <strong>and</strong> the amount <strong>and</strong> rateof infiltration of rain <strong>and</strong> snowmelt. It may requiredecades for the groundwater system to return to its naturalchemical state. The rate of flushing <strong>and</strong> the amountof time that the groundwater reservoir remains contaminatedare of profound interest in legal cases.The brines sterilize the soil, kill vegetation, <strong>and</strong>create an undesirable taste in drinking water. The concentrationat which a brine becomes harmful to vegetationdepends on the type of plant, the depth of theroot system, the season, <strong>and</strong> the depth of the watertable, to mention only a few factors. Dead trees <strong>and</strong>other vegetation, however, commonly mark areaswhere brine-contaminated groundwater dischargesinto streams or where it flows <strong>from</strong> springs. TheUSEPA recommends that drinking water contain nomore than 250 mg/L of chloride, since higher concentrationscause a salty taste. Higher concentrations arenot likely to cause illness in humans because the wateris too salty for consumption.Most of the problems developed prior to 1980;however, research on the fate of contaminant plumescontinues to the present.<strong>Groundwater</strong> <strong>Contamination</strong>near Delaware, OhioIn this part of the exercise we study the extent, movement,<strong>and</strong> changes in concentration of oil field brinesthat contaminated a site on the nearly flat floodplain ofthe Olentangy River in Ohio. Three oil wells were227
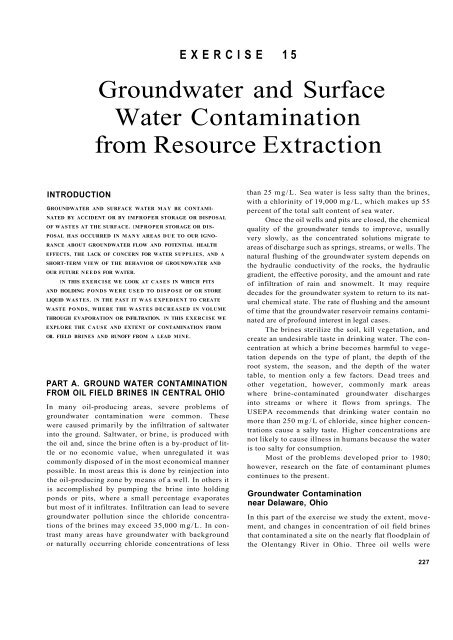
228 III. Introduction to <strong>Water</strong> <strong>Resource</strong>s <strong>and</strong> <strong>Contamination</strong>drilled in this area in June 1964. The brine-to-oil ratiowas about 10:1, <strong>and</strong> nearly 236,000 barrels of salt waterwere pumped into three ponds <strong>from</strong> June 1964 to July1965. Dissolved solids in the brine averaged 60,000mg/L, <strong>and</strong> of this about 35,000 mg/L consisted of thechloride ion (Pettyjohn, 1971).The accompanying figures (Figures 15.1, 15.2,15.3) show the location of four brine-disposal pits,three oil wells, 25 observation wells, <strong>and</strong> a waterwell. The observation wells averaged 25 feet in depth<strong>and</strong> were installed in late 1965, following cessationof brine disposal, to monitor the movement of thecontaminated groundwater. Shale bedrock is overlainby up to 30 feet of alluvial material consistingof a mixture of s<strong>and</strong>, silt, <strong>and</strong> clay. The averagehydraulic conductivity (K) of the alluvial material,which contains the contaminated water, is about 25ft/day, <strong>and</strong> the average effective porosity (n e) is 0.15.The water table gradient (I) can be determined <strong>from</strong>a water-table map.The objectives of the exercise are to determinethe direction <strong>and</strong> rate of flow of the contaminants inthe ground <strong>and</strong> to evaluate the possible contaminationof a nearby water well.FIGURE 15.1 Map showing configuration of the water table in March 1969.
230 III. Introduction to <strong>Water</strong> <strong>Resource</strong>s <strong>and</strong> <strong>Contamination</strong>QUESTIONS 15, PART A1. Using the data in Table 15.1, construct a water-table map(Figure 15.1). Begin by transferring the water-table elevations<strong>from</strong> Table 15.1 to the appropriate test hole locations inFigure 15.1. Then contour the water-surface elevations usinga contour interval of 2 feet. The contours should roughlyparallel the 864-feet contour already drawn.2. Draw several flow lines originating at the brine holdingponds to the most likely area of groundwater discharge.Remember that during dry weather streams flow onlybecause groundwater discharges into them.3. What is the gradient <strong>from</strong> pond C to the Olentangy River?ft/ft.4. What is the gradient <strong>from</strong> pond C to Saunders Creek? ft/ft.5. Calculate the velocity of groundwater moving <strong>from</strong> pondC to the Olentangy River <strong>and</strong> <strong>from</strong> pond C to SaundersCreek using the following formula <strong>and</strong> the data given earlierin this exercise on the hydraulic characteristics of the unconsolidatedmaterial.v = {KI)/(n e)where v = velocity (ft/day), K = hydraulic conductivity(ft/day) I = gradient, (ft/ft), <strong>and</strong> n e= effective porosity(% as a decimal)a. The velocity of groundwater <strong>from</strong> pond C to the OlentangyRiver is about ft/day.TABLE 15.1 Chloride Content of Wells <strong>and</strong> <strong>Water</strong>-Table Elevation in the Delaware AreaWell No. <strong>Water</strong>-Table Elevation (March 1969) Chloride Content (mg/L)Nov. 1965 Oct. 1966 March 19691 867 4,500 288 242 871 — 875 363 866 12 12 124 869 — 12,000 2005 862 — 8,000 4006 868 18,000 8,875 4077 868 — 26,250 6628 865 — 1,000 4909 870 — 14 1610 868 25,500 9,850 91711 868 31,000 7,500 55012 864 — 8,750 74013 865 — 6,875 1,35514 864 — 3,125 29215 864 — 1,725 30216 864 22,750 15,500 1,23017 868 — 10,000 1,30018 864 5,600 1,500 60019 869 27 25 30020 862 15,000 1,40021 865 9,000 1,10022 862 4,800 4,800 11723 859 5,250 6,625 77924 861 33 235 2725 860 95 — 40W-1 880 20 320
Exercise 15 • <strong>Groundwater</strong> <strong>and</strong> <strong>Surface</strong> <strong>Water</strong> <strong>Contamination</strong> <strong>from</strong> <strong>Resource</strong> Extraction 231b. The velocity of groundwater <strong>from</strong> pond C to SaundersCreek is about ft/day.11. What techniques might be used to increase the rate of flushingof the high-chloride water in the areas of contaminatedsoil?6. If we divide the distance of travel (measured along a flowline) by the rate of flow of groundwater, we obtain the traveltime. What are the travel times for water <strong>from</strong> pond C toa. Olentangy River:b. Saunders Creek:7. On another map (Figure 15.2) construct contours representinglines of equal chloride concentrations (isochlors).Use the data for October 1966 (Table 15.1) <strong>and</strong> a contourinterval of 5,000 mg/L. Consider the direction of groundwaterflow when drawing these contours. Thus isochlors aregiven in Figure 15.2.8. Should the Olentangy River <strong>and</strong> Saunders <strong>and</strong> NorthCreeks contain higher than normal concentrations of chloridein the vicinity of the contaminated area? Why?12. A second isochlor map, based on the March 1969 data, isshown in Figure 15.3. A contour interval of 300 mg/L wasused. This map is useful in determining the change in contaminationwith time. Compare Figures 15.2 <strong>and</strong> 15.3 <strong>and</strong>describe the changes that have occurred.13. The shallow farm well (12 ft deep) at W-l increased inchloride concentration between 1966 <strong>and</strong> 1969 (Table 15.1).Has this contamination resulted <strong>from</strong> brine disposal intoponds A, B, C, or D? Explain your answer with the aid of thecross-section sketch (Figure 15.4), which goes <strong>from</strong> points Xto X' in Figure 15.1. Complete the water table <strong>and</strong> indicategroundwater flow by arrows in Figure 15.4.9. Wells 23 <strong>and</strong> 24 (Table 15.1) contain higher concentrationsof chloride in October 1966 than in November 1965, whilethe other wells contained less. Consider your answer toquestion 6b in your explanation of why this is happened.10. What do you think the chloride concentration of thegroundwater was before brine-pit disposal began (i.e., whatwas the background concentration)?PART B. SURFACE WATER CONTAMINATIONFROM OIL FIELD BRINES IN CENTRAL OHIOIn this part of the exercise river pollution can be tracedto techniques for disposing of saltwater (brine) that ispumped with oil. Regulations in most areas nowrequire subsurface disposal of oil field brines <strong>and</strong> havesignificantly reduced groundwater <strong>and</strong> surface-waterpollution.<strong>Surface</strong> waters can be contaminated directlythrough effluent discharge <strong>and</strong> surface runoff or indirectlythrough discharge of contaminated groundwater.This exercise illustrates the effects on a drainagebasin of poor waste-disposal practices of oil fieldFIGURE 15.4 Cross section <strong>from</strong> points X to X' in Figure 15.1.
232 III. Introduction to <strong>Water</strong> <strong>Resource</strong>s <strong>and</strong> <strong>Contamination</strong>brines; specifically we will look at a case wheregroundwater contamination has led to the deteriorationof surface-water quality. A generalized diagramshowing movement of groundwater into a stream isshown in Figure 15.5.The water table usually lies at a depth of a fewfeet <strong>and</strong> follows the general topography of the l<strong>and</strong>surface; that is, the water table is at a higher elevationunder hills than it is in nearby low-lying areas.<strong>Groundwater</strong> moves in the direction of the water-tablegradient, <strong>from</strong> higher pressure to lower pressure,which often may mean <strong>from</strong> higher elevation to lowerelevation. Where the l<strong>and</strong> surface is lower than thewater table, such as at a swamp, lake, or stream,groundwater will flow onto the l<strong>and</strong> surface.Rainwater has a low mineral content, but as itslowly infiltrates soils <strong>and</strong> bedrock <strong>and</strong> perhaps flowsgreat distances, its mineral content increases. The types<strong>and</strong> concentration of constituents in groundwaterreflect the composition of the soils <strong>and</strong> rocks throughwhich the water has moved. The naturally occurringconcentrations of elements in groundwater are calledbackground concentrations. If a water-soluble contaminantis allowed to infiltrate the ground, it will increasethe concentrations of elements <strong>and</strong> compounds in thegroundwater <strong>and</strong> may contaminate it so it is unusable.In some parts of the world, an indirect but significantcause of surface-water contamination is disposalof oil-field brines. The brines, which are highly concentratedsolutions consisting largely of sodium chloride(NaCl), are pumped <strong>from</strong> the ground with the oil.The mixture is routed through a separator whichremoves the oil <strong>from</strong> the brine. The oil flows to storagetanks while the brine most commonly is discharged toan unlined holding or evaporation pond (see Part A ofthis exercise) or is pumped back into the bedrock. Insome climates where ponds are used, only a very smallpart of the brine evaporates; most of it infiltrates.Brines sterilize soil, kill vegetation, <strong>and</strong> create anundesirable taste in water. The U.S. EnvironmentalProtection Agency has recommended that drinkingwater should contain no more than 250 mg/L of chloridebecause higher concentrations cause a salty taste.Even with careful regulation of the extractiveindustries, higher background readings of somecomponents can be expected in some areas due to naturalweathering <strong>and</strong> erosion. Before there was anyhuman exploitation of oil in North America, naturalbrine seeps <strong>and</strong> springs degraded water quality insome areas.Alum Creek Basin, OhioLow relief <strong>and</strong> a relatively high water table characterizethis watershed in central Ohio. Much of the agriculturall<strong>and</strong> is artificially drained. The region is underlainby a clayey glacial till that in many places contains thinlayers of gravel. The till ranges <strong>from</strong> a few inches toseveral tens of feet in thickness. Oil-bearing reservoirsunderlie much of the region at an average depth ofabout 3,500 feet.Sixty-five water samples were collected in lateautumn <strong>from</strong> streams in the upper part of the basin.Because there was no rain or surface runoff for severaldays prior to collection, <strong>and</strong> because groundwater dischargesto the streams, the stream data represent thequality of the groundwater. The samples were analyzedto determine chloride ion concentrations. Chloride is acommon constituent in oil field brines (Table 15.2).Stream sampling sites <strong>and</strong> locations of existing or ab<strong>and</strong>onedgas or oil wells, including dry holes, are shownin Figure 15.6.QUESTIONS 15, PART B1. Using the data in Table 15.2 <strong>and</strong> Figure 15.6, construct asurface-water quality map. Assume that the chloride contentat a station reflects the quality between that site <strong>and</strong> the nextupstream station. Mark in blue the stream reaches that contain25 mg/L or less of chloride. Use brown for reaches thatcontain more than 25 but less than 50 mg/L, <strong>and</strong> red forreaches that exceed 50 mg/L. A map of this type not onlypresents an obvious picture of the change in water quality<strong>from</strong> one area to the next, but it also can be used to determinethe major source areas of contamination. Use onlythose data representing sample sites 1-41. Sites 42-65 on theother streams can be examined if you are interested or if theinstructor assigns them. You may substitute other colors orpatterns for the colors suggested above.2. Briefly describe the quality of the water in Alum Creekbasin using the map you completed in Question 1.3. What areas are the major sources of chloride contaminationin the drainage basin?FIGURE 15.5 Generalized diagram illustrating contaminationof groundwater <strong>and</strong> surface water by pit disposal of oil fieldbrines (Pettyjohn, 1972, p. 168).4. Why did the chloride concentration decrease between sites21 <strong>and</strong> 25?
Exercise 15 • <strong>Groundwater</strong> <strong>and</strong> <strong>Surface</strong> <strong>Water</strong> <strong>Contamination</strong> <strong>from</strong> <strong>Resource</strong> Extraction 233TABLE 15.2 Sample Site Numbers <strong>and</strong> Concentration of Chloride Ion, in mg/L, in Alum Creek BasinSite CI (mg/L) Site CI (mg/L) Site CI (mg/L)1 6 23 23 45 792 64 24 24 46 1013 79 25 84 47 164 41 26 37 48 165 210 27 33 49 626 15 28 39 50 627 195 29 13 51 588 5 30 8 52 539 10 31 41 53 4710 7 32 629 54 4211 159 33 77 55 2212 33 34 103 56 2713 62 35 21 57 4814 6 36 113 58 815 66 37 38 59 2516 62 38 11 60 1617 122 39 23 61 2418 11 40 21 62 2219 55 41 109 63 2620 53 42 22 64 3021 119 43 11 65 2922 10 44 1165. Would you expect the stream's chloride concentration tobe greater or less during the spring? Why?6. Obviously, much of the groundwater in the basin is contaminated,at least locally. Do you think that all of the groundwateris contaminated? Explain.9. In the upper part of the basin, many of the agriculturalfields are underlain by drainage tile. The tiles interceptgroundwater <strong>and</strong> divert it away <strong>from</strong> the fields. This causesthe water table to remain at a lower elevation in fields withtile than in fields without tile. Ultimately, drainage <strong>from</strong>these tiles flows into a stream. How could you use data <strong>from</strong>water-quality samples taken <strong>from</strong> field tiles to aid in determiningthe areas of groundwater contamination by oil fielddrilling <strong>and</strong> extraction activities?7. Outline two areas in Figure 15.6 that should show backgroundconcentrations of chloride.8. What are possible sources of chloride contamination inAlum Creek other than oil field brines?PART C. SURFACE WATER CONTAMINATIONFROM LEAD MINES IN SOUTHEASTERNMISSOURIIn this part we look at the impact of heavy metals <strong>from</strong>a lead-mirting district on water <strong>and</strong> aquatic organisms.Similar impacts can be documented in other areas ofNorth America; however, new mine operation <strong>and</strong> closingpractices have lessened the environmental impact ofmining.In 1955 new deposits of copper, lead, silver, <strong>and</strong>zinc were discovered in southeastern Missouri. This
234 III. Introduction to <strong>Water</strong> <strong>Resource</strong>s <strong>and</strong> <strong>Contamination</strong>FIGURE 15.6 Chloride ion concentration in Alum Creek basin in the autumn.region, known as the New Lead Belt, became one ofthe largest lead-producing areas in the world. It continuesto be a primary producer of lead with secondaryproduction of zinc, <strong>and</strong> small quantities ofcopper <strong>and</strong> silver (Brumbaugh et al, 2007). In order toevaluate the impact of mining on this sparsely populated,heavily forested, <strong>and</strong> hilly region, a number of surfacewater<strong>and</strong> aquatic life forms were examined. Sampleswere collected <strong>from</strong> streams free of mining <strong>and</strong> millingoperations (control samples) <strong>and</strong> <strong>from</strong> contaminatedstreams.
Exercise 15 • <strong>Groundwater</strong> <strong>and</strong> <strong>Surface</strong> <strong>Water</strong> <strong>Contamination</strong> <strong>from</strong> <strong>Resource</strong> Extraction 235Changes in water quality <strong>and</strong> aquatic life in thesestreams since 1955 are related to the discharge ofmilling <strong>and</strong> mining wastes which include excess waterpumped <strong>from</strong> mines, finely crushed rock, chemicalreagents, <strong>and</strong> waste oils <strong>and</strong> fuel. These wastes areallowed to settle in holding ponds, <strong>and</strong> the effluent iseither reused or allowed to discharge into streams. Thegreatest share of the noxious substances is retained inthe settling basins.Most of the heavy metals in the streams are invery fine particles; a minute amount is dissolved butmost heavy metals travel on suspended sediment inthe water. Where large excesses of groundwater havebeen pumped <strong>from</strong> mines <strong>and</strong> discharged into streams,significant algal blooms have occurred. They may be aresult of the nutrients in the groundwater. The densealgal communities act as filters <strong>and</strong> remove many ofthe fine particles that escape the settling basins.In this exercise we begin by investigating metalcontamination of water <strong>and</strong> aquatic organisms on theWest Fork Black River <strong>and</strong> tributaries Strother Creek,Neal Creek, <strong>and</strong> Bee Fork Creek (Figure 15.7) usingdata published in 1973 (Gale et al., 1973). We concludewith an assessment of conditions in this same areabased on sampling of water <strong>and</strong> sediments between2002 <strong>and</strong> 2005 (Brumbaugh et al., 2007).QUESTIONS 15, PART C1. Examine Figure 15.7 <strong>and</strong> Table 15.3. Sample sites 6, 9, 10,<strong>and</strong> 14 are in uncontaminated areas. What are the backgroundconcentrations of the following elements in surfacewater?Lead:Zinc:Copper:Manganese:2. In Figure 15.7 mark in red (or use a pattern [e.g., dots] thatyou identify in the explanation) the stream reaches thatexceed background concentrations of lead. Consider themost likely source of the lead as a guide in marking thestream reaches.5. On the basis of available data, would you expect backgroundconcentrations of the contamination in Creek A?Explain.3. In Figure 15.7 mark in green (or with a dash pattern) thestream reaches that exceed 0.011 ppm of zinc.6. Examine the Mn concentrations in aquatic organisms in4. What relationship appears to exist between settling basin Strother Creek as shown in Table 15.4.location <strong>and</strong> the quality of water in the stream?a. What general relationship is evident?
236 III. Introduction to <strong>Water</strong> <strong>Resource</strong>s <strong>and</strong> <strong>Contamination</strong>TABLE 15.3 Mean Concentrations of Lead, Zinc, Copper, <strong>and</strong> Manganese in <strong>Water</strong> in the New Lead BeltMean ConcentrationsSite Flow (cfs) Pb (ppm) Zn (ppm) Cu (ppm) Mn (ppm)1 11.22 .021 .034 .010 .0772 11.22 .011 .017 .010 .0493 - .010 .011 .011 .0124 5.80 .014 .069 .010 .0355 8.70 .090 .034 .011 .1276 4.10 .011 .010 .010 .0117 382.6 .014 .011 .010 .0218 33.8 .044 .011 .010 .0139 33.8 .011 .010 .010 .01310 9.22 .011 .010 .010 .01311 — .035 .140 .017 1.63712 — .033 .134 .012 1.69113 9.22 .030 .038 .010 .48814 6.75 .012 .010 .010 .02515 6.75 .019 .020 .018 .156TABLE 15.4 Mean Concentrations of Lead, Zinc, Copper, <strong>and</strong> Manganese in Aquatic Organisms of Strother CreekMean Concentrations (mg/g)Organism Miles Below Pond Pb Zn Cu MnSnails 0.2 16 54 57 1,7701.3 75 27 21 7102.8 44 18 16 59Crayfish 0.2 69 97 142 1951.3 24 92 130 7502.8 38 86 86 4104.2 28 94 97 485Tadpoles 0.2 36 210 26 5,6501.3 780 265 44 4,5602.8 310 210 26 6904.2 1,590 160 17 500b. Similar but less obvious trends exist for Pb, Zn, <strong>and</strong> Cu; b. How many times greater is the concentration of lead athowever, Pb in tadpoles exhibits the opposite trend. What the mine than 6.5 miles downstream <strong>from</strong> the mine?might account for this different trend?7. Examine Figure 15.8.a. What is the background concentration for lead inaquatic vegetation in the Bee Fork drainage basin?c. How many times greater is the value for lead at 6.5miles downstream than the apparent background level?
Exercise 15 • <strong>Groundwater</strong> <strong>and</strong> <strong>Surface</strong> <strong>Water</strong> <strong>Contamination</strong> <strong>from</strong> <strong>Resource</strong> Extraction 237FIGURE 15.8 Trace element concentrations (ppm) in aquatic vegetation along Bee Fork <strong>and</strong> tributary. New Lead Belt (Gale et al., 1973).8. The pollution load that a stream carries can be calculated ifthe stream discharge <strong>and</strong> the concentration of the specificcontaminants are known.Load (tons/day) = Q X C X 0.0027where Q = stream discharge (cfs), C = concentration ofspecific contaminant (mg/L), <strong>and</strong> 0.0027 = constant toconvert seconds <strong>and</strong> mg/L to days <strong>and</strong> tonsUsing the available data <strong>and</strong> the formula given above,calculate how many pounds per day of lead <strong>and</strong> manganesewere being transported past site 7 (Figure 15.7; refer toAppendix A for conversion of tons to pounds).9. What techniques might be used to reduce the contaminationof these streams in the New Lead Belt?10. Using the above information <strong>from</strong> the USGS studies thatbegan in 2000, briefly describe, in a bullet statement for each,the key findings or conclusions that you might make <strong>from</strong>this study of part of the New Lead Belt.Concern about potential degradation of water quality<strong>and</strong> aquatic biota of nearby federally protected streamsprompted a multidisciplinary study of the area that began in2000. The results of the sediment <strong>and</strong> surface water analyseson samples collected between 2002 <strong>and</strong> 2005 have been publishedby the USGS (Brumbaugh et al., 2007). That publicationis the source of much of the following environmentalinformation.The greatest concentrations in sediment collected in2002 were <strong>from</strong> sites downstream <strong>from</strong> mines on StrotherCreek <strong>and</strong> West Fork, with noticeable enrichment in lead insediments <strong>from</strong> Bee Fork. Compared to reference sites, sedimentsdownstream <strong>from</strong> mine areas were enriched "by factorsas large as 75 for cadmium, 62 for cobalt, 171 for nickel,95 for lead, <strong>and</strong> 150 for zinc."The impact of mining was recorded at least 75 kilometersdownstream in Clearwater Lake where metal concentrationswere 1.5-2.1 times greater than in sediments in an areaof the lake with no upstream mining. Sediment samples collectedin 2004 on West Fork showed "dramatically lower"concentrations of metals, which was attributed to the closingof a mill on West Fork.Concentrations of metals in surface water generallytracked those in sediments. <strong>Water</strong> samples <strong>from</strong> July 2005 onStrother Creek showed a "considerable increase in metalloadings" for a few days in which there was a moderateincrease in stream discharge.
238 III. Introduction to <strong>Water</strong> <strong>Resource</strong>s <strong>and</strong> <strong>Contamination</strong>11. Using the online resources (or the actual publications)<strong>from</strong> the USGS study on the New Lead Belt that began in2000, prepare two or three lab questions based on thosereports that would be suitable for use by your fellow students.Include the full reference, any diagrams or tables, <strong>and</strong>the questions. Also include the answers that you expect foreach of the questions. You can focus on either the geologicalor the biological data or use both. (The instructor mightmake this a take-home assignment, depending on availableresources <strong>and</strong> time, <strong>and</strong> possibly a group assignment. Select<strong>from</strong> suggested references below or others that you find thatmight be useful. Full references are in the Bibliography sectionof this manual.)Besser et al. 2006 http://www.springerlink.com/content/r4t8q457354847t0/; Brumbaugh et al., 2007 http:/ /pubs.usgs.gov/sir/2007/5057/, Schmitt et al., 2007a, 2007b.BibliographyBesser, J.M., Brumbaugh, W.G., May, T.W., <strong>and</strong> Schmitt, C.J.,2006, Biomonitoring of lead, zinc, <strong>and</strong> cadmium bystreams draining lead-mining <strong>and</strong> non-mining areas,southeast Missouri, USA: Environmental Monitoring <strong>and</strong>Assessment. Retrieved October 2006 <strong>from</strong> http://www.springerlink.com/content/r4t8q457354847t0/Boster, R. S., 1967, A study of ground-water contamination due tooil-field brines in Morrow <strong>and</strong> Delaware Counties, Ohio, withemphasis on detection utilizing electrical resistivity techniques,M.Sc. thesis: Columbus, OH, The Ohio State University,191 p.Brumbaugh, W.G., May, T.W., Besser, J.M., Allert, A.L.,Schmitt, C.J., 2007, Assessment of elemental concentrations instreams of the New Lead Belt in Southeastern Missouri,2002-05: U.S. Geological Survey Scientific InvestigationsReport 2007-5057, 57 p.Feth, J. H., 1973, <strong>Water</strong> facts <strong>and</strong> figures for planners <strong>and</strong> managers:U.S. Geological Survey Circular 601-1,30 p.Gale, N. L., Wixson, B. G., Hardie, M. G., <strong>and</strong> Jennett, J. C, 1973,Aquatic organisms <strong>and</strong> heavy metals in Missouri's NewLead Belt: <strong>Water</strong> <strong>Resource</strong>s Bulletin, v. 9, no. 4, p. 673-688.Pettyjohn, W. A., 1971, <strong>Water</strong> pollution by oil-field brines<strong>and</strong> related industrial wastes in Ohio: Ohio Journal of Science,v. 71, no. 5, p. 257-269.Pettyjohn, W. A., 1972, <strong>Water</strong> Quality in a Stressed Environment:Minneapolis, MN, Burgess, 309 p.Pettyjohn, W. A., 1973, Sources of chloride contamination inAlum Creek, Central Ohio: Columbus, OH, Ohio Departmentof Natural <strong>Resource</strong>s, 54 p.Reiten, Jon C, 2006, Oil-field brine plumes in shallow groundwater, Sheridan County, Montana: Sixteen years later:AAPG Rocky Mountain Section Annual Meeting, June11-13, 2006, Billings, Montana.Sassen, Douglas S., 2004, Oil-field-brine-induced colloidal dispersion:A case study <strong>from</strong> southeast Texas: GeologicalSociety of America Abstracts with Programs, vol. 36, no. 1, p. 24.Schmitt, C.J., Brumbaugh, W.G., <strong>and</strong> May. T.W., 2007a, Accumulationof metals in fish <strong>from</strong> lead-zinc mining areas ofsoutheastern Missouri, USA: Ecotoxicology <strong>and</strong> EnvironmentalSafety, v. 67, p. 14-30.Schmitt, C.J., Whyte, J.J., Roberts, A.P., Annis, M.L., <strong>and</strong>Tillitt, D.E., 2007b, Biomarkers of metals exposure in fish<strong>from</strong> lead-zinc mining in southeastern Missouri, USA:Ecotoxicology <strong>and</strong> Environmental Safety, v. 67, p. 31-47.Shaw, J. E., 1966, An investigation of ground-water contaminationby oil-field brine disposal in Morrow <strong>and</strong> Delaware Counties,Ohio, M.Sc. thesis: Columbus, OH, The Ohio StateUniversity, 127 p.