Groundwater and Surface Water Contamination from Resource ...
Groundwater and Surface Water Contamination from Resource ...
Groundwater and Surface Water Contamination from Resource ...

You also want an ePaper? Increase the reach of your titles
YUMPU automatically turns print PDFs into web optimized ePapers that Google loves.
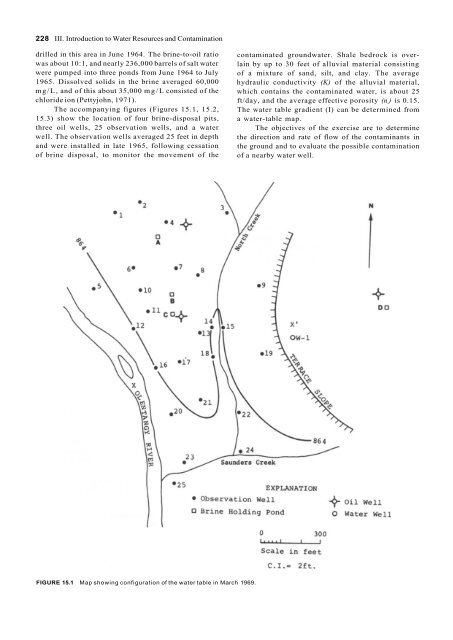
228 III. Introduction to <strong>Water</strong> <strong>Resource</strong>s <strong>and</strong> <strong>Contamination</strong>drilled in this area in June 1964. The brine-to-oil ratiowas about 10:1, <strong>and</strong> nearly 236,000 barrels of salt waterwere pumped into three ponds <strong>from</strong> June 1964 to July1965. Dissolved solids in the brine averaged 60,000mg/L, <strong>and</strong> of this about 35,000 mg/L consisted of thechloride ion (Pettyjohn, 1971).The accompanying figures (Figures 15.1, 15.2,15.3) show the location of four brine-disposal pits,three oil wells, 25 observation wells, <strong>and</strong> a waterwell. The observation wells averaged 25 feet in depth<strong>and</strong> were installed in late 1965, following cessationof brine disposal, to monitor the movement of thecontaminated groundwater. Shale bedrock is overlainby up to 30 feet of alluvial material consistingof a mixture of s<strong>and</strong>, silt, <strong>and</strong> clay. The averagehydraulic conductivity (K) of the alluvial material,which contains the contaminated water, is about 25ft/day, <strong>and</strong> the average effective porosity (n e) is 0.15.The water table gradient (I) can be determined <strong>from</strong>a water-table map.The objectives of the exercise are to determinethe direction <strong>and</strong> rate of flow of the contaminants inthe ground <strong>and</strong> to evaluate the possible contaminationof a nearby water well.FIGURE 15.1 Map showing configuration of the water table in March 1969.