BD FACS Canto II Quick Reference Guide
BD FACS Canto II Quick Reference Guide
BD FACS Canto II Quick Reference Guide

Create successful ePaper yourself
Turn your PDF publications into a flip-book with our unique Google optimized e-Paper software.
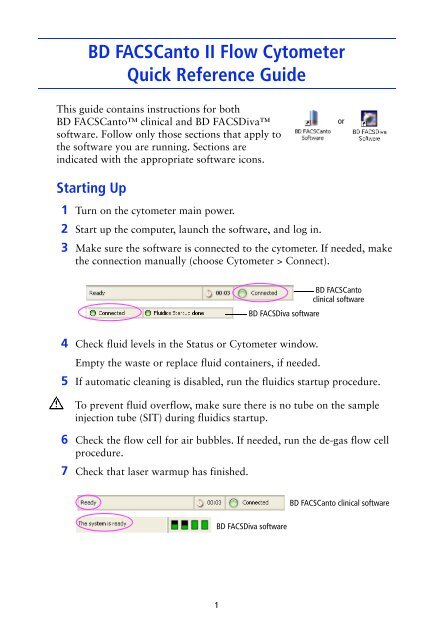
<strong>BD</strong> <strong>FACS</strong><strong>Canto</strong> <strong>II</strong> Flow Cytometer<strong>Quick</strong> <strong>Reference</strong> <strong>Guide</strong>This guide contains instructions for both<strong>BD</strong> <strong>FACS</strong><strong>Canto</strong> clinical and <strong>BD</strong> <strong>FACS</strong>Divasoftware. Follow only those sections that apply tothe software you are running. Sections areindicated with the appropriate software icons.orStarting Up1 Turn on the cytometer main power.2 Start up the computer, launch the software, and log in.3 Make sure the software is connected to the cytometer. If needed, makethe connection manually (choose Cytometer > Connect).<strong>BD</strong> <strong>FACS</strong>Diva software<strong>BD</strong> <strong>FACS</strong><strong>Canto</strong>clinical software4 Check fluid levels in the Status or Cytometer window.Empty the waste or replace fluid containers, if needed.5 If automatic cleaning is disabled, run the fluidics startup procedure.To prevent fluid overflow, make sure there is no tube on the sampleinjection tube (SIT) during fluidics startup.6 Check the flow cell for air bubbles. If needed, run the de-gas flow cellprocedure.7 Check that laser warmup has finished.<strong>BD</strong> <strong>FACS</strong><strong>Canto</strong> clinical software<strong>BD</strong> <strong>FACS</strong>Diva software1
Daily Setup: <strong>BD</strong> <strong>FACS</strong><strong>Canto</strong> Clinical SoftwareSet up the cytometer with <strong>BD</strong> <strong>FACS</strong><strong>Canto</strong> clinical software, even if you willoptimize and run samples using <strong>BD</strong> <strong>FACS</strong>Diva software.1 Prepare <strong>BD</strong> <strong>FACS</strong> 7-color setup beads.2 Run the cytometer setup procedure for the bead lot you prepared.Follow the Cytometer Setup Wizard to complete setup. Whenprompted, install the tube containing the setup beads, or the rackcontaining the beads tube and optimization samples.3 If you are running samples manually, unload the tube when prompted.• Hold the tube while moving the aspirator arm to the left.• Remove the tube from the SIT.• Release the aspirator arm and wait for cleaning to finish.4 (Optional) When setup is complete, view and print the Setup Report.5 Click to optimize the settings, or click .6 Review the Levey-Jennings report for trends in the setup data.Optimizing Cytometer Settings: <strong>BD</strong> <strong>FACS</strong><strong>Canto</strong> Clinical SoftwareBefore you record data for a sample, optimize the detector voltages,spectral overlap, and threshold settings for the sample type andfluorochrome to be run.1 Follow the prompts on the screen to proceed with optimization.• Click Yes to save results.• Choose the panel type and the X and Y parameters, and click.• If you are using the Loader for optimization, click .• Click at the Cytometer Setup Optimization screen.• If you are running tubes manually, install the first optimization tubewhen prompted, and click .• Click .2
2 Optimize settings, if needed.• To adjust the optimization gate, click , make theneeded adjustments, and then click .• To adjust detectors, thresholds, or spectral overlap settings, clickthe corresponding tab and use controls to adjust the settings.3 If there are more tubes for that panel type, click , and then.Otherwise, click, and then view and print the SetupReport for optimized settings.4 Click , remove the tube (if prompted), and then click .Optimizing Cytometer Settings: <strong>BD</strong> <strong>FACS</strong>Diva SoftwareBefore you record data for a sample, optimize the PMT voltages, compensation,and threshold settings for the sample type and fluorochrome.1 Verify the cytometer configuration.2 Create an experiment.3 Select the experiment-level settings, and change, add, or deleteparameters as needed.4 Apply setup results.• Right-click the experiment-level settings, and choose Apply fromCatalog.• Select a setup and click Apply.5 Create compensation controls. Click OK to remove the setup link.• If needed, edit labels for the compensation controls.6 Optimize cytometer settings using a mixed sample tube.• Set the current tube pointer to the unstained control tube, install thetube, and click .• Adjust FSC and SSC voltages, and the FSC threshold, if needed.• On the Unstained Control worksheet, adjust the P1 gate, and applygate changes to the remaining compensation controls.• Optimize voltages to place the positive population for eachfluorescent parameter on scale.• Click . Remove the mixed sample tube.3
7 Record data for the unstained control and for each single-stainedcontrol.8 Adjust the gates around the positive populations on the histogram foreach stained control tube.9 Calculate compensation, and name the resulting setup.Running Samples: <strong>BD</strong> <strong>FACS</strong><strong>Canto</strong> Clinical Software1 Prepare a worklist.2 Install the first sample tube (manual acquisition) or the Loader rack(automated acquisition), and click .3 When asked if you want to save the worklist, click No.4 (Loader option only) Click to run tubes manually.5 (Optional) To optimize settings during initial acquisition, click ,and then .Adjust settings, and clickto resume.6 For manual acquisition, remove the sample tube when prompted andinstall the next tube. Repeat until data for all tubes has been recorded.7 Inspect the lab report for each sample on the worklist.Double-click the Status field to see a sample’s report.Running Samples: <strong>BD</strong> <strong>FACS</strong>Diva Software1 Create a new specimen and tubes. Rename them appropriately.2 Create a global worksheet and rename it.3 Use the Experiment Layout dialog to define tube labels and keywords,and enter events to record.4 On the global worksheet, create appropriate plots for viewing dataduring acquisition.5 Install the first tube onto the cytometer. Acquire data for thecorresponding tube in the Browser.6 While data is being acquired, draw a gate around the population ofinterest. Set the other plots to show data from this population.7 Click . Remove the tube when recording is finished.8 Install the next tube.4
9 Repeat until data has been recorded for all tubes.Shutting Down: <strong>BD</strong> <strong>FACS</strong><strong>Canto</strong> Clinical Software1 Create a worklist with a two-tube panel. Enter Clean as the Sample ID.2 Click ; when asked to save the worklist, click No.3 (Loader option only) Click to run tubes manually.4 When prompted, install a tube containing ≤3 mL of <strong>BD</strong> <strong>FACS</strong>Cleansolution or 10% bleach.5 Click . Wait 5 minutes, and then click .6 When prompted, unload the tube.7 Install a tube with ≤3 mL of deionized water. Repeat steps 5 and 6.To prevent fluid overflow, do not leave a tube on the SIT during fluidicsshutdown.8 Choose File > Exit, and select Run fluidics shutdown and exit.9 When fluidics shutdown completes, turn off the power.Shutting Down: <strong>BD</strong> <strong>FACS</strong>Diva Software1 Install a tube with ≤3 mL of <strong>BD</strong> <strong>FACS</strong>Clean solution or 10% bleach,and click .2 After 5 minutes, click and remove the tube.3 Repeat steps 1 and 2 with DI water.4 Run fluidics shutdown.To prevent fluid overflow, do not leave a tube on the SIT during fluidicsshutdown.5 Turn off the cytometer main power.5
<strong>BD</strong> <strong>FACS</strong><strong>Canto</strong> Clinical Software ToolbarsStandard toolbarWorklist toolbarLogout New Acq.WorklistNew Anal.WorklistOpen Save Print Run Pause Stop Skip Stop OptimizeWorklistRecording<strong>BD</strong> <strong>FACS</strong>Diva Software ToolbarsBrowserWorkspace toolbarCytometer Worksheet Biexp. EditorNew ExptBrowser toolbarNew TubeNew GlobalWorksheetNumberof WellsSavePlate Inspector Acq. DashboardNew FolderNew SpecimenNew Cytom New PlateSettingsWorksheet toolbarWorksheetsViewSave as PDFDotPlotHistogramZoomOutDecreasePlot SizeSnap-ToGateRectangleGateIntervalGateSnap-ToIntervalGatePrintSelectContourPlotZoomInIncreasePlot SizeAutopolygonGatePolygonGateQuadrantGateAutointervalGateArrowTextAlignRightAlignBottomDistributeVerticallyShowGridLineAlignLeftAlignTopDistributeHorizontallyMakeSameSizeSnap-ToGridIVDFor In Vitro Diagnostic Usebdbiosciences.com<strong>BD</strong> Biosciences2350 Qume DriveSan Jose, CA 95131-1807USATel (800) 325-9637Fax (408) 954-2347facservice@bd.comECREPBENEX LimitedBay K 1 a/dShannon Industrial EstateShannon, County ClareIrelandTel (353) 61-472920Fax (353) 61-472546CanadaToll Free (888) 259-0187Tel (905) 542-8028Fax (888) 229-9918canada@bd.comJapanNippon Becton DickinsonCompany, Ltd.Toll Free 0120-8555-90Tel 81-24-593-5405Fax 81-24-593-5761Asia PacificTel (65) 6-861-0633Fax (65) 6-860-1590BrazilTel (55) 11-5185-9995Fax (55) 11-5185-9895<strong>BD</strong>, <strong>BD</strong> logo, and all other trademarks are property of Becton, Dickinson and Company.© 2007 <strong>BD</strong>EuropeTel (32) 2 400 98 95Fax (32) 2 401 70 94help.biosciences@europe.bd.comMexicoToll Free 01-800-236-2543Tel (52) 55-5999-8296Fax (52) 55-5999-8288642238