A network analysis of plant–pollinator interactions in temperate rain ...
A network analysis of plant–pollinator interactions in temperate rain ...
A network analysis of plant–pollinator interactions in temperate rain ...

Create successful ePaper yourself
Turn your PDF publications into a flip-book with our unique Google optimized e-Paper software.
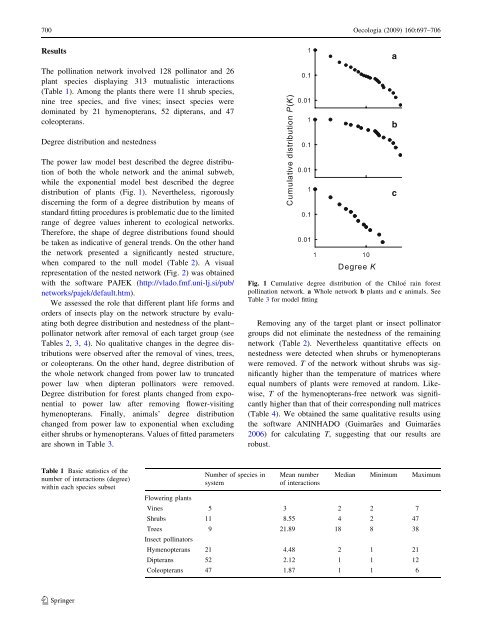
700 Oecologia (2009) 160:697–706ResultsThe poll<strong>in</strong>ation <strong>network</strong> <strong>in</strong>volved 128 poll<strong>in</strong>ator and 26plant species display<strong>in</strong>g 313 mutualistic <strong><strong>in</strong>teractions</strong>(Table 1). Among the plants there were 11 shrub species,n<strong>in</strong>e tree species, and five v<strong>in</strong>es; <strong>in</strong>sect species weredom<strong>in</strong>ated by 21 hymenopterans, 52 dipterans, and 47coleopterans.abDegree distribution and nestednessThe power law model best described the degree distribution<strong>of</strong> both the whole <strong>network</strong> and the animal subweb,while the exponential model best described the degreedistribution <strong>of</strong> plants (Fig. 1). Nevertheless, rigorouslydiscern<strong>in</strong>g the form <strong>of</strong> a degree distribution by means <strong>of</strong>standard fitt<strong>in</strong>g procedures is problematic due to the limitedrange <strong>of</strong> degree values <strong>in</strong>herent to ecological <strong>network</strong>s.Therefore, the shape <strong>of</strong> degree distributions found shouldbe taken as <strong>in</strong>dicative <strong>of</strong> general trends. On the other handthe <strong>network</strong> presented a significantly nested structure,when compared to the null model (Table 2). A visualrepresentation <strong>of</strong> the nested <strong>network</strong> (Fig. 2) was obta<strong>in</strong>edwith the s<strong>of</strong>tware PAJEK (http://vlado.fmf.uni-lj.si/pub/<strong>network</strong>s/pajek/default.htm).We assessed the role that different plant life forms andorders <strong>of</strong> <strong>in</strong>sects play on the <strong>network</strong> structure by evaluat<strong>in</strong>gboth degree distribution and nestedness <strong>of</strong> the <strong>plant–poll<strong>in</strong>ator</strong> <strong>network</strong> after removal <strong>of</strong> each target group (seeTables 2, 3, 4). No qualitative changes <strong>in</strong> the degree distributionswere observed after the removal <strong>of</strong> v<strong>in</strong>es, trees,or coleopterans. On the other hand, degree distribution <strong>of</strong>the whole <strong>network</strong> changed from power law to truncatedpower law when dipteran poll<strong>in</strong>ators were removed.Degree distribution for forest plants changed from exponentialto power law after remov<strong>in</strong>g flower-visit<strong>in</strong>ghymenopterans. F<strong>in</strong>ally, animals’ degree distributionchanged from power law to exponential when exclud<strong>in</strong>geither shrubs or hymenopterans. Values <strong>of</strong> fitted parametersare shown <strong>in</strong> Table 3.Fig. 1 Cumulative degree distribution <strong>of</strong> the Chiloé ra<strong>in</strong> forestpoll<strong>in</strong>ation <strong>network</strong>. a Whole <strong>network</strong> b plants and c animals. SeeTable 3 for model fitt<strong>in</strong>gRemov<strong>in</strong>g any <strong>of</strong> the target plant or <strong>in</strong>sect poll<strong>in</strong>atorgroups did not elim<strong>in</strong>ate the nestedness <strong>of</strong> the rema<strong>in</strong><strong>in</strong>g<strong>network</strong> (Table 2). Nevertheless quantitative effects onnestedness were detected when shrubs or hymenopteranswere removed. T <strong>of</strong> the <strong>network</strong> without shrubs was significantlyhigher than the temperature <strong>of</strong> matrices whereequal numbers <strong>of</strong> plants were removed at random. Likewise,T <strong>of</strong> the hymenopterans-free <strong>network</strong> was significantlyhigher than that <strong>of</strong> their correspond<strong>in</strong>g null matrices(Table 4). We obta<strong>in</strong>ed the same qualitative results us<strong>in</strong>gthe s<strong>of</strong>tware ANINHADO (Guimarães and Guimarães2006) for calculat<strong>in</strong>g T, suggest<strong>in</strong>g that our results arerobust.cTable 1 Basic statistics <strong>of</strong> thenumber <strong>of</strong> <strong><strong>in</strong>teractions</strong> (degree)with<strong>in</strong> each species subsetNumber <strong>of</strong> species <strong>in</strong>systemMean number<strong>of</strong> <strong><strong>in</strong>teractions</strong>Median M<strong>in</strong>imum MaximumFlower<strong>in</strong>g plantsV<strong>in</strong>es 5 3 2 2 7Shrubs 11 8.55 4 2 47Trees 9 21.89 18 8 38Insect poll<strong>in</strong>atorsHymenopterans 21 4.48 2 1 21Dipterans 52 2.12 1 1 12Coleopterans 47 1.87 1 1 6123