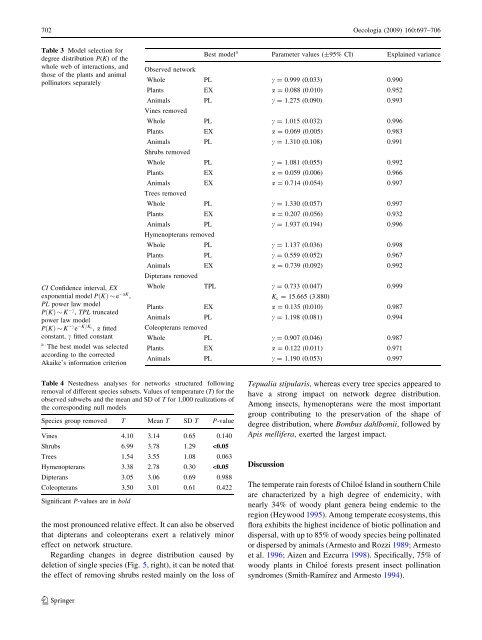
702 Oecologia (2009) 160:697–706Table 3 Model selection fordegree distribution P(K) <strong>of</strong> thewhole web <strong>of</strong> <strong><strong>in</strong>teractions</strong>, andthose <strong>of</strong> the plants and animalpoll<strong>in</strong>ators separatelyCI Confidence <strong>in</strong>terval, EXexponential model PK ð Þe aK ,PL power law modelPK ð ÞK c , TPL truncatedpower law modelPK ð ÞK c e K=Kc , a fittedconstant, c fitted constanta The best model was selectedaccord<strong>in</strong>g to the correctedAkaike’s <strong>in</strong>formation criterionBest model a Parameter values (±95% CI) Expla<strong>in</strong>ed varianceObserved <strong>network</strong>Whole PL c = 0.999 (0.033) 0.990Plants EX a = 0.088 (0.010) 0.952Animals PL c = 1.275 (0.090) 0.993V<strong>in</strong>es removedWhole PL c = 1.015 (0.032) 0.996Plants EX a = 0.069 (0.005) 0.983Animals PL c = 1.310 (0.108) 0.991Shrubs removedWhole PL c = 1.081 (0.055) 0.992Plants EX a = 0.059 (0.006) 0.966Animals EX a = 0.714 (0.054) 0.997Trees removedWhole PL c = 1.330 (0.057) 0.997Plants EX a = 0.207 (0.056) 0.932Animals PL c = 1.937 (0.194) 0.996Hymenopterans removedWhole PL c = 1.137 (0.036) 0.998Plants PL c = 0.559 (0.052) 0.967Animals EX a = 0.739 (0.092) 0.992Dipterans removedWhole TPL c = 0.733 (0.047) 0.999K c = 15.665 (3.880)Plants EX a = 0.135 (0.010) 0.987Animals PL c = 1.198 (0.081) 0.994Coleopterans removedWhole PL c = 0.907 (0.046) 0.987Plants EX a = 0.122 (0.011) 0.971Animals PL c = 1.190 (0.053) 0.997Table 4 Nestedness analyses for <strong>network</strong>s structured follow<strong>in</strong>gremoval <strong>of</strong> different species subsets. Values <strong>of</strong> temperature (T) for theobserved subwebs and the mean and SD <strong>of</strong> T for 1,000 realizations <strong>of</strong>the correspond<strong>in</strong>g null modelsSpecies group removed T Mean T SD T P-valueV<strong>in</strong>es 4.10 3.14 0.65 0.140Shrubs 6.99 3.78 1.29
Oecologia (2009) 160:697–706 703adadbebecfcfFig. 3 Outcome <strong>of</strong> model simulations after remov<strong>in</strong>g v<strong>in</strong>es (V),shrubs (S) or trees (T) from the poll<strong>in</strong>ation web <strong>of</strong> Chiloé ra<strong>in</strong> forest.Bars show the fraction <strong>of</strong> ext<strong>in</strong>ct species for plants (a–c) andpoll<strong>in</strong>ators (d–f) for vary<strong>in</strong>g levels <strong>of</strong> k after 3,000 time iterations(mean <strong>of</strong> 1,000 realizations ±95% confidence <strong>in</strong>terval). Hatched barWhole <strong>network</strong>, black bars <strong>network</strong>s after species removal, whitebars null models. a–f Results for different values <strong>of</strong> ext<strong>in</strong>ction/colonization ratio k. *Significant differences with respect to theunmanipulated <strong>network</strong> P, ::significant differences with respect to thecorrespond<strong>in</strong>g null modelThe conservation <strong>of</strong> austral South American <strong>temperate</strong>forests constitutes a global priority (D<strong>in</strong>erste<strong>in</strong> et al. 1995;Arroyo and H<strong>of</strong>fman 1997; Armesto et al. 1998; Myerset al. 2000). Despite their importance, the biologicaldiversity <strong>of</strong> Chiloé ra<strong>in</strong> forests cont<strong>in</strong>ues to be threatenedby anthropogenic disturbances such as fire, logg<strong>in</strong>g, cattlegraz<strong>in</strong>g, forest fragmentation and land conversion foragriculture (Figueroa et al. 1996; Newton 2007). Becausethe ma<strong>in</strong>tenance and recovery <strong>of</strong> these forests largelydepend on animal poll<strong>in</strong>ation and seed dispersal services,the understand<strong>in</strong>g <strong>of</strong> animal–plant mutualistic <strong>in</strong>teraction isa must for acquir<strong>in</strong>g a comprehensive knowledge about thestructure and function<strong>in</strong>g <strong>of</strong> these ecosystems, as well asfor develop<strong>in</strong>g management and conservation guidel<strong>in</strong>es(Armesto et al. 1996). Unfortunately, few studies <strong>in</strong> theseaustral <strong>temperate</strong> ra<strong>in</strong> forests have exam<strong>in</strong>ed <strong>in</strong>sect–plant<strong><strong>in</strong>teractions</strong>, <strong>in</strong>clud<strong>in</strong>g poll<strong>in</strong>ation (Aizen et al. 2002). Theworks <strong>of</strong> Riveros et al. (1991), Aizen et al. (2002), andSmith-Ramírez et al. (2005) on austral ra<strong>in</strong> forests,revealed that <strong>in</strong>sect poll<strong>in</strong>ators are far more diverse thanpreviously thought, and that the pattern <strong>of</strong> mutualisticFig. 4 Outcome <strong>of</strong> model simulations after remov<strong>in</strong>g hymenopterans(H), dipterans (D) and coleopterans (C). Bars show the fraction <strong>of</strong>ext<strong>in</strong>ct species for plants (a–c) and poll<strong>in</strong>ators (d–f) for vary<strong>in</strong>g levels<strong>of</strong> k after 3,000 time iterations (mean <strong>of</strong> 1,000 realizations ±95%confidence <strong>in</strong>terval). Hatched bar Whole <strong>network</strong>, black bars<strong>network</strong>s after species removal, white bars null models. *Significantdifferences with respect to the unmanipulated <strong>network</strong> P, ::significantdifferences with respect to the correspond<strong>in</strong>g null model. a–f Resultsfor different values <strong>of</strong> ext<strong>in</strong>ction/colonization ratio k<strong><strong>in</strong>teractions</strong> is highly asymmetric, with a few species <strong>of</strong>plants monopoliz<strong>in</strong>g a large fraction <strong>of</strong> poll<strong>in</strong>ators and afew generalist <strong>in</strong>sect poll<strong>in</strong>ators visit<strong>in</strong>g a large fraction <strong>of</strong>flower<strong>in</strong>g plant species.The <strong>temperate</strong> ra<strong>in</strong> forest poll<strong>in</strong>ation <strong>network</strong> exhibiteda nested structure <strong>of</strong> plant–animal <strong><strong>in</strong>teractions</strong>, whichmeans that <strong><strong>in</strong>teractions</strong> <strong>of</strong> the less connected speciescomprise a subset <strong>of</strong> the <strong><strong>in</strong>teractions</strong> <strong>of</strong> the more connectedones. On the other hand, while generalist species are l<strong>in</strong>kedwith both specialists and generalist species, specialists arepredom<strong>in</strong>antly l<strong>in</strong>ked with generalists. The underly<strong>in</strong>gbiological processes beh<strong>in</strong>d the structure <strong>of</strong> mutualistic<strong>network</strong>s are still poorly understood, but recent advancessuggest that nestedness is a pattern that may arise as aconsequence <strong>of</strong> the simultaneous development <strong>of</strong> phenotypiccomplementarity between plants and poll<strong>in</strong>ators andfloral traits act<strong>in</strong>g as barriers aga<strong>in</strong>st parasites (Santamaríaand Rodríguez-Gironés 2007; see also its ensu<strong>in</strong>g discussion).A nested pattern implies the existence <strong>of</strong> asymmetricspecialization (Vázquez and Aizen 2004) and it is related toasymmetries <strong>in</strong> dependence levels between plants and theirpoll<strong>in</strong>ators (Bascompte et al. 2006). The nested pattern <strong>of</strong>123