Encoding and Decoding Touch-Tone Signals
Encoding and Decoding Touch-Tone Signals
Encoding and Decoding Touch-Tone Signals

You also want an ePaper? Increase the reach of your titles
YUMPU automatically turns print PDFs into web optimized ePapers that Google loves.
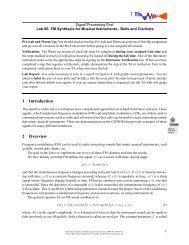
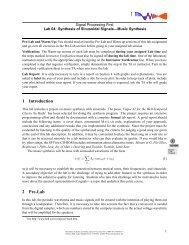
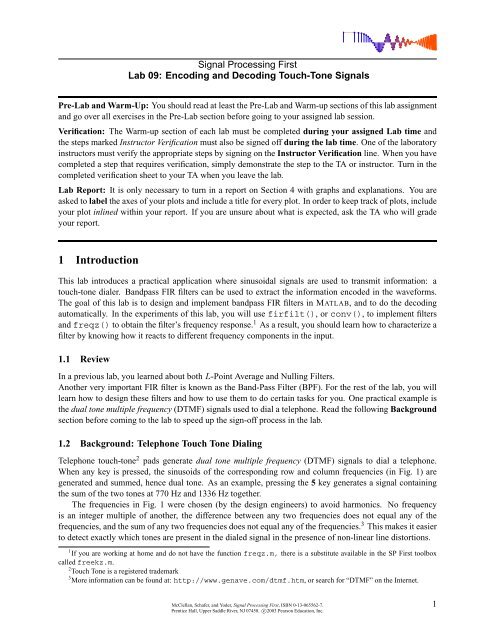
Signal Processing FirstLab 09: <strong>Encoding</strong> <strong>and</strong> <strong>Decoding</strong> <strong>Touch</strong>-<strong>Tone</strong> <strong>Signals</strong>Pre-Lab <strong>and</strong> Warm-Up: You should read at least the Pre-Lab <strong>and</strong> Warm-up sections of this lab assignment<strong>and</strong> go over all exercises in the Pre-Lab section before going to your assigned lab session.Verification: The Warm-up section of each lab must be completed during your assigned Lab time <strong>and</strong>the steps marked Instructor Verification must also be signed off during the lab time. One of the laboratoryinstructors must verify the appropriate steps by signing on the Instructor Verification line. When you havecompleted a step that requires verification, simply demonstrate the step to the TA or instructor. Turn in thecompleted verification sheet to your TA when you leave the lab.Lab Report: It is only necessary to turn in a report on Section 4 with graphs <strong>and</strong> explanations. You areasked to label the axes of your plots <strong>and</strong> include a title for every plot. In order to keep track of plots, includeyour plot inlined within your report. If you are unsure about what is expected, ask the TA who will gradeyour report.1 IntroductionThis lab introduces a practical application where sinusoidal signals are used to transmit information: atouch-tone dialer. B<strong>and</strong>pass FIR filters can be used to extract the information encoded in the waveforms.The goal of this lab is to design <strong>and</strong> implement b<strong>and</strong>pass FIR filters in MATLAB, <strong>and</strong> to do the decodingautomatically. In the experiments of this lab, you will use firfilt(), or conv(), to implement filters<strong>and</strong> freqz() to obtain the filter’s frequency response. 1 As a result, you should learn how to characterize afilter by knowing how it reacts to different frequency components in the input.1.1 ReviewIn a previous lab, you learned about both L-Point Average <strong>and</strong> Nulling Filters.Another very important FIR filter is known as the B<strong>and</strong>-Pass Filter (BPF). For the rest of the lab, you willlearn how to design these filters <strong>and</strong> how to use them to do certain tasks for you. One practical example isthe dual tone multiple frequency (DTMF) signals used to dial a telephone. Read the following Backgroundsection before coming to the lab to speed up the sign-off process in the lab.1.2 Background: Telephone <strong>Touch</strong> <strong>Tone</strong> DialingTelephone touch-tone 2 pads generate dual tone multiple frequency (DTMF) signals to dial a telephone.When any key is pressed, the sinusoids of the corresponding row <strong>and</strong> column frequencies (in Fig. 1) aregenerated <strong>and</strong> summed, hence dual tone. As an example, pressing the 5 key generates a signal containingthe sum of the two tones at 770 Hz <strong>and</strong> 1336 Hz together.The frequencies in Fig. 1 were chosen (by the design engineers) to avoid harmonics. No frequencyis an integer multiple of another, the difference between any two frequencies does not equal any of thefrequencies, <strong>and</strong> the sum of any two frequencies does not equal any of the frequencies. 3 This makes it easierto detect exactly which tones are present in the dialed signal in the presence of non-linear line distortions.1 If you are working at home <strong>and</strong> do not have the function freqz.m, there is a substitute available in the SP First toolboxcalled freekz.m.2 <strong>Touch</strong> <strong>Tone</strong> is a registered trademark3 More information can be found at: http://www.genave.com/dtmf.htm, or search for “DTMF” on the Internet.McClellan, Schafer, <strong>and</strong> Yoder, Signal Processing First, ISBN 0-13-065562-7.Prentice Hall, Upper Saddle River, NJ 07458. c○2003 Pearson Education, Inc.1
FREQS 1209 Hz 1336 Hz 1477 Hz 1633 Hz697 Hz 1 2 3 A770 Hz 4 5 6 B852 Hz 7 8 9 C941 Hz * 0 # DFigure 1: Extended DTMF encoding table for <strong>Touch</strong> <strong>Tone</strong> dialing. When any key is pressed the tones ofthe corresponding column <strong>and</strong> row are generated <strong>and</strong> summed. Keys A-D (in the fourth column) are notimplemented on commercial <strong>and</strong> household telephone sets, but are used in some military <strong>and</strong> other signalingapplications.1.3 DTMF <strong>Decoding</strong>There are several steps to decoding a DTMF signal:1. Divide the time signal into short time segments representing individual key presses.2. Filter the individual segments to extract the possible frequency components. B<strong>and</strong>pass filters can beused to isolate the sinusoidal components.3. Determine which two frequency components are present in each time segment by measuring the sizeof the output signal from all of the b<strong>and</strong>pass filters.4. Determine which key was pressed, 0–9, A–D, *, or # by converting frequency pairs back into keynames according to Fig. 1.It is possible to decode DTMF signals using a simple FIR filter bank. The filter bank in Fig. 2 consistsof eight b<strong>and</strong>pass filters which each pass only one of the eight possible DTMF frequencies. The input signalfor all the filters is the same DTMF signal.✲697 Hz✲ y 1 [n]✲770 Hz✲ y 2 [n]x[n]✲✲852 Hz❜❜❜✲ y 3 [n]✲1477 Hz✲ y 6 [n]✲1633 Hz✲ y 7 [n]Figure 2: Filter bank consisting of b<strong>and</strong>pass filters (BPFs) which pass frequencies corresponding to the eightDTMF component frequencies listed in Fig. 1. The number is each box is the center frequency of the BPF.McClellan, Schafer, <strong>and</strong> Yoder, Signal Processing First, ISBN 0-13-065562-7.Prentice Hall, Upper Saddle River, NJ 07458. c○2003 Pearson Education, Inc.2
Here is how the system should work: When the input to the filter bank is a DTMF signal, the outputsfrom two of the b<strong>and</strong>pass filters (BPFs) should be larger than the rest. If we detect (or measure) which twooutputs are the large ones, then we know the two corresponding frequencies. These frequencies are thenused as row <strong>and</strong> column pointers to determine the key from the DTMF code. A good measure of the outputlevels is the peak value at the filter outputs, because when the BPF is working properly it should pass onlyone sinusoidal signal <strong>and</strong> the peak value would be the amplitude of the sinusoid passed by the filter. Morediscussion of the detection problem can be found in Section 4.2 Pre-Lab2.1 Signal ConcatenationIn a previous lab, a very long music signal was created by joining together many sinusoids. When twosignals were played one after the other, the composite signal was created by the operation of concatenation.In MATLAB, this can be done by making each signal a row vector, <strong>and</strong> then using the matrix buildingnotation as follows:xx = [ xx, xxnew ];where xxnew is the sub-signal being appended. The length of the new signal is equal to the sum of thelengths of the two signals xx <strong>and</strong> xxnew. A third signal could be added later on by concatenating it to xx.2.1.1 Comment on EfficiencyIn MATLAB the concatenation method, xx = [ xx, xxnew ], would append the signal vector xxnewto the existing signal xx. However, this becomes an inefficient procedure if the signal length gets to be verylarge. The reason is that MATLAB must re-allocate the memory space for xx every time a new sub-signalis appended via concatenation. If the length xx were being extended from 400,000 to 401,000, then a cleansection of memory consisting of 401,000 elements would have to be allocated followed by a copy of theexisting 400,000 signal elements <strong>and</strong> finally the append would be done. This is clearly inefficient, but wouldnot be noticed for short signals.An alternative is to pre-allocate storage for the complete signal vector, but this can only be done if thefinal signal length is known ahead of time.2.1.2 <strong>Encoding</strong> from a TableExplain how the following program uses frequency information stored in a table to generate a long signalvia concatenation. Determine the size of the table <strong>and</strong> all of its entries, <strong>and</strong> then state the playing order of thefrequencies. Determine the total length of the signal played by the soundsc function. How many samples<strong>and</strong> how many seconds?ftable = [1;2;3;4;5]*[80,110]fs = 8000;xx = [ ];disp(’--- Here we go through the Loop ---’)keys = rem(3:12,10) + 1;for ii = 1:length(keys)kk = keys(ii);xx = [xx,zeros(1,400)];krow = ceil(kk/2);kcol = rem(kk-1,2) + 1;xx = [xx, cos(2*pi*ftable(krow,kcol)*(0:1199)/fs) ];McClellan, Schafer, <strong>and</strong> Yoder, Signal Processing First, ISBN 0-13-065562-7.Prentice Hall, Upper Saddle River, NJ 07458. c○2003 Pearson Education, Inc.3
endsoundsc(xx,fs);2.2 Overlay PlottingSometimes it is convenient to overlay information onto an existing MATLAB plot. The MATLAB comm<strong>and</strong>hold on will inhibit the figure erase that is usually done just before a new plot. Demonstrate that youcan do an overlay by following these instructions:(a) Plot the magnitude response of the 5-point averager, created fromHH=freqz(ones(1,5)/5,1,ww)Make sure that the horizontal frequency axis extends from −π to +π.(b) Use the stem function to place vertical markers at the zeros of the frequency response.hold on, stem(2*pi/5*[-2,-1,1,2],0.3*ones(1,4),’r.’), hold off3 Warm-up: DTMF Synthesis3.1 DTMF Dial FunctionWrite a function, dtmfdial.m, to implement a DTMF dialer based on the frequency table defined inFig. 1. A skeleton of dtmfdial.m is given in Fig. 3. In this warm-up, you must complete the dialing codefunction xx = dtmfdial(keyNames,fs)%DTMFDIAL Create a signal vector of tones which will dial% a DTMF (<strong>Touch</strong> <strong>Tone</strong>) telephone system.%% usage: xx = dtmfdial(keyNames,fs)% keyNames = vector of characters containing valid key names% fs = sampling frequency% xx = signal vector that is the concatenation of DTMF tones.%dtmf.keys = ...[’1’,’2’,’3’,’A’;’4’,’5’,’6’,’B’;’7’,’8’,’9’,’C’;’*’,’0’,’#’,’D’];dtmf.col<strong>Tone</strong>s = ones(4,1)*[1209,1336,1477,1633];dtmf.row<strong>Tone</strong>s = [697;770;852;941]*ones(1,4);Figure 3: Skeleton of dtmfdial.m, a DTMF phone dialer. Complete this function with additional lines ofcode.so that it implements the following:1. The input to the function is a vector of characters, each one being equal to one of the key names onthe telephone. The MATLAB structure called dtmf contains the key names in the field dtmf.keyswhich is a 4 × 4 array that corresponds exactly to the keyboard layout in Fig. 1.McClellan, Schafer, <strong>and</strong> Yoder, Signal Processing First, ISBN 0-13-065562-7.Prentice Hall, Upper Saddle River, NJ 07458. c○2003 Pearson Education, Inc.4
2. The output should be a vector of samples with sampling rate f s = 8000 Hz containing the DTMFtones, one tone pair per key. Remember that each DTMF signal is the sum of a pair of (equal amplitude)sinusoidal signals. The duration of each tone pair should be exactly 0.20 sec., <strong>and</strong> a silence,about 0.05 sec. long, should separate the DTMF tone pairs. These times can be declared as fixed codein dtmfdial. (You do not need to make them variable in your function.)3. The frequency information is given as two 4×4 matrices (dtmf.col<strong>Tone</strong>s <strong>and</strong> dtmf.row<strong>Tone</strong>s):one contains the column frequencies, the other has the row frequencies. You can translate a key suchas the 6 key into the correct location in these 4 × 4 matrices by using MATLAB’s find function. Forexample, the key 6 is in row 2 <strong>and</strong> column 3, so we would generate sinusoids with frequencies equalto dtmf.col<strong>Tone</strong>s(2,3) <strong>and</strong> dtmf.row<strong>Tone</strong>s(2,3).To convert an key name to its corresponding row-column indices, consider the following example:[ii,jj] = find(’3’==dtmf.keys)Also, consult the MATLAB code in Section 2.1 above <strong>and</strong> modify it for the 4×4 tables in dtmfdial.m.4. You should implement error checking so that an illegitimate key name is rejected.Your function should create the appropriate tone sequence to dial an arbitrary phone number. When playedthrough a telephone h<strong>and</strong>set, the output of your function will be able to dial the phone. You could usespecgram to check your work. 4Instructor Verification (separate page)3.2 Simple B<strong>and</strong>pass Filter DesignThe L-point averaging filter is a lowpass filter. Its passb<strong>and</strong> width is controlled by L, being inverselyproportional to L. It is also possible to create a filter whose passb<strong>and</strong> is centered around some frequencyother than zero. One simple way to do this is to define the impulse response of an L-point FIR as:h[n] = β cos (ˆω c n),0 ≤ n < Lwhere L is the filter length, <strong>and</strong> ˆω c is the center frequency that defines the frequency location of the passb<strong>and</strong>.For example, we pick ˆω c = 0.2π if we want the peak of the filter’s passb<strong>and</strong> to be centered at 0.2π. Also,it is possible to choose β so that the maximum value of the frequency response magnitude will be one. Theb<strong>and</strong>width of the b<strong>and</strong>pass filter is controlled by L; the larger the value of L, the narrower the b<strong>and</strong>width.This particular filter is also discussed in the section on useful filters in Chapter 7 of SP First .(a) Generate a b<strong>and</strong>pass filter that will pass a frequency component at ˆω = 0.2π. Make the filter length(L) equal to 51. Figure out the value of β so that the maximum value of the frequency responsemagnitude will be one. Make a plot of the frequency response magnitude <strong>and</strong> phase.Hint: use MATLAB’s freqz() function to calculate these values.(b) The passb<strong>and</strong> of the BPF filter is defined by the region of the frequency response where |H(e j ˆω )|is close to its maximum value of one. Typically, the passb<strong>and</strong> width is defined as the length of thefrequency region where |H(e j ˆω )| is greater than 1/ √ 2 = 0.707. Note: you can use MATLAB’sfind function to locate those frequencies where the magnitude satisfies |H(e j ˆω )| ≥ 0.707 (similarto Fig. 4).4 In MATLAB the demo called phone also shows the waveforms <strong>and</strong> spectra generated in a DTMF system.McClellan, Schafer, <strong>and</strong> Yoder, Signal Processing First, ISBN 0-13-065562-7.Prentice Hall, Upper Saddle River, NJ 07458. c○2003 Pearson Education, Inc.5
Magnitude10.80.60.4STOPBAND0.2BANDPASS FILTER (centered at 0.4π)PASSBANDSTOPBAND00 0.5 1 1.5 2 2.5 3Frequency (radians)Figure 4: The frequency response of an FIR b<strong>and</strong>pass is shown with its passb<strong>and</strong> <strong>and</strong> stopb<strong>and</strong> regions.Use the plot of the frequency response for the length-51 b<strong>and</strong>pass filter from part (a) to determine thepassb<strong>and</strong> width.Instructor Verification (separate page)(c) If the sampling rate is f s = 8000 Hz, determine the analog frequency components that will be passedby this b<strong>and</strong>pass filter. Use the passb<strong>and</strong> width <strong>and</strong> also the center frequency of the BPF to make thiscalculation.Instructor Verification (separate page)4 Lab Exercises: DTMF <strong>Decoding</strong>A DTMF decoding system needs two pieces: a set of b<strong>and</strong>pass filters (BPF) to isolate individual frequencycomponents, <strong>and</strong> a detector to determine whether or not a given component is present. The detector must“score” each BPF output <strong>and</strong> determine which two frequencies are most likely to be contained in the DTMFtone. In a practical system where noise <strong>and</strong> interference are also present, this scoring process is a crucialpart of the system design, but we will only work with noise-free signals to underst<strong>and</strong> the basic functionalityin the decoding system.To make the whole system work, you will have to write three M-files: dtmfrun, dtmfscore <strong>and</strong>dtmfdesign. An additional M-file called dtmfcut can be downloaded from the ‘MATLAB Files’link. The main M-file should be named dtmfrun.m. It will call dtmfdesign.m, dtmfcut.m, <strong>and</strong>dtmfscore.m. The following sections discuss how to create or complete these functions.4.1 Simple B<strong>and</strong>pass Filter Design: dtmfdesign.mThe FIR filters that will be used in the filter bank (Fig. 2) are a simple type constructed with sinusoidalimpulse responses, as already shown in the Warm-up. In the section on useful filters in Chapter 7, a simpleb<strong>and</strong>pass filter design method is presented in which the impulse response of the FIR filter is simply a finitelengthcosine of the form:( ) 2πfb nh[n] = β cos , 0 ≤ n ≤ L−1f s♥❦❤CD-ROMdtmfcut.mMcClellan, Schafer, <strong>and</strong> Yoder, Signal Processing First, ISBN 0-13-065562-7.Prentice Hall, Upper Saddle River, NJ 07458. c○2003 Pearson Education, Inc.6
where L is the filter length, <strong>and</strong> f s is the sampling frequency. The constant β gives flexibility for scalingthe filter’s gain to meet a constraint such as making the maximum value of the frequency response equal toone. The parameter f b defines the frequency location of the passb<strong>and</strong>, e.g., we pick f b = 852 if we want toisolate the 852 Hz component. The b<strong>and</strong>width of the b<strong>and</strong>pass filter is controlled by L; the larger the valueof L, the narrower the b<strong>and</strong>width.function hh = dtmfdesign(fb, L, fs)%DTMFDESIGN% hh = dtmfdesign(fb, L, fs)% returns a matrix (L by length(fb)) where each column contains% the impulse response of a BPF, one for each frequency in fb% fb = vector of center frequencies% L = length of FIR b<strong>and</strong>pass filters% fs = sampling freq%% Each BPF must be scaled so that its frequency response has a% maximum magnitude equal to one.Figure 5: Skeleton of the dtmfdesign.m function. Complete this function with additional lines of code.(a) Devise a MATLAB strategy for picking the constant β so that the maximum value of the frequencyresponse will be equal to one. Write the one or two lines of MATLAB code that will do this scalingoperation in general. There are two approaches here:(a) Mathematical: derive a formula for β from the formula for the frequency response of the BPF.Then use MATLAB to evaluate this closed-form expression for β.(b) Numerical: let MATLAB measure the peak value of the unscaled frequency response, <strong>and</strong> thenhave MATLAB compute β to scale the peak to be one.(b) Complete the M-file dtmfdesign.m which is described in Fig. 5. This function should produce alleight b<strong>and</strong>pass filters needed for the DTMF filter bank system. Store the filters in the columns of thematrix hh whose size is L × 8.(c) The rest of this section describes how you can exhibit that you have designed a correct set of BPFs. Inparticular, you should justify how to choose L, the length of the filters. When you have completedyour filter design function, you should run the L = 40 <strong>and</strong> L = 80 cases, <strong>and</strong> then you shoulddetermine empirically the minimum length L so that the frequency response will satisfy thespecifications on passb<strong>and</strong> width <strong>and</strong> stopb<strong>and</strong> rejection given in part (f) below.(d) Generate the eight (scaled) b<strong>and</strong>pass filters with L = 40 <strong>and</strong> f s = 8000. Plot the magnitude of thefrequency responses all together on one plot (the range 0 ≤ ˆω ≤ π is sufficient because |H(e j ˆω )| issymmetric). Indicate the locations of each of the eight DTMF frequencies (697, 770, 852, 941, 1209,1336, 1477, <strong>and</strong> 1633 Hz) on this plot to illustrate whether or not the passb<strong>and</strong>s are narrow enough toseparate the DTMF frequency components. Hint: use the hold comm<strong>and</strong> <strong>and</strong> markers as you did inthe warm-up.(e) Repeat the previous part with L = 80 <strong>and</strong> f s = 8000. The width of the passb<strong>and</strong> is supposed to varyinversely with the filter length L. Explain whether or not that is true by comparing the length 80 <strong>and</strong>length 40 cases.McClellan, Schafer, <strong>and</strong> Yoder, Signal Processing First, ISBN 0-13-065562-7.Prentice Hall, Upper Saddle River, NJ 07458. c○2003 Pearson Education, Inc.7
(f) As help for the previous parts, recall the following definitions: The passb<strong>and</strong> of the BPF filter isdefined by the region of ˆω where |H(e j ˆω )| is close to one. Typically, the passb<strong>and</strong> width is defined asthe length of the frequency region where |H(e j ˆω )| is greater than 1/ √ 2 = 0.707.The stopb<strong>and</strong> of the BPF filter is defined by the region of ˆω where |H(e j ˆω )| is close to zero. In thiscase, it is reasonable to define the stopb<strong>and</strong> as the region where |H(e j ˆω )| is less than 0.25.Filter Design Specifications: For each of the eight BPFs, choose L so that only one frequency lieswithin the passb<strong>and</strong> of the BPF <strong>and</strong> all other DTMF frequencies lie in the stopb<strong>and</strong>.Use the zoom on comm<strong>and</strong> to show the frequency response over the frequency domain where theDTMF frequencies lie. Comment on the selectivity of the b<strong>and</strong>pass filters, i.e., use the frequencyresponse to explain how the filter passes one component while rejecting the others. Is each filter’spassb<strong>and</strong> narrow enough so that only one frequency component lies in the passb<strong>and</strong> <strong>and</strong> the others arein the stopb<strong>and</strong>? Since the same value of L is used for all the filters, which filter drives the problem?In other words, for which center frequency is it hardest to meet the specifications for the chosen valueof L?4.2 A Scoring Function: dtmfscore.mThe final objective is decoding—a process that requires a binary decision on the presence or absence of theindividual tones. In order to make the signal detection an automated process, we need a score function thatrates the different possibilities.(a) Complete the dtmfscore function based on the skeleton given in Fig. 6. The input signal xx to thedtmfscore function must be a short segment from the DTMF signal. The task of breaking up thesignal so that each short segment corresponds to one key is done by the function dtmfcut prior tocalling dtmfscore.function sc = dtmfscore(xx, hh)%DTMFSCORE% usage: sc = dtmfscore(xx, hh)% returns a score based on the max amplitude of the filtered output% xx = input DTMF tone% hh = impulse response of ONE b<strong>and</strong>pass filter%% The signal detection is done by filtering xx with a length-L% BPF, hh, <strong>and</strong> then finding the maximum amplitude of the output.% The score is either 1 or 0.% sc = 1 if max(|y[n]|) is greater than, or equal to, 0.59% sc = 0 if max(|y[n]|) is less than 0.59%xx = xx*(2/max(abs(xx))); %--Scale the input x[n] to the range [-2,+2]Figure 6: Skeleton of the dtmfscore.m function. Complete this function with additional lines of code.(b) Use the following rule for scoring: the score equals one when max |y i[n]| ≥ 0.59; otherwise, it iszero. The signal y i [n] is the output of the i-th BPF.(c) Prior to filtering <strong>and</strong> scoring, make sure that the input signal x[n] is normalized to the range [−2, +2].With this scaling the two sinusoids that make up x[n] should each have amplitudes of approximatelynMcClellan, Schafer, <strong>and</strong> Yoder, Signal Processing First, ISBN 0-13-065562-7.Prentice Hall, Upper Saddle River, NJ 07458. c○2003 Pearson Education, Inc.8
1.0. 5 Therefore the scoring threshold of 0.59 corresponds to a 59% level for detecting the presence ofone sinusoid.(d) The scoring rule above depends on proper scaling of the frequency response of the b<strong>and</strong>pass filters.Explain why the maximum value of the magnitude for H(e j ˆω ) must be equal to one for each filter.Consider the fact that both sinusoids in the DTMF tone will experience a known gain (or attenuation)through the b<strong>and</strong>pass filter, so the amplitude of the output can be predicted if we control both thefrequency response <strong>and</strong> the amplitude of the input.(e) When debugging your program it might be useful to have a plot comm<strong>and</strong> inside the dtmfscore.mfunction. If you plot the first 200–500 points of the filtered output, you should be able to see twocases: either y[n] is a strong sinusoid with an amplitude close to one (when the filter is matched toone of the component frequencies), or y[n] is relatively small when the filter passb<strong>and</strong> <strong>and</strong> input signalfrequency are mismatched.4.3 DTMF Decode Function: dtmfrun.mThe DTMF decoding function, dtmfrun must use information from dtmfscore to determine whichkey was pressed based on an input DTMF tone. The skeleton of this function in Fig. 7 includes the helpcomments.function keys = dtmfrun(xx,L,fs)%DTMFRUN keys = dtmfrun(xx,L,fs)% returns the list of key names found in xx.% keys = array of characters, i.e., the decoded key names% xx = DTMF waveform% L = filter length% fs = sampling freq%center_freqs = .... %
which is called from dtmfrun. The score returned from dtmfscore must be either a 1 or a 0 for eachfrequency. Then the decoding works as follows: If exactly one row frequency <strong>and</strong> one column frequencyare scored as 1’s, then an unique key is identified <strong>and</strong> the decoding is probably successful. In this case,you can determine the key by using the row <strong>and</strong> column index. It is possible that there might be an errorin scoring if too many or too few frequencies are scored as 1’s. In this case, you should return an errorindicator (perhaps by setting the key equal to −1). There are several ways to write the dtmfrun function,but you should avoid excessive use of “if” statements to test all 16 cases. Hint: use MATLAB’s logicals(e.g., help find) to implement the tests in a few statements.4.4 Telephone NumbersThe functions dtmfdial.m <strong>and</strong> dtmfrun.m can be used to test the entire DTMF system as shown inFig. 8. You could also use r<strong>and</strong>om digits (e.g., ceil(15.9*r<strong>and</strong>(1,22)+0.09)) in place of 1:16 indtmfdial. For the dtmfrun function to work correctly, all the M-files must be on the MATLAB path. It>>fs = 8000; %>tk = [’A’,’B’,’C’,’D’,’*’,’#’,’0’,’1’,’2’,’3’,’4’,’5’,’6’,’7’,’8’,’9’];>>xx = dtmfdial( tk, fs );>>soundsc(xx, fs)>>L = ... %>dtmfrun(xx, L, fs)ans =ABCD*#0123456789Figure 8: Testing the DTMF system.is also essential to have short pauses in between the tone pairs so that dtmfcut can parse out the individualsignal segments.If you are presenting this project in a lab report, demonstrate a working version of your programs byrunning it on the following phone number:407*89132#BADCIn addition, make a spectrogram of the signal from dtmfdial to illustrate the presence of the dual tones.4.5 DemoWhen you submit your lab report, you must demonstrate your work to your TA. Have your code <strong>and</strong> filesready for the demo. You should call dtmfrun for a signal xx provided by your TA. The output should bethe decoded telephone number. The evaluation criteria are shown at the end of the verification sheet.McClellan, Schafer, <strong>and</strong> Yoder, Signal Processing First, ISBN 0-13-065562-7.Prentice Hall, Upper Saddle River, NJ 07458. c○2003 Pearson Education, Inc.10
Lab 09INSTRUCTOR VERIFICATION PAGEFor each verification, be prepared to explain your answer <strong>and</strong> respond to other related questionsthat the lab TA’s or professors might ask. Turn this page in at the end of your lab period.Name:Date of Lab:Part 3.1: Complete the dialing function dtmfdial.m:Verified:Date/Time:Part 3.2(b): Measure the passb<strong>and</strong> width of the BPFVerified:Date/Time:Part 3.2(c): Determine the analog frequency components passed by the BPF when f s = 8000 Hz. Give therange of frequencies.Verified:Date/Time:DTMF <strong>Decoding</strong> EvaluationDoes the designed DTMF decoder decode the telephone numbers correctly for the following values of L?L = 111 All Numbers Most NoneL =Student’s Length All Numbers Most NoneMcClellan, Schafer, <strong>and</strong> Yoder, Signal Processing First, ISBN 0-13-065562-7.Prentice Hall, Upper Saddle River, NJ 07458. c○2003 Pearson Education, Inc.11