Residential radon and lung cancer incidence in a Danish cohort - VBN
Residential radon and lung cancer incidence in a Danish cohort - VBN
Residential radon and lung cancer incidence in a Danish cohort - VBN

You also want an ePaper? Increase the reach of your titles
YUMPU automatically turns print PDFs into web optimized ePapers that Google loves.
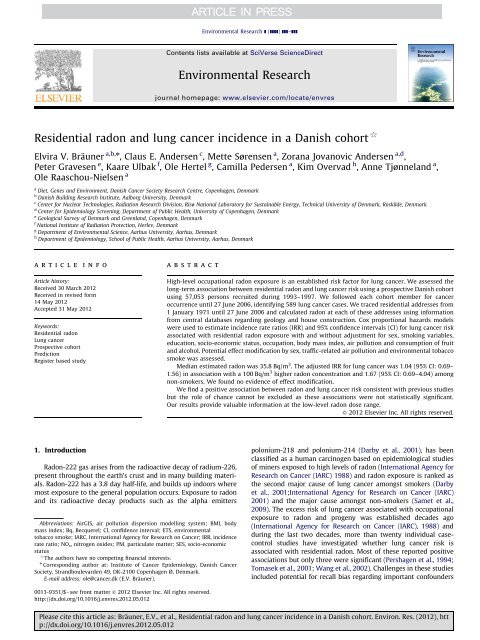
Environmental Research ] (]]]]) ]]]–]]]Contents lists available at SciVerse ScienceDirectEnvironmental Researchjournal homepage: www.elsevier.com/locate/envres<strong>Residential</strong> <strong>radon</strong> <strong>and</strong> <strong>lung</strong> <strong>cancer</strong> <strong><strong>in</strong>cidence</strong> <strong>in</strong> a <strong>Danish</strong> <strong>cohort</strong> $Elvira V. Bräuner a,b,n , Claus E. Andersen c , Mette Sørensen a , Zorana Jovanovic Andersen a,d ,Peter Gravesen e , Kaare Ulbak f , Ole Hertel g , Camilla Pedersen a , Kim Overvad h , Anne Tjønnel<strong>and</strong> a ,Ole Raaschou-Nielsen aa Diet, Genes <strong>and</strong> Environment, <strong>Danish</strong> Cancer Society Research Centre, Copenhagen, Denmarkb <strong>Danish</strong> Build<strong>in</strong>g Research Institute, Aalborg University, Denmarkc Center for Nuclear Technologies, Radiation Research Division, Risø National Laboratory for Susta<strong>in</strong>able Energy, Technical University of Denmark, Roskilde, Denmarkd Center for Epidemiology Screen<strong>in</strong>g, Department of Public Health, University of Copenhagen, Denmarke Geological Survey of Denmark <strong>and</strong> Greenl<strong>and</strong>, Copenhagen, Denmarkf National Institute of Radiation Protection, Herlev, Denmarkg Department of Environmental Science, Aarhus University, Aarhus, Denmarkh Department of Epidemiology, School of Public Health, Aarhus University, Aarhus, Denmarkarticle <strong>in</strong>foArticle history:Received 30 March 2012Received <strong>in</strong> revised form14 May 2012Accepted 31 May 2012Keywords:<strong>Residential</strong> <strong>radon</strong>Lung <strong>cancer</strong>Prospective <strong>cohort</strong>PredictionRegister based studyabstractHigh-level occupational <strong>radon</strong> exposure is an established risk factor for <strong>lung</strong> <strong>cancer</strong>. We assessed thelong-term association between residential <strong>radon</strong> <strong>and</strong> <strong>lung</strong> <strong>cancer</strong> risk us<strong>in</strong>g a prospective <strong>Danish</strong> <strong>cohort</strong>us<strong>in</strong>g 57,053 persons recruited dur<strong>in</strong>g 1993–1997. We followed each <strong>cohort</strong> member for <strong>cancer</strong>occurrence until 27 June 2006, identify<strong>in</strong>g 589 <strong>lung</strong> <strong>cancer</strong> cases. We traced residential addresses from1 January 1971 until 27 June 2006 <strong>and</strong> calculated <strong>radon</strong> at each of these addresses us<strong>in</strong>g <strong>in</strong>formationfrom central databases regard<strong>in</strong>g geology <strong>and</strong> house construction. Cox proportional hazards modelswere used to estimate <strong><strong>in</strong>cidence</strong> rate ratios (IRR) <strong>and</strong> 95% confidence <strong>in</strong>tervals (CI) for <strong>lung</strong> <strong>cancer</strong> riskassociated with residential <strong>radon</strong> exposure with <strong>and</strong> without adjustment for sex, smok<strong>in</strong>g variables,education, socio-economic status, occupation, body mass <strong>in</strong>dex, air pollution <strong>and</strong> consumption of fruit<strong>and</strong> alcohol. Potential effect modification by sex, traffic-related air pollution <strong>and</strong> environmental tobaccosmoke was assessed.Median estimated <strong>radon</strong> was 35.8 Bq/m 3 . The adjusted IRR for <strong>lung</strong> <strong>cancer</strong> was 1.04 (95% CI: 0.69–1.56) <strong>in</strong> association with a 100 Bq/m 3 higher <strong>radon</strong> concentration <strong>and</strong> 1.67 (95% CI: 0.69–4.04) amongnon-smokers. We found no evidence of effect modification.We f<strong>in</strong>d a positive association between <strong>radon</strong> <strong>and</strong> <strong>lung</strong> <strong>cancer</strong> risk consistent with previous studiesbut the role of chance cannot be excluded as these associations were not statistically significant.Our results provide valuable <strong>in</strong>formation at the low-level <strong>radon</strong> dose range.& 2012 Elsevier Inc. All rights reserved.1. IntroductionRadon-222 gas arises from the radioactive decay of radium-226,present throughout the earth’s crust <strong>and</strong> <strong>in</strong> many build<strong>in</strong>g materials.Radon-222 has a 3.8 day half-life, <strong>and</strong> builds up <strong>in</strong>doors wheremost exposure to the general population occurs. Exposure to <strong>radon</strong><strong>and</strong> its radioactive decay products such as the alpha emittersAbbreviations: AirGIS, air pollution dispersion modell<strong>in</strong>g system; BMI, bodymass <strong>in</strong>dex; Bq, Becquerel; CI, confidence <strong>in</strong>terval; ETS, environmentaltobacco smoke; IARC, International Agency for Research on Cancer; IRR, <strong><strong>in</strong>cidence</strong>rate ratio; NO x , nitrogen oxides; PM, particulate matter; SES, socio-economicstatus$ The authors have no compet<strong>in</strong>g f<strong>in</strong>ancial <strong>in</strong>terests.n Correspond<strong>in</strong>g author at: Institute of Cancer Epidemiology, <strong>Danish</strong> CancerSociety, Str<strong>and</strong>boulevarden 49, DK-2100 Copenhagen Ø, Denmark.E-mail address: ole@<strong>cancer</strong>.dk (E.V. Bräuner).polonium-218 <strong>and</strong> polonium-214 (Darby et al., 2001), has beenclassified as a human carc<strong>in</strong>ogen based on epidemiological studiesof m<strong>in</strong>ers exposed to high levels of <strong>radon</strong> (International Agency forResearch on Cancer (IARC) 1988) <strong>and</strong> <strong>radon</strong> exposure is ranked asthe second major cause of <strong>lung</strong> <strong>cancer</strong> amongst smokers (Darbyet al., 2001;International Agency for Research on Cancer (IARC)2001) <strong>and</strong> the major cause amongst non-smokers (Samet et al.,2009). The excess risk of <strong>lung</strong> <strong>cancer</strong> associated with occupationalexposure to <strong>radon</strong> <strong>and</strong> progeny was established decades ago(International Agency for Research on Cancer (IARC), 1988) <strong>and</strong>dur<strong>in</strong>g the last two decades, more than twenty <strong>in</strong>dividual casecontrolstudies have <strong>in</strong>vestigated whether <strong>lung</strong> <strong>cancer</strong> risk isassociated with residential <strong>radon</strong>. Most of these reported positiveassociations but only three were significant (Pershagen et al., 1994;Tomasek et al., 2001; Wang et al., 2002). Challenges <strong>in</strong> these studies<strong>in</strong>cluded potential for recall bias regard<strong>in</strong>g important confounders0013-9351/$ - see front matter & 2012 Elsevier Inc. All rights reserved.http://dx.doi.org/10.1016/j.envres.2012.05.012Please cite this article as: Bräuner, E.V., et al., <strong>Residential</strong> <strong>radon</strong> <strong>and</strong> <strong>lung</strong> <strong>cancer</strong> <strong><strong>in</strong>cidence</strong> <strong>in</strong> a <strong>Danish</strong> <strong>cohort</strong>. Environ. Res. (2012), http://dx.doi.org/10.1016/j.envres.2012.05.012
2E.V. Bräuner et al. / Environmental Research ] (]]]]) ]]]–]]]such as smok<strong>in</strong>g, exposure misclassification when reconstruct<strong>in</strong>gpast residential <strong>radon</strong> exposures us<strong>in</strong>g present 1-year measurements<strong>and</strong> limited statistical power (Al-Zoughool <strong>and</strong> Krewski,2009; Lub<strong>in</strong> et al., 1995). To overcome power limitations threerecent studies comb<strong>in</strong>ed data from thirteen European (Darby et al.,2005), seven North American (Krewski et al., 2005) <strong>and</strong> two Ch<strong>in</strong>ese(Lub<strong>in</strong> et al., 2004) studies, result<strong>in</strong>g <strong>in</strong> odds ratios (95% CI) of: 1.08(1.03–1.15), 1.11 (1.00–1.28) <strong>and</strong> 1.33 (1.01–1.36), respectively, per100 Bq/m 3 . These results are compatible with the excess odds ratiopredicted by a downward extrapolation of m<strong>in</strong>ers data (NationalResearch Council (NRC), 1999) <strong>and</strong> collectively provide evidence fora l<strong>in</strong>k between residential <strong>radon</strong> <strong>and</strong> <strong>lung</strong> <strong>cancer</strong> risk.Not much <strong>in</strong>formation is available on the association between<strong>lung</strong> <strong>cancer</strong> risk <strong>and</strong> low to medium residential <strong>radon</strong> levels suchas those present <strong>in</strong> Denmark. Furthermore, participation bias mayseriously affect previous studies requir<strong>in</strong>g <strong>in</strong>dividual consent, forthis reason register based studies mak<strong>in</strong>g use of predicted doses<strong>and</strong> avoid<strong>in</strong>g the need for <strong>in</strong>terviews are advantageous (Littleet al., 2010). But predicted levels have only been used <strong>in</strong> oneprevious study that considered mean county <strong>radon</strong> levels (Turneret al., 2011). We have now developed <strong>and</strong> validated a predictionmodel us<strong>in</strong>g register-based <strong>in</strong>put data, which enables estimationof <strong>radon</strong> <strong>in</strong> residences <strong>in</strong> large-scale epidemiological studies(Andersen et al., 2007). We applied this model to the 173,419residences the <strong>cohort</strong> members had lived <strong>in</strong> over a 35 year period<strong>and</strong> used these predictions to <strong>in</strong>vestigate the association betweenlong-term residential <strong>radon</strong> <strong>and</strong> risk for <strong>lung</strong> <strong>cancer</strong> <strong>in</strong> Denmark.‘‘Diet, Cancer <strong>and</strong> Health’’ is a prospective <strong>cohort</strong> with detailed<strong>in</strong>formation on potential confounders collected at basel<strong>in</strong>e withlittle potential for recall bias. We used this <strong>cohort</strong> comb<strong>in</strong>ed with<strong>radon</strong> predictions to <strong>in</strong>vestigate the association between residential<strong>radon</strong> <strong>and</strong> to exam<strong>in</strong>e the potential modify<strong>in</strong>g effects of airpollution, environmental tobacco smoke (ETS) <strong>and</strong> sex.2. Material <strong>and</strong> methods2.1. Design <strong>and</strong> study participantsBetween December 1993 <strong>and</strong> May 1997, 57,053 persons aged 50–64 yearswere enroled <strong>in</strong> the prospective study ‘‘Diet, Cancer <strong>and</strong> Health’’. The participantshad to be born <strong>in</strong> Denmark, live <strong>in</strong> Copenhagen or Aarhus, <strong>and</strong> <strong>cancer</strong> free at thetime of <strong>in</strong>clusion (Tjønnel<strong>and</strong> et al., 2007). The basel<strong>in</strong>e exam<strong>in</strong>ation <strong>in</strong>cluded aself-adm<strong>in</strong>istered questionnaire on diet, smok<strong>in</strong>g habits (status, <strong>in</strong>tensity <strong>and</strong>duration), occupational history, length of school attendance <strong>and</strong> a number of otherhealth-related items. We calculated smok<strong>in</strong>g <strong>in</strong>tensity by equat<strong>in</strong>g a cigarette to1 g, a cheroot or a pipe to 3 g, <strong>and</strong> a cigar to 4.5 g of tobacco.We followed each <strong>cohort</strong> member for occurrence of any <strong>cancer</strong> from enrolmentuntil 27 June 2006 <strong>in</strong> the <strong>Danish</strong> Cancer Registry (Storm et al., 1997) <strong>and</strong> the <strong>Danish</strong>Pathology Data Bank by use of the personal identification number, which is uniquefor each <strong>Danish</strong> citizen. We traced the date of death, emigration or disappearance of<strong>cohort</strong> members <strong>in</strong> the Central Population Registry by use of the personalidentification number. We retrieved the addresses of each participant from1 January 1971 until 27 June 2006 from the same registry, thus <strong>in</strong>clud<strong>in</strong>g 35 yearsof address history dat<strong>in</strong>g back to when these <strong>cohort</strong> persons were <strong>in</strong> their 20–40s.We noted the dates of mov<strong>in</strong>g <strong>in</strong> <strong>and</strong> leav<strong>in</strong>g each address, <strong>and</strong> l<strong>in</strong>ked the addressesto the <strong>Danish</strong> address database to obta<strong>in</strong> geographical coord<strong>in</strong>ates (denoted <strong>in</strong> thefollow<strong>in</strong>g as ‘geocodes’), which were obta<strong>in</strong>ed for 94% of the addresses. Relevant<strong>Danish</strong> ethical committees <strong>and</strong> data protection agencies approved the study, <strong>and</strong>written <strong>in</strong>formed consent was obta<strong>in</strong>ed from all participants.were corrected for seasonal variation. The model has been successfully validated<strong>and</strong> previously described <strong>in</strong> detail (Andersen et al., 2007) as well as applied <strong>in</strong> twoprevious studies (Bräuner et al., 2010; Raaschou-Nielsen, 2008). The modelpredicts low residential <strong>radon</strong> concentrations with great certa<strong>in</strong>ty <strong>and</strong> detecteddifferences <strong>in</strong> groups well (Fig. 1) (Andersen et al., 2007).Information on traffic has previously been collected for the entire studypopulation (Raaschou-Nielsen et al., 2011b). The average concentrations ofnitrogen oxides (NO x ) at the front door of each dwell<strong>in</strong>g dur<strong>in</strong>g the period thatthe participants occupied the address were assessed by use of the <strong>Danish</strong> airpollution dispersion modell<strong>in</strong>g system (AirGIS), with high temporal <strong>and</strong> spatialresolution (Jensen et al., 2001) <strong>and</strong> <strong>in</strong>clud<strong>in</strong>g the state-of-the-art urban streetpollution model, currently used <strong>in</strong> more than 17 countries around the world(Kakosimos et al., 2010). AirGIS has been successfully validated (Berkowicz et al.,2007) <strong>and</strong> applied (Andersen et al., 2011; Raaschou-Nielsen et al., 2011a). Wefocused on the concentration of NO x as an <strong>in</strong>dicator for particular matter (PM)from traffic because NO x correlates strongly with ultraf<strong>in</strong>e particles <strong>in</strong> <strong>Danish</strong>streets (Hertel et al., 2001; Ketzel et al., 2003).We calculated the time-weighted average <strong>radon</strong> <strong>and</strong> NO x concentrations ateach <strong>cohort</strong> member’s residential addresses from 1 January 1971 onwards. Theseconcentrations were entered <strong>in</strong>to the statistical <strong>cancer</strong> risk model as timedependentvariables.If <strong>radon</strong> or air pollution variables could not be calculated because of the failedgeocod<strong>in</strong>g of an address, we imputed the concentration calculated at the preced<strong>in</strong>gaddress. If the concentration was miss<strong>in</strong>g for the first address, we imputed the value atthe subsequent address. We <strong>in</strong>cluded only participants for which we imputed <strong>radon</strong> orair pollution for less than 20% of time from 1 January 1971 until diagnosis or censor<strong>in</strong>g.2.3. Statistical methodsThe end-po<strong>in</strong>t for the risk analyses was primary <strong>lung</strong> <strong>cancer</strong>. IRRs wereestimated by a Cox proportional hazards model with age as the underly<strong>in</strong>g timescale (Thiebaut <strong>and</strong> Benichou, 2004). We calculated two-sided 95% CIs on the basisof the Wald test statistic for regression parameters <strong>in</strong> Cox regression models withthe PHREG procedure <strong>in</strong> SAS (version 9.1; SAS Institute, Cary, NC). Analyses werecorrected for delayed entry at the time of enrolment, so that persons wereconsidered under risk from time of enrolment <strong>in</strong>to the <strong>cohort</strong>. People diagnosedwith another previous <strong>cancer</strong> were excluded from the analyses. Censor<strong>in</strong>goccurred at the time of death, emigration or disappearance, the time of a <strong>cancer</strong>diagnosis, or 27 June 2006 (end of follow-up), whichever came first.Data were analysed with <strong>and</strong> without adjustment for sex, body mass <strong>in</strong>dex(l<strong>in</strong>ear, BMI, kg/m 2 ), length of school attendance (o8, 8–10 <strong>and</strong>410 years), socioeconomicstatus (SES, low, medium, high <strong>and</strong> very high) based on work marketaffiliation, <strong>in</strong>come <strong>and</strong> education st<strong>and</strong>ards for the municipal lived <strong>in</strong>, smok<strong>in</strong>gstatus (never, former, present), smok<strong>in</strong>g <strong>in</strong>tensity (lifetime average, l<strong>in</strong>ear variableallow<strong>in</strong>g for different slopes below <strong>and</strong> above 19 g/day), smok<strong>in</strong>g duration (l<strong>in</strong>ear,years), ETS (a dichotomous variable <strong>in</strong>dicat<strong>in</strong>g no/low versus high exposure: ‘no2.2. Exposure assessment<strong>Residential</strong> <strong>radon</strong> concentrations for each address occupied by a participantwere predicted with a validated regression model (Andersen et al., 2007). Themodel uses n<strong>in</strong>e explanatory variables, <strong>in</strong>clud<strong>in</strong>g geographic location, soil type<strong>and</strong> dwell<strong>in</strong>g characteristics such as residential type, floor level, basement <strong>and</strong>build<strong>in</strong>g materials. The National Survey <strong>and</strong> Cadastre identified geographicalcoord<strong>in</strong>ates for all houses, <strong>and</strong> the Geological Survey of Denmark <strong>and</strong> Greenl<strong>and</strong>subsequently identified the local soil from digital soil maps. House constructiondata were obta<strong>in</strong>ed from the Build<strong>in</strong>g <strong>and</strong> Dwell<strong>in</strong>g Register. Model predictionsFig. 1. Distribution of 758 <strong>in</strong>dependent domestic <strong>radon</strong> measurements for5 groups of concentrations predicted by the exposure assessment method used<strong>in</strong> the study. The solid po<strong>in</strong>ts <strong>and</strong> the thick horizontal l<strong>in</strong>es mark mean <strong>and</strong>median values, respectively. The <strong>in</strong>ner boxes mark the 25%–75% quartiles, <strong>and</strong> theumbrellas mark the 5% <strong>and</strong> 95% percentiles. With<strong>in</strong> the 5 groups, the follow<strong>in</strong>gmaximum values were measured: 130, 290, 700, 620, <strong>and</strong> 1800 Bq/m 3 . (Repr<strong>in</strong>tedwith permission from Radiat. Prot. Dosim. (Andersen et al., 2007)).Please cite this article as: Bräuner, E.V., et al., <strong>Residential</strong> <strong>radon</strong> <strong>and</strong> <strong>lung</strong> <strong>cancer</strong> <strong><strong>in</strong>cidence</strong> <strong>in</strong> a <strong>Danish</strong> <strong>cohort</strong>. Environ. Res. (2012), http://dx.doi.org/10.1016/j.envres.2012.05.012
E.V. Bräuner et al. / Environmental Research ] (]]]]) ]]]–]]] 3smoker <strong>in</strong> the home <strong>and</strong> ETS at work for less than 4 h/day’ versus ‘high’), dietary<strong>in</strong>take of fruit (l<strong>in</strong>ear, g/day) <strong>and</strong> alcohol (l<strong>in</strong>ear, g/day), a dichotomous variable<strong>in</strong>dicat<strong>in</strong>g employment for at least one year <strong>in</strong> an <strong>in</strong>dustry or job associated withrisk for <strong>lung</strong> <strong>cancer</strong> (m<strong>in</strong><strong>in</strong>g, electroplat<strong>in</strong>g, shoe/leather product manufacture,metal process<strong>in</strong>g, steel roll<strong>in</strong>g mill, shipyard, glass/ch<strong>in</strong>a/pottery <strong>in</strong>dustry, roofconstruction, asphalt/demolition, truck/bus/taxi chauffeur, cement manufacture,asbestos manufacture/<strong>in</strong>sulation, butcher, pa<strong>in</strong>ter, welder, auto mechanic, waiteror cook), residence type (a dichotomous variable <strong>in</strong>dicat<strong>in</strong>g s<strong>in</strong>gle family homeversus apartment) <strong>and</strong> NO x at residencies s<strong>in</strong>ce 1971 (l<strong>in</strong>ear, mg/m 3 ). We excluded<strong>cohort</strong> members that had a miss<strong>in</strong>g value <strong>in</strong> any covariate, thus the persons<strong>in</strong>cluded <strong>in</strong> the crude <strong>and</strong> the adjusted analyses are identical. All <strong>in</strong>formation onthe covariates, with the exception of NO x was collected at enrolment. We alsoconducted a sub-analysis <strong>in</strong>clud<strong>in</strong>g only those persons liv<strong>in</strong>g <strong>in</strong> s<strong>in</strong>gle detachedhomes at enrolment as <strong>radon</strong> levels are generally higher <strong>and</strong> with more variationcompared to apartments (Andersen et al., 2001) <strong>and</strong> because these persons form amore homogeneous group with respect to SES <strong>and</strong> lifestyle, reduc<strong>in</strong>g the potentialfor confound<strong>in</strong>g.The assumption of l<strong>in</strong>earity for the cont<strong>in</strong>uous variables (residential <strong>radon</strong>,NO x , fruit <strong>and</strong> alcohol consumption, smok<strong>in</strong>g duration, smok<strong>in</strong>g <strong>in</strong>tensity <strong>and</strong>BMI) <strong>in</strong> relation to <strong>lung</strong> <strong>cancer</strong> was evaluated graphically us<strong>in</strong>g l<strong>in</strong>ear spl<strong>in</strong>es withboundaries placed at the n<strong>in</strong>e deciles among all participants as well as by anumerical test us<strong>in</strong>g the likelihood ratio test statistic to compare the modelassum<strong>in</strong>g l<strong>in</strong>earity with the l<strong>in</strong>ear spl<strong>in</strong>e model. Smok<strong>in</strong>g <strong>in</strong>tensity <strong>and</strong> BMIdeviated from l<strong>in</strong>earity, the <strong>in</strong>tensity was, thus, <strong>in</strong>cluded as a l<strong>in</strong>ear variableallow<strong>in</strong>g for different slopes above <strong>and</strong> below 19 g tobacco/day, whilst BMI was<strong>in</strong>cluded as a l<strong>in</strong>ear variable along with BMI squared.We formed four <strong>in</strong>tervals for exposure to residential <strong>radon</strong> us<strong>in</strong>g the 25th,50th <strong>and</strong> 75th percentiles for all participants as the cut-off po<strong>in</strong>ts <strong>and</strong> estimatedthe IRR for <strong>lung</strong> <strong>cancer</strong> for the higher exposure ranges compared with the lowestexposure range. We also estimated the IRRs as l<strong>in</strong>ear trends per 100 Bq/m 3<strong>in</strong>crement <strong>in</strong> residential <strong>radon</strong> concentration. PM <strong>in</strong> ambient air penetrates homes<strong>and</strong> contributes significantly to <strong>in</strong>door PM (Schneider et al., 2004) as does ETS(International Agency for Research on Cancer (IARC), 2004). Presence of <strong>in</strong>door PMmay modify the association between residential <strong>radon</strong> <strong>and</strong> <strong>lung</strong> <strong>cancer</strong> because<strong>radon</strong> decay products easily attach to PM <strong>in</strong> the air (Tokonami, 2000; Yu et al.,2001) which might modify exposure <strong>and</strong> airway deposition (Bair, 1995). Also, forwomen spend more time <strong>in</strong>doors than men so the apparent association may begreater for them. The possible effect modification by traffic-related air pollution,ETS <strong>and</strong> sex were analysed by compar<strong>in</strong>g the respective estimate for <strong>radon</strong> with<strong>in</strong>different strata of the variable. These <strong>in</strong>teractions were tested amongst allparticipants as well as for smokers <strong>and</strong> non-smokers separately.3. ResultsAmong the 57,053 <strong>cohort</strong> members, we excluded 571 due to a<strong>cancer</strong> diagnosis before enrolment, 2 because of uncerta<strong>in</strong> date of<strong>cancer</strong> diagnosis, 960 for which their address history was notavailable <strong>in</strong> the Central Population Registry or their basel<strong>in</strong>eaddress could not be geocoded, 1365 because of miss<strong>in</strong>g data <strong>in</strong>potential confounders, <strong>and</strong> 1463 because <strong>radon</strong> or NO x exposurewas assessed for less than 80% of the time from 1 January 1971until diagnosis or censor<strong>in</strong>g. The 52,692 <strong>in</strong>cluded <strong>cohort</strong> membershad lived <strong>in</strong> a total of 173,419 addresses <strong>and</strong> were followed up for<strong>cancer</strong> for an average of 9.6 years (total person years at risk was506,492). We identified 589 <strong>lung</strong> <strong>cancer</strong> cases, correspond<strong>in</strong>g toan overall <strong><strong>in</strong>cidence</strong> rate of 116 per 100,000 person years. Thecrude <strong>lung</strong> <strong>cancer</strong> <strong><strong>in</strong>cidence</strong> rate was 270 <strong>and</strong> 30 per 100,000person years amongst smokers than non-smokers, respectively.Table 1 shows the characteristics of the <strong>cohort</strong> members <strong>and</strong>the <strong>lung</strong> <strong>cancer</strong> cases. Sex distribution, alcohol consumption <strong>and</strong>BMI were similar among cases <strong>and</strong> <strong>cohort</strong> members. The proportionof participants liv<strong>in</strong>g <strong>in</strong> s<strong>in</strong>gle detached homes was loweramongst cases than amongst <strong>cohort</strong> members whilst all smok<strong>in</strong>gvariables showed higher exposure among cases. The proportion ofparticipants with a short length of school attendance, low SES <strong>and</strong>low fruit consumption was higher among cases than among the<strong>cohort</strong> members <strong>and</strong> a higher proportion of cases had beenemployed <strong>in</strong> an <strong>in</strong>dustry or job associated with a higher risk for<strong>lung</strong> <strong>cancer</strong>. The median predicted <strong>radon</strong> concentration was 24<strong>and</strong> 39.5 Bq/m 3 for cases <strong>and</strong> the <strong>cohort</strong>, respectively, whilst NO xlevels were higher among cases. Table 1 also shows that thoseliv<strong>in</strong>g at addresses with high <strong>radon</strong> tended to live <strong>in</strong> s<strong>in</strong>gledetachedhomes, have longer school attendance, have higher SES,be less likely to smoke, be less exposed to ETS, have a higher fruit<strong>in</strong>take, be less likely to have been employed <strong>in</strong> an <strong>in</strong>dustry or jobassociated with higher risk for <strong>lung</strong> <strong>cancer</strong> <strong>and</strong> be exposed tolower NO x levels.Overall the adjusted IRR associated with 100 Bq/m 3 <strong>radon</strong>levels was 1.04 (95% CI: 0.69; 1.56) for all participants <strong>and</strong> 1.14(95% CI: 0.69; 1.90) when restrict<strong>in</strong>g data to participants liv<strong>in</strong>g <strong>in</strong>s<strong>in</strong>gle detached family homes at enrolment (Table 2). Amongnon-smokers, the IRR was 1.67 (95% CI: 0.69; 4.04) <strong>and</strong> the IRRwas dose-dependently higher over the four <strong>radon</strong> exposurequartiles (Table 2). The unadjusted results for all participantsshowed substantially <strong>and</strong> significantly lower risk of <strong>lung</strong> <strong>cancer</strong> <strong>in</strong>association with higher <strong>radon</strong> levels <strong>and</strong> smok<strong>in</strong>g was by far themost important co-variate for the change <strong>in</strong> the estimatedassociation between <strong>radon</strong> <strong>and</strong> <strong>lung</strong> <strong>cancer</strong> <strong>in</strong> model 2 versusmodel 1 (Table 2). The IRRs for <strong>lung</strong> <strong>cancer</strong> <strong>in</strong> association with a100 Bq/m 3 higher <strong>radon</strong> level were slightly higher among thoseliv<strong>in</strong>g <strong>in</strong> s<strong>in</strong>gle detached homes. There was no evidence that theassociation between <strong>radon</strong> <strong>and</strong> risk of <strong>lung</strong> <strong>cancer</strong> was modifiedby sex, traffic-related air pollution or ETS (Table 3).4. DiscussionWhen consider<strong>in</strong>g all participants we only found slight evidencesupport<strong>in</strong>g an association between residential <strong>radon</strong> <strong>and</strong><strong>lung</strong> <strong>cancer</strong> risk <strong>and</strong> the estimated IRRs were heavily affected byadjustment for smok<strong>in</strong>g. Among non-smokers, we found an<strong>in</strong>significantly higher risk for <strong>lung</strong> <strong>cancer</strong> <strong>in</strong> association withresidential <strong>radon</strong> with evidence of a dose-response pattern. Wefound no effect modification by sources of <strong>in</strong>door PM (ETS <strong>and</strong><strong>in</strong>door PM) or sex. Power constra<strong>in</strong>ts played an <strong>in</strong>tegral role <strong>in</strong> theability of this study to detect significant effects as well as detecteffect modifications.In this study we use a prospective <strong>cohort</strong> where <strong>in</strong>formationon potential confound<strong>in</strong>g factors was collected at enrolment withlittle potential for recall bias. Complete follow-up for <strong>cancer</strong>, vitalstatus as well as address history from 1971 onwards was ensuredby use of reliable population-based <strong>Danish</strong> registries.The use of a newly developed prediction model facilitatedestimation of residential <strong>radon</strong> <strong>in</strong> as many as 173,419 homes.Validation of the model aga<strong>in</strong>st <strong>in</strong>dependent <strong>radon</strong> measurementshas been reported previously <strong>and</strong> showed that the modeldetected differences <strong>in</strong> groups well (Fig. 1) (Andersen et al., 2007).However, such model-based estimation of <strong>radon</strong> is <strong>in</strong>evitablyassociated with uncerta<strong>in</strong>ty, result<strong>in</strong>g <strong>in</strong> less precise risk estimates(Andersen et al., 2007). It is clear that measurements <strong>in</strong>homes would provide a more accurate measure for <strong>radon</strong> thanmodel-based predictions, but use of measurements <strong>in</strong> epidemiologicalstudies may also imply disadvantages such as differentialparticipation among cases <strong>and</strong> controls, a limited number ofmeasurements due to economy constra<strong>in</strong>ts <strong>and</strong> exposure misclassificationwhen reconstruct<strong>in</strong>g past residential <strong>radon</strong> exposuresus<strong>in</strong>g present 1-year measurements. The ma<strong>in</strong> advantage ofour novel model-based approach to estimate domestic <strong>radon</strong>levels is that potential participation bias is avoided <strong>and</strong> our modelallows for a larger study predict<strong>in</strong>g levels <strong>in</strong> all historicalresidencies of <strong>cohort</strong> participants from 1971 onwards atreasonable costs.In the present study, a number of risk factors for <strong>lung</strong> <strong>cancer</strong>were less prevalent among participants liv<strong>in</strong>g at the higher <strong>radon</strong>concentrations, <strong>in</strong>clud<strong>in</strong>g low educational level, low SES, be<strong>in</strong>g asmoker, smok<strong>in</strong>g <strong>in</strong>tensity, low fruit <strong>in</strong>take, risk occupation <strong>and</strong>traffic-related air pollution. This would result <strong>in</strong> an underestimationof the association between <strong>radon</strong> <strong>and</strong> <strong>lung</strong> <strong>cancer</strong> risk <strong>in</strong> our study.Please cite this article as: Bräuner, E.V., et al., <strong>Residential</strong> <strong>radon</strong> <strong>and</strong> <strong>lung</strong> <strong>cancer</strong> <strong><strong>in</strong>cidence</strong> <strong>in</strong> a <strong>Danish</strong> <strong>cohort</strong>. Environ. Res. (2012), http://dx.doi.org/10.1016/j.envres.2012.05.012
4E.V. Bräuner et al. / Environmental Research ] (]]]]) ]]]–]]]Table 1Characteristics of all study participants, cases <strong>and</strong> those with low <strong>and</strong> high levels of <strong>radon</strong> at the residences.Characteristic Cohort Cases Radon a o66.1 Bq/m 3 Radon a Z66.1 Bq/m 3No. (%) Median (5–95percentile)No. (%) Median (5–95percentile)No. (%) Median (5–95percentile)No. (%) Median (5–95percentile)All participants 52,692 (100) 589 (100) 39,507 (75.0) 13,185 (25.0)Age at enrolment 56.1 (50.7–64.1) 59.1 (51.1–64.7) 56.1 (50.7–64.1) 56.2 (50.8–64.1)SexMale 25,036 (47.5) 298 (50.6) 18,331 (46.4) 6705 (50.8)Female 27,656 (52.5) 291 (49.4) 21,176 (53.6) 6480 (49.2)Home type atenrolmentS<strong>in</strong>gle detachedhomeApartmentBody Mass Index(kg/m 2 )30,570 (58.0)22,122 (42.0)230 (39.0)359 (61.0)20,921 (50.9)20,195 (49.1)9649 (83.4)1927 (16.7)25.3 (20.4–33.3) 25.0 (19.5–32.8) 25.6 (20.4–33.6) 25.3 (20.5–32.4)15.1 (5.0–32.1) 18.2 (9.7–35.4) 15.3 (5.1–32.1) 14.4 (4.5–32.2)12.9 (0.71–64.4) 16.3 (1.13–86.3) 15.0 (0.20–86.3) 16.0 (0.71–School attendance (years)o8 17,382 (33.0) 295 (50.1) 13,425 (34.0) 3957 (30.0)Z8 35,310 (67.0) 294 (49.9) 26,082 (66.0) 9228 (70.0)Socio-economic status bLow 9007 (17.1) 170 (28.9) 8067 (19.6) 940 (8.1)Medium 23,891 (45.3) 238 (40.4) 17,429 (42.4) 6462 (55.8)High 8502 (16.2) 95 (16.1) 7366 (17.9) 1136 (9.8)Very High 11,292 (21.4) 86 (14.6) 8254 (20.1) 3038 (26.2)Smok<strong>in</strong>gNon-smoker 33,555 (63.7) 99 (16.8) 26,233 (61.3) 9322 (70.7)Present smoker 19,137 (36.3) 490 (83.2) 15 274 (38.7) 3863 (29.3)Intensity (g/day) cDuration(years) c 37.0 (22.0–48.0) 41.0 (31.0–49.0) 37.0 (22.0–48.0) 37.0 (22.0–47.0)ETSNo/low 18,827 (35.7) 51 (8.7) 13,360 (33.8) 5467 (41.5)High 33,865 (64.3) 538 (91.3) 26,147 (66.2) 7718 (58.5)Fruit <strong>in</strong>take (g/day)o100 17,836 (33.8) 283 (48.0) 13,783 (34.9) 4053 (30.7)Z100 34,856 (66.2) 306 (52.0) 25,724 (65.1) 9132 (69.3)AlcoholNo 1203 (2.3) 22 (3.7) 1011 (2.5) 192 (1.7)Yes 51,489 (97.7) 567 (96.3) 40,105 (97.5) 11,384 (98.3)Consumption (g/day) d 86.1)Risk occupation eNo 37,979 (72.0) 354 (60.1) 28,103 (71.1) 9876 (74.9)Yes 14,713 (28.0) 235 (39.9) 11,404 (28.9) 3309 (25.1)Radon at theaddress (Bq/m 3 )39.5 (9.2–98.6) 24.0 (8.8–92.1)NO x at front door f(mg/m 3 )21.8 (14.8–68.9) 23.9 (15.2–76.5) 23.4 (15.3–77.7) 17.4 (14.4–30.1)a Cut-off based on the 75th percentile for <strong>radon</strong> concentrations.b Based on work market affiliation, <strong>in</strong>come <strong>and</strong> education st<strong>and</strong>ards for the municipal each person lived <strong>in</strong> at enrolment.c Based on all ever-smokers.d Based on persons that consume alcohol.e Ever employed <strong>in</strong> an <strong>in</strong>dustry or job associated with higher risk for <strong>lung</strong> <strong>cancer</strong> employed for at least 1 year (see Methods Section for specification).f Time-weighted average for the period 1 January 1971 to censor<strong>in</strong>g date.Indeed, our crude IRRs were much lower than 1.00, <strong>in</strong>dicat<strong>in</strong>g anapparent protective association between <strong>radon</strong> on <strong>lung</strong> <strong>cancer</strong> <strong>and</strong>we observed a substantial effect of adjustment such that thisapparent protective association disappeared. However, such strongconfound<strong>in</strong>g <strong>in</strong> the crude model implies the risk for residualconfound<strong>in</strong>g <strong>in</strong> the adjusted model if the most <strong>in</strong>fluential confoundersare not perfectly adjusted for. Tobacco smok<strong>in</strong>g is by far themost important <strong>lung</strong> <strong>cancer</strong> risk factor (Williams <strong>and</strong> S<strong>and</strong>ler,2001); <strong>in</strong> the present study, smokers had a 9 times higher crude<strong>lung</strong> <strong>cancer</strong> <strong><strong>in</strong>cidence</strong> rate than non-smokers. To address the risk forresidual confound<strong>in</strong>g from smok<strong>in</strong>g, we repeated the analyses fornon-smokers, <strong>and</strong> found an <strong>in</strong>significant association between <strong>radon</strong><strong>and</strong> risk for <strong>lung</strong> <strong>cancer</strong> with an associated conv<strong>in</strong>c<strong>in</strong>g doseresponsepattern over the four quartiles of <strong>radon</strong> exposure. The lackof significant l<strong>in</strong>ear response amongst non-smokers was surpris<strong>in</strong>g,but only 99 non-smokers developed <strong>lung</strong> <strong>cancer</strong> <strong>and</strong> power constra<strong>in</strong>tsmay expla<strong>in</strong> this. In light of the f<strong>in</strong>d<strong>in</strong>gs amongst nonsmokers,the lack of association between <strong>radon</strong> <strong>and</strong> risk for <strong>lung</strong><strong>cancer</strong> among all study participants might be due to residualconfound<strong>in</strong>g from smok<strong>in</strong>g. Furthermore, the higher relative riskestimates for <strong>lung</strong> <strong>cancer</strong> <strong>in</strong> association with <strong>radon</strong> among nonsmokersthan smokers should be <strong>in</strong>terpreted along with the abovePlease cite this article as: Bräuner, E.V., et al., <strong>Residential</strong> <strong>radon</strong> <strong>and</strong> <strong>lung</strong> <strong>cancer</strong> <strong><strong>in</strong>cidence</strong> <strong>in</strong> a <strong>Danish</strong> <strong>cohort</strong>. Environ. Res. (2012), http://dx.doi.org/10.1016/j.envres.2012.05.012
E.V. Bräuner et al. / Environmental Research ] (]]]]) ]]]–]]] 5Table 2Incidence rate ratios for <strong>lung</strong> <strong>cancer</strong> associated with the concentration of <strong>radon</strong> at the residence.Radon (Bq/m 3 ) a All residencies b S<strong>in</strong>gle detached homes cIRR (95% CI)IRR (95% CI)Cases, n Model 1 d Model 2 d,e Cases, n Model 3 fAll personso17.6 228 1.00 1.00 63g17.6–39.5 151 0.74 (0.61–0.91) 0.98 (0.78–1.22) 46g39.5–66.1 112 0.56 (0.45–0.71) 1.02 (0.77–1.37) 45g466.1 98 0.48 (0.38–0.60) 0.98 (0.70–1.36) 76gL<strong>in</strong>ear trend per 100 Bq/m 3 589 0.39 (0.29–0.52) 1.04 (0.69–1.56) 230 1.14 (0.69–1.90)Smokero17.6 201 1.00 1.00 54g17.6–39.5 127 0.82 (0.66–1.02) 0.95 (0.75–1.21) 33g39.5–66.1 90 0.73 (0.57–0.93) 1.00 (0.72–1.37) 31g466.1 72 0.61 (0.46–0.80) 0.90 (0.62–1.30) 61gL<strong>in</strong>ear trend per 100 Bq/m 3 490 0.54 (0.39–0.75) 0.92 (0.58–1.46) 179 1.03 (0.58–1.84)Non-smokero17.6 27 1.00 1.00 9g17.6–39.5 24 0.91 (0.52–1.58) 1.16 (0.63–2.13) 13g39.5–66.1 22 0.78 (0.44–1.37) 1.25 (0.60–2.59) 14g466.1 26 0.85 (0.49–1.45) 1.48 (0.68–3.20) 15gL<strong>in</strong>ear trend per 100 Bq/m 3 99 0.82 (0.43–1.56) 1.67 (0.69–4.04) 51 1.71 (0.60–4.92)a Time-weighted average concentration of <strong>radon</strong> at residences from 1 January 1971 until censor<strong>in</strong>g. The cut-off po<strong>in</strong>ts between exposure groups were the 25th, 50th<strong>and</strong> 75th percentiles for all participants.b Analyses based on 52,692 <strong>cohort</strong> members, 589 <strong>lung</strong> <strong>cancer</strong>s <strong>and</strong> 506,492 person-years at risk.c Analyses based on 30,570 <strong>cohort</strong> members, 230 <strong>lung</strong> <strong>cancer</strong>s <strong>and</strong> 289,831 person-years at risk.d Adjusted for age by us<strong>in</strong>g it as time scale <strong>in</strong> the Cox model.e Adjusted for sex, BMI, length of school attendance, socio-economic status, smok<strong>in</strong>g status (<strong>in</strong>tensity <strong>and</strong> duration), environmental tobacco smoke, fruit <strong>in</strong>take,alcohol, residence type, employment <strong>in</strong> an <strong>in</strong>dustry or job associated with higher risk for <strong>lung</strong> <strong>cancer</strong> <strong>and</strong> traffic (time weighted average NO x exposure). See MethodsSection for specifications. Due to exclusion of <strong>cohort</strong> members with miss<strong>in</strong>g value <strong>in</strong> any covariate, the number of persons is identical <strong>in</strong> the crude <strong>and</strong> the adjustedanalyses.f As for model 2, but data restricted to persons liv<strong>in</strong>g <strong>in</strong> s<strong>in</strong>gle-detached home at enrolment.g We did not estimate IRRs because of too few cases.Table 3Adjusted a <strong><strong>in</strong>cidence</strong> rate ratios for <strong>lung</strong> <strong>cancer</strong> <strong>in</strong> association with a 100 Bq/m 3 <strong>in</strong>crease <strong>in</strong> domestic <strong>radon</strong> b with<strong>in</strong> strata of sex, NO x at the residential address, <strong>and</strong> ETS.Interaction variable Cases, n Cohort IRR (95% CI) P d Cases, n Non-smokers IRR (95% CI) P Cases, n Smokers IRR (95% CI) PSexMen 298 1.01 (0.62–1.64) 0.86 46 1.35 (0.44–4.11) 0.52 252 0.95 (0.55–1.63) 0.84Women 291 1.06 (0.64–1.77) 53 2.02 (0.70–5.76) 238 0.89 (0.49–1.61)NO x at front door (mg/m 3 )o21.8 359 1.23 (0.76–1.99) 0.26 48 1.80 (0.60–5.42) 0.92 311 1.14 (0.67–1.96) 0.17Z21.8 230 0.85 (0.49–1.50) 51 1.68 (0.54–5.23) 179 0.69 (0.36–1.33)ETSNo – – – 34 1.19 (0.34–4.20) 0.45 – – –Yes – – – 65 1.99 (0.74–5.33) – – –c Time weighted average for NO x .a We adjusted the analyses for sex, age (age used as time scale), BMI, length of school attendance, socio-economic status, smok<strong>in</strong>g status (<strong>in</strong>tensity <strong>and</strong> duration),environmental tobacco smoke, fruit <strong>in</strong>take, alcohol, residence type, employment <strong>in</strong> an <strong>in</strong>dustry or job associated with higher risk for <strong>lung</strong> <strong>cancer</strong> <strong>and</strong> traffic (time weightedaverage NOx exposure), see Methods Section for specifications. However, with no adjustment for the stratification variable.b Radon exposure was entered as a cont<strong>in</strong>uous variable <strong>in</strong> all models of the time-weighted average concentration at residences from 1 January 1971 untilcensor<strong>in</strong>g.d Test of the null hypothesis that the l<strong>in</strong>ear trends are identical, for Wald test for <strong>in</strong>teraction.mentioned n<strong>in</strong>e times higher crude rates amongst smokers. If <strong>radon</strong>causes an equal absolute number of <strong>lung</strong> cases among smokers <strong>and</strong>non-smokers, the relative risk estimates would appear higheramong non-smokers due to the lower crude <strong>cancer</strong> rates.The IRR of 1.67 (95% CI: 0.69–4.04) per 100 Bq/m 3 <strong>radon</strong>among non-smokers <strong>in</strong> the present study is <strong>in</strong> corroboration withresults of several other studies that report highest odds ratiosamongst non-smokers when compared to smokers (Darby et al.,1998; Field et al., 2000; Pershagen et al., 1992). Also the IRR of1.04 (95% CI: 0.69–1.56) for all participants <strong>in</strong> the present study is<strong>in</strong> l<strong>in</strong>e with the results of comb<strong>in</strong>ed studies <strong>in</strong> Europe (Darbyet al., 2005), Northern America (Krewski et al., 2005) <strong>and</strong> Ch<strong>in</strong>a(Lub<strong>in</strong> et al., 2004) which report odds ratios (95% CI) of 1.08 (95%CI: 1.03–1.15), 1.11 (95% CI: 1.00–1.28) <strong>and</strong> 1.33 (95% CI: 1.01–1.36) per 100 Bq/m 3 respectively. Thus, the results from Denmark,with lower residential <strong>radon</strong> concentrations than <strong>in</strong> most of theother study areas, show results which are generally <strong>in</strong> l<strong>in</strong>e withprevious studies of residential <strong>radon</strong> <strong>and</strong> risk for <strong>lung</strong> <strong>cancer</strong>.Sample size needs for <strong>in</strong>dividual studies of <strong>in</strong>door <strong>radon</strong> <strong>and</strong><strong>lung</strong> <strong>cancer</strong> under realistic scenarios have <strong>in</strong>dicated that thous<strong>and</strong>sof cases would be required to determ<strong>in</strong>e whether exposureto <strong>in</strong>door <strong>radon</strong> posed either no risk or a risk substantiallyPlease cite this article as: Bräuner, E.V., et al., <strong>Residential</strong> <strong>radon</strong> <strong>and</strong> <strong>lung</strong> <strong>cancer</strong> <strong><strong>in</strong>cidence</strong> <strong>in</strong> a <strong>Danish</strong> <strong>cohort</strong>. Environ. Res. (2012), http://dx.doi.org/10.1016/j.envres.2012.05.012
6E.V. Bräuner et al. / Environmental Research ] (]]]]) ]]]–]]]different from the risk projected on the basis of epidemiologicalstudies of underground m<strong>in</strong>ers (Lub<strong>in</strong>, 1994; Lub<strong>in</strong> et al., 1995).Our study <strong>in</strong>cluded 52,692 persons of which 589 developed <strong>lung</strong><strong>cancer</strong> <strong>and</strong> power constra<strong>in</strong>ts may expla<strong>in</strong> the lack of significanteffect estimates as well as affect the ability of detect<strong>in</strong>g effectmodification.Radon decay products easily attach to PM <strong>in</strong> the air (Tokonami,2000; Yu et al., 2001) <strong>and</strong> the attachment of <strong>radon</strong> decay productsto aerosols <strong>in</strong> the air reduces the fraction of the so-calledunattached <strong>radon</strong> decay products <strong>and</strong> <strong>in</strong>creases the airborneconcentration of attached <strong>radon</strong> decay products due to a significantreduction <strong>in</strong> the plate out on <strong>in</strong>door surfaces (Abu-Jarad,1997). Attachment furthermore significantly <strong>in</strong>fluences thedeposition pattern <strong>in</strong> the <strong>lung</strong>s due to the altered size distributionof the <strong>radon</strong> decay products (Bair, 1995). Radon <strong>and</strong> <strong>in</strong>doorparticles might, operate together <strong>and</strong> <strong>in</strong>fluence risk <strong>and</strong> we havepreviously reported a non-significant pattern of stronger associationsbetween <strong>radon</strong> <strong>and</strong> leukaemia among children liv<strong>in</strong>g atstreets with high traffic density (Bräuner et al., 2010). We, therefore,hypothesised that the presence of <strong>in</strong>door PM modifies theassociation between residential <strong>radon</strong> <strong>and</strong> risk of <strong>lung</strong> <strong>cancer</strong> <strong>and</strong>tested the hypothesis us<strong>in</strong>g outdoor traffic-related air pollution atthe residence which penetrates <strong>in</strong>doors (Schneider et al., 2004)<strong>and</strong> ETS (among non-smokers) as markers of <strong>in</strong>door PM. Ourresults do not support this theory, but power constra<strong>in</strong>ts made itdifficult to detect such modifications <strong>in</strong> the present study. Noprevious study has reported on a possible <strong>in</strong>teraction betweenresidential <strong>radon</strong> <strong>and</strong> traffic-related air pollution at the residence<strong>and</strong> one previous study reports an <strong>in</strong>significantly higher relativerisk for <strong>lung</strong> <strong>cancer</strong> <strong>in</strong> association with residential <strong>radon</strong> for thoseexposed to ETS (Lagarde et al., 2001). More work is needed toelucidate whether such an <strong>in</strong>teraction between <strong>in</strong>door <strong>radon</strong> <strong>and</strong>PM exists.5. ConclusionDespite weak statistical evidence aris<strong>in</strong>g from power constra<strong>in</strong>tsthe results of the present prospective <strong>cohort</strong> study arefully compatible with an association between residential <strong>radon</strong><strong>and</strong> risk for <strong>lung</strong> <strong>cancer</strong> as detected <strong>in</strong> three previous metaanalyses <strong>and</strong> provide important evidence at the low end of thelow end of the residential dose curve.AcknowledgmentDr Bräuner was supported by a Research Grant from The<strong>Danish</strong> Medical Research Council <strong>and</strong> the <strong>Danish</strong> Cancer Society.None of these foundations had a role <strong>in</strong> the design of the study,<strong>in</strong>terpretation of the results, or writ<strong>in</strong>g of the paper.Relevant <strong>Danish</strong> ethical committees <strong>and</strong> data protection agenciesapproved the study, <strong>and</strong> written <strong>in</strong>formed consent wasobta<strong>in</strong>ed from all participants.ReferencesAbu-Jarad, F., 1997. Indoor cigarette smok<strong>in</strong>g: Uranium contents <strong>and</strong> carrier of<strong>in</strong>door <strong>radon</strong> products. Radiat. Meas. 28, 579–584.Al-Zoughool, M., Krewski, D., 2009. Health effects of <strong>radon</strong>: a review of theliterature. Int. J. Radiat. Biol. 85, 57–69.Andersen, C.E., Ulbak, K., Damkjaer, A., Gravesen, P., 2001. [Radon i danske boliger:Kortlægn<strong>in</strong>g af l<strong>and</strong>s-, amts- og kommuneværdier].: Sundhedsstyrelsen, StatensInstitut for Strålehygiejne.Andersen, C.E., Raaschou-Nielsen, O., Andersen, H.P., L<strong>in</strong>d, M., Gravesen, P.,Thomsen, B.L., Ulbak, K., 2007. Prediction of 222 Rn <strong>in</strong> <strong>Danish</strong> dwell<strong>in</strong>gs us<strong>in</strong>ggeology <strong>and</strong> house construction <strong>in</strong>formation from central databases. Radiat.Prot. Dosim. 123, 83–94.Andersen, Z.J., Hvidberg, M., Jensen, S.S., Ketzel, M., Loft, S., Sørensen, M., Tjønnel<strong>and</strong>,A., Vervad, K., Aaschou-Nielsen, O., 2011. Chronic obstructive pulmonarydisease <strong>and</strong> long-term exposure to traffic-related air pollution: a <strong>cohort</strong> study.Am. J. Respir. Crit. Care Med. 183, 455–461.Bair, W.J., 1995. The ICRP human respiratory tract model for radiological protection.Radiat. Prot. Dosim. 60, 307–310.Berkowicz, R., Ketzel, M., Jensen, S.S., Hvidberg, M., Raaschou-Nielsen, O., 2007.Evaluation <strong>and</strong> application of OPSM for traffic pollution assessment for a largenumber of street locations. Environ. Modell. Softw.Bräuner, E.V., Andersen, C.E., Andersen, H.P., Gravesen, P., L<strong>in</strong>d, M., Ulbak, K.,Hertel, O., Schüz, J., Raaschou-Nielsen, O., 2010. Is there any <strong>in</strong>teractionbetween domestic <strong>radon</strong> exposure <strong>and</strong> air pollution from traffic <strong>in</strong> relationto childhood leukemia risk? Cancer Causes Control 21, 1961–1964.Darby, S., Hill, D., Doll, R., 2001. Radon: a likely carc<strong>in</strong>ogen at all exposures. Ann.Oncol. 12, 1341–1351.Darby, S., Whitley, E., Silcocks, P., Thakrar, B., Green, M., Lomas, P., Miles, J., Reeves,G., Fearn, T., Doll, R., 1998. Risk of <strong>lung</strong> <strong>cancer</strong> associated with residential<strong>radon</strong> exposure <strong>in</strong> south-west Engl<strong>and</strong>: a case-control study. Br. J. Cancer 78,394–408.Darby, S., Hill, D., Auv<strong>in</strong>en, A., Barros-Dios, J.M., Baysson, H., Bochicchio, F., Deo, H.,Falk, R., Forastiere, F., Hakama, M., Heid, I., Kreienbrock, L., Kreuzer, M.,Lagarde, F., Makela<strong>in</strong>en, I., Muirhead, C., Oberaigner, W., Pershagen, G.,Ruano-Rav<strong>in</strong>a, A., Ruosteenoja, E., Rosario, A.S., Tirmarche, M., Tomasek, L.,Whitley, E., Wichmann, H.E., Doll, R., 2005. Radon <strong>in</strong> homes <strong>and</strong> risk of <strong>lung</strong><strong>cancer</strong>: collaborative analysis of <strong>in</strong>dividual data from 13 European casecontrolstudies. BMJ 330, 223.Field, R.W., Steck, D.J., Smith, B.J., Brus, C.P., Fisher, E.L., Neuberger, J.S., Platz, C.E.,Rob<strong>in</strong>son, R.A., Woolson, R.F., Lynch, C.F., 2000. <strong>Residential</strong> <strong>radon</strong> gas exposure<strong>and</strong> <strong>lung</strong> <strong>cancer</strong>: the Iowa <strong>radon</strong> <strong>lung</strong> <strong>cancer</strong> study. Am. J. Epidemiol. 151,1091–1102.Hertel, O., Jensen, S.S., Andersen, H.V., Palmgren, F., Wåhl<strong>in</strong>, P., Skov, H., Nielsen, I.V.,Sørensen, M., Loft, S., Raaschou-Nielsen, O., 2001. Human exposure to trafficpollution. Experience from <strong>Danish</strong> studies. Pure Appl. Chem. 73, 137–145.International Agency for Research on Cancer (IARC), 1988. Monographs on theevaluation of carc<strong>in</strong>ogenic risks to humans. Man-Made M<strong>in</strong>eral Fibres <strong>and</strong>Radon, vol. 43. International Agency for Research on Cancer 1988, Lyon France.International Agency for Research on Cancer (IARC), 2001. Monographs on theevaluation of carc<strong>in</strong>ogenic risks to humans. Ioniz<strong>in</strong>g Radiation Part 2. SomeInternally Deposited Radionuclides, vol. 78. International Agency for Researchon Cancer 2001, Lyon France.International Agency for Research on Cancer (IARC), 2004. Monographs on theevaluation of carc<strong>in</strong>ogenic risks to humans, Tobacco Smoke <strong>and</strong> InvoluntarySmok<strong>in</strong>g. International Agency for Research on Cancer 2004, Lyon France.Jensen, S.S., Berkowicz, R., Hansen, H.S., Hertel, O., 2001. A <strong>Danish</strong> decisionsupportGIS tool for management of urban air quality <strong>and</strong> human exposures.Transp. Res. D: Transp. Environ. 6, 229–241.Kakosimos, K.E., Hertel, O., Ketzel, M., Berkowicz, R., 2010. Operational streetpollution model (OSPM) GC- ô a review of performed application <strong>and</strong> validationstudies, <strong>and</strong> future prospects. Environ. Chem. 7, 485–503.Ketzel, M., Wåhl<strong>in</strong>, P., Berkowicz, R., Palmgren, F., 2003. Particle <strong>and</strong> trace gasemission factors under urban driv<strong>in</strong>g conditions <strong>in</strong> Copenhagen based onstreet <strong>and</strong> roof-level observations. Atmos. Environ. 37, 2735–2749.Krewski, D., Lub<strong>in</strong>, J.H., Ziel<strong>in</strong>ski, J.M., Alavanja, M., Catalan, V.S., Field, R.W., Klotz,J.B., Letourneau, E.G., Lynch, C.F., Lyon, J.I., S<strong>and</strong>ler, D.P., Schoenberg, J.B., Steck,D.J., Stolwijk, J.A., We<strong>in</strong>berg, C., Wilcox, H.B., 2005. <strong>Residential</strong> <strong>radon</strong> <strong>and</strong> riskof <strong>lung</strong> <strong>cancer</strong>: a comb<strong>in</strong>ed analysis of 7 North American case-control studies.Epidemiology 16, 137–145.Lagarde, F., Axelsson, G., Damber, L., Mell<strong>and</strong>er, H., Nyberg, F., Pershagen, G., 2001.<strong>Residential</strong> <strong>radon</strong> <strong>and</strong> <strong>lung</strong> <strong>cancer</strong> among never-smokers <strong>in</strong> Sweden. Epidemiology12, 396–404.Little, M.P., Wakeford, R., Lub<strong>in</strong>, J.H., Kendall, G.M., 2010. The statistical power ofepidemiological studies analyz<strong>in</strong>g the relationship between exposure toioniz<strong>in</strong>g radiation <strong>and</strong> <strong>cancer</strong>, with special reference to childhood leukemia<strong>and</strong> natural background radiation. Radiat. Res. 174, 387–402.Lub<strong>in</strong>, J.H., 1994. Invited commentary: <strong>lung</strong> <strong>cancer</strong> <strong>and</strong> exposure to residential<strong>radon</strong>. Am. J. Epidemiol. 140, 323–332.Lub<strong>in</strong>, J.H., Boice Jr., J.D., Samet, J.M., 1995. Errors <strong>in</strong> exposure assessment,statistical power <strong>and</strong> the <strong>in</strong>terpretation of residential <strong>radon</strong> studies. Radiat.Res. 144, 329–341.Lub<strong>in</strong>, J.H., Wang, Z.Y., Boice Jr., J.D., Xu, Z.Y., Blot, W.J., De, W.L., Kle<strong>in</strong>erman, R.A.,2004. Risk of <strong>lung</strong> <strong>cancer</strong> <strong>and</strong> residential <strong>radon</strong> <strong>in</strong> Ch<strong>in</strong>a: pooled results of twostudies. Int. J. Cancer 109, 132–137.National Research Council (NRC), 1999. Health effects of exposure to <strong>radon</strong>.Committee on the Biological Effects of Ioniz<strong>in</strong>g Radiations.Pershagen, G., Akerblom, G., Axelson, O., Clavensjo, B., Damber, L., Desai, G., Enflo,A., Lagarde, F., Mell<strong>and</strong>er, H., Svartengren, M., 1994. <strong>Residential</strong> <strong>radon</strong>exposure <strong>and</strong> <strong>lung</strong> <strong>cancer</strong> <strong>in</strong> Sweden. N. Engl. J. Med. 330, 159–164.Pershagen, G., Liang, Z.H., Hrubec, Z., Svensson, C., Boice Jr., J.D., 1992. <strong>Residential</strong><strong>radon</strong> exposure <strong>and</strong> <strong>lung</strong> <strong>cancer</strong> <strong>in</strong> Swedish women. Health Phys. 63, 179–186.Raaschou-Nielsen, O., 2008. Indoor <strong>radon</strong> <strong>and</strong> childhood leukaemia. Radiat. Prot.Dosim. 132, 175–181.Raaschou-Nielsen, O., Andersen, Z.J., Hvidberg, M., Jensen, S.S., Ketzel, M., Sorensen,M., Hansen, J., Loft, S., Overvad, K., Tjonnel<strong>and</strong>, A., 2011a. Air pollution fromtraffic <strong>and</strong> <strong>cancer</strong> <strong><strong>in</strong>cidence</strong>: a <strong>Danish</strong> <strong>cohort</strong> study. Environ. Health 10, 67.Raaschou-Nielsen, O., Andersen, Z.J., Hvidberg, M., Jensen, S.S., Ketzel, M., Sorensen,M., Loft, S., Overvad, K., Tjonnel<strong>and</strong>, A., 2011b. Lung <strong>cancer</strong> <strong><strong>in</strong>cidence</strong>Please cite this article as: Bräuner, E.V., et al., <strong>Residential</strong> <strong>radon</strong> <strong>and</strong> <strong>lung</strong> <strong>cancer</strong> <strong><strong>in</strong>cidence</strong> <strong>in</strong> a <strong>Danish</strong> <strong>cohort</strong>. Environ. Res. (2012), http://dx.doi.org/10.1016/j.envres.2012.05.012
E.V. Bräuner et al. / Environmental Research ] (]]]]) ]]]–]]] 7<strong>and</strong> long-term exposure to air pollution from traffic. Environ. Health Perspect.119, 860–865.Samet, J.M., vila-Tang, E., Boffetta, P., Hannan, L.M., Olivo-Marston, S., Thun, M.J.,Rud<strong>in</strong>, C.M., 2009. Lung <strong>cancer</strong> <strong>in</strong> never smokers: cl<strong>in</strong>ical epidemiology <strong>and</strong>environmental risk factors. Cl<strong>in</strong>. Cancer Res. 15, 5626–5645.Schneider, T., Jensen, K.A., Clausen, P.A., Afshari, A., Gunnarsen, L., Wåhl<strong>in</strong>, P.,Palmgren, F., Nielsen, O.J., Fogh, C.L., 2004. Prediction of <strong>in</strong>door concentrationof 0.5-4mm particles of outdoor orig<strong>in</strong> <strong>in</strong> an un<strong>in</strong>habited apartment. Atmos.Environ. 38, 6349–6359.Storm, H.H., Michelsen, E.V., Clemmensen, I.H., Pihl, J., 1997. The <strong>Danish</strong> CancerRegistry–history, content, quality <strong>and</strong> use. Dan. Med. Bull. 44, 535–539.Thiebaut, A.C., Benichou, J., 2004. Choice of time-scale <strong>in</strong> Cox’s model analysis ofepidemiologic <strong>cohort</strong> data: a simulation study. Stat. Med. 23, 3803–3820.Tjønnel<strong>and</strong>, A., Olsen, A., Boll, K., Stripp, C., Christensen, J., Engholm, G., Overvad,K., 2007. Study design, exposure variables, <strong>and</strong> socioeconomic determ<strong>in</strong>ants ofparticipation <strong>in</strong> Diet, Cancer <strong>and</strong> Health: a population-based prospective<strong>cohort</strong> study of 57,053 men <strong>and</strong> women <strong>in</strong> Denmark. Sc<strong>and</strong>. J. Public Health35, 432–441.Tokonami, S., 2000. Experimental verification of the attachment theory of <strong>radon</strong>progeny onto ambient aerosols. Health Phys. 78, 74–79.Tomasek, L., Kunz, E., Muller, T., Hulka, J., Heribanova, A., Matzner, J., Placek, V.,Burian, I., Holecek, J., 2001. Radon exposure <strong>and</strong> <strong>lung</strong> <strong>cancer</strong> risk—Czech<strong>cohort</strong> study on residential <strong>radon</strong>. Sci. Total Environ. 272, 43–51.Turner, M.C., Krewski, D., Chen, Y., Pope III, C.A., Gapstur, S., Thun, M.J., 2011.Radon <strong>and</strong> <strong>lung</strong> <strong>cancer</strong> <strong>in</strong> the American <strong>cancer</strong> society <strong>cohort</strong>. Cancer.Epidemiol. Biomarkers Prev. 20, 438–448.Wang, Z., Lub<strong>in</strong>, J.H., Wang, L., Zhang, S., Boice Jr., J.D., Cui, H., Zhang, S., Conrath, S.,Xia, Y., Shang, B., Brenner, A., Lei, S., Metayer, C., Cao, J., Chen, K.W., Lei, S.,Kle<strong>in</strong>erman, R.A., 2002. <strong>Residential</strong> <strong>radon</strong> <strong>and</strong> <strong>lung</strong> <strong>cancer</strong> risk <strong>in</strong> a highexposurearea of Gansu Prov<strong>in</strong>ce, Ch<strong>in</strong>a. Am. J. Epidemiol. 155, 554–564.Williams, M.D., S<strong>and</strong>ler, A.B., 2001. The epidemiology of <strong>lung</strong> <strong>cancer</strong>. Cancer Treat.Res. 105, 31–52.Yu, K.N., Wong, B.T.Y., Lau, B.M.F., Nikezic, D., 2001. Indoor dose conversioncoefficients for <strong>radon</strong> progeny for different ambient environments. Environ.Sci. Technol. 35, 2136–2140.Please cite this article as: Bräuner, E.V., et al., <strong>Residential</strong> <strong>radon</strong> <strong>and</strong> <strong>lung</strong> <strong>cancer</strong> <strong><strong>in</strong>cidence</strong> <strong>in</strong> a <strong>Danish</strong> <strong>cohort</strong>. Environ. Res. (2012), http://dx.doi.org/10.1016/j.envres.2012.05.012