Residential radon and lung cancer incidence in a Danish cohort - VBN
Residential radon and lung cancer incidence in a Danish cohort - VBN
Residential radon and lung cancer incidence in a Danish cohort - VBN

You also want an ePaper? Increase the reach of your titles
YUMPU automatically turns print PDFs into web optimized ePapers that Google loves.
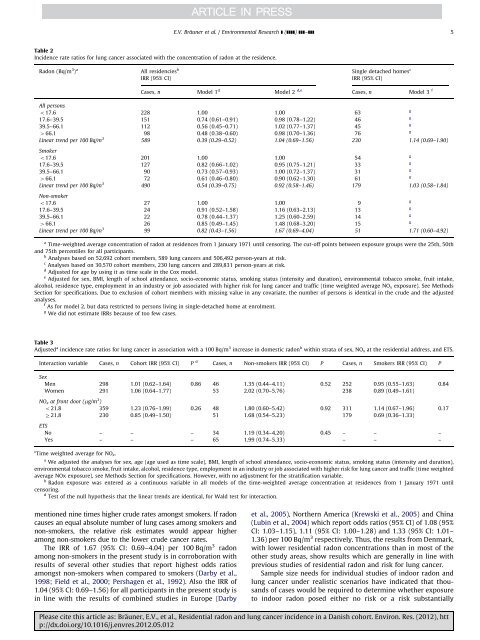
E.V. Bräuner et al. / Environmental Research ] (]]]]) ]]]–]]] 5Table 2Incidence rate ratios for <strong>lung</strong> <strong>cancer</strong> associated with the concentration of <strong>radon</strong> at the residence.Radon (Bq/m 3 ) a All residencies b S<strong>in</strong>gle detached homes cIRR (95% CI)IRR (95% CI)Cases, n Model 1 d Model 2 d,e Cases, n Model 3 fAll personso17.6 228 1.00 1.00 63g17.6–39.5 151 0.74 (0.61–0.91) 0.98 (0.78–1.22) 46g39.5–66.1 112 0.56 (0.45–0.71) 1.02 (0.77–1.37) 45g466.1 98 0.48 (0.38–0.60) 0.98 (0.70–1.36) 76gL<strong>in</strong>ear trend per 100 Bq/m 3 589 0.39 (0.29–0.52) 1.04 (0.69–1.56) 230 1.14 (0.69–1.90)Smokero17.6 201 1.00 1.00 54g17.6–39.5 127 0.82 (0.66–1.02) 0.95 (0.75–1.21) 33g39.5–66.1 90 0.73 (0.57–0.93) 1.00 (0.72–1.37) 31g466.1 72 0.61 (0.46–0.80) 0.90 (0.62–1.30) 61gL<strong>in</strong>ear trend per 100 Bq/m 3 490 0.54 (0.39–0.75) 0.92 (0.58–1.46) 179 1.03 (0.58–1.84)Non-smokero17.6 27 1.00 1.00 9g17.6–39.5 24 0.91 (0.52–1.58) 1.16 (0.63–2.13) 13g39.5–66.1 22 0.78 (0.44–1.37) 1.25 (0.60–2.59) 14g466.1 26 0.85 (0.49–1.45) 1.48 (0.68–3.20) 15gL<strong>in</strong>ear trend per 100 Bq/m 3 99 0.82 (0.43–1.56) 1.67 (0.69–4.04) 51 1.71 (0.60–4.92)a Time-weighted average concentration of <strong>radon</strong> at residences from 1 January 1971 until censor<strong>in</strong>g. The cut-off po<strong>in</strong>ts between exposure groups were the 25th, 50th<strong>and</strong> 75th percentiles for all participants.b Analyses based on 52,692 <strong>cohort</strong> members, 589 <strong>lung</strong> <strong>cancer</strong>s <strong>and</strong> 506,492 person-years at risk.c Analyses based on 30,570 <strong>cohort</strong> members, 230 <strong>lung</strong> <strong>cancer</strong>s <strong>and</strong> 289,831 person-years at risk.d Adjusted for age by us<strong>in</strong>g it as time scale <strong>in</strong> the Cox model.e Adjusted for sex, BMI, length of school attendance, socio-economic status, smok<strong>in</strong>g status (<strong>in</strong>tensity <strong>and</strong> duration), environmental tobacco smoke, fruit <strong>in</strong>take,alcohol, residence type, employment <strong>in</strong> an <strong>in</strong>dustry or job associated with higher risk for <strong>lung</strong> <strong>cancer</strong> <strong>and</strong> traffic (time weighted average NO x exposure). See MethodsSection for specifications. Due to exclusion of <strong>cohort</strong> members with miss<strong>in</strong>g value <strong>in</strong> any covariate, the number of persons is identical <strong>in</strong> the crude <strong>and</strong> the adjustedanalyses.f As for model 2, but data restricted to persons liv<strong>in</strong>g <strong>in</strong> s<strong>in</strong>gle-detached home at enrolment.g We did not estimate IRRs because of too few cases.Table 3Adjusted a <strong><strong>in</strong>cidence</strong> rate ratios for <strong>lung</strong> <strong>cancer</strong> <strong>in</strong> association with a 100 Bq/m 3 <strong>in</strong>crease <strong>in</strong> domestic <strong>radon</strong> b with<strong>in</strong> strata of sex, NO x at the residential address, <strong>and</strong> ETS.Interaction variable Cases, n Cohort IRR (95% CI) P d Cases, n Non-smokers IRR (95% CI) P Cases, n Smokers IRR (95% CI) PSexMen 298 1.01 (0.62–1.64) 0.86 46 1.35 (0.44–4.11) 0.52 252 0.95 (0.55–1.63) 0.84Women 291 1.06 (0.64–1.77) 53 2.02 (0.70–5.76) 238 0.89 (0.49–1.61)NO x at front door (mg/m 3 )o21.8 359 1.23 (0.76–1.99) 0.26 48 1.80 (0.60–5.42) 0.92 311 1.14 (0.67–1.96) 0.17Z21.8 230 0.85 (0.49–1.50) 51 1.68 (0.54–5.23) 179 0.69 (0.36–1.33)ETSNo – – – 34 1.19 (0.34–4.20) 0.45 – – –Yes – – – 65 1.99 (0.74–5.33) – – –c Time weighted average for NO x .a We adjusted the analyses for sex, age (age used as time scale), BMI, length of school attendance, socio-economic status, smok<strong>in</strong>g status (<strong>in</strong>tensity <strong>and</strong> duration),environmental tobacco smoke, fruit <strong>in</strong>take, alcohol, residence type, employment <strong>in</strong> an <strong>in</strong>dustry or job associated with higher risk for <strong>lung</strong> <strong>cancer</strong> <strong>and</strong> traffic (time weightedaverage NOx exposure), see Methods Section for specifications. However, with no adjustment for the stratification variable.b Radon exposure was entered as a cont<strong>in</strong>uous variable <strong>in</strong> all models of the time-weighted average concentration at residences from 1 January 1971 untilcensor<strong>in</strong>g.d Test of the null hypothesis that the l<strong>in</strong>ear trends are identical, for Wald test for <strong>in</strong>teraction.mentioned n<strong>in</strong>e times higher crude rates amongst smokers. If <strong>radon</strong>causes an equal absolute number of <strong>lung</strong> cases among smokers <strong>and</strong>non-smokers, the relative risk estimates would appear higheramong non-smokers due to the lower crude <strong>cancer</strong> rates.The IRR of 1.67 (95% CI: 0.69–4.04) per 100 Bq/m 3 <strong>radon</strong>among non-smokers <strong>in</strong> the present study is <strong>in</strong> corroboration withresults of several other studies that report highest odds ratiosamongst non-smokers when compared to smokers (Darby et al.,1998; Field et al., 2000; Pershagen et al., 1992). Also the IRR of1.04 (95% CI: 0.69–1.56) for all participants <strong>in</strong> the present study is<strong>in</strong> l<strong>in</strong>e with the results of comb<strong>in</strong>ed studies <strong>in</strong> Europe (Darbyet al., 2005), Northern America (Krewski et al., 2005) <strong>and</strong> Ch<strong>in</strong>a(Lub<strong>in</strong> et al., 2004) which report odds ratios (95% CI) of 1.08 (95%CI: 1.03–1.15), 1.11 (95% CI: 1.00–1.28) <strong>and</strong> 1.33 (95% CI: 1.01–1.36) per 100 Bq/m 3 respectively. Thus, the results from Denmark,with lower residential <strong>radon</strong> concentrations than <strong>in</strong> most of theother study areas, show results which are generally <strong>in</strong> l<strong>in</strong>e withprevious studies of residential <strong>radon</strong> <strong>and</strong> risk for <strong>lung</strong> <strong>cancer</strong>.Sample size needs for <strong>in</strong>dividual studies of <strong>in</strong>door <strong>radon</strong> <strong>and</strong><strong>lung</strong> <strong>cancer</strong> under realistic scenarios have <strong>in</strong>dicated that thous<strong>and</strong>sof cases would be required to determ<strong>in</strong>e whether exposureto <strong>in</strong>door <strong>radon</strong> posed either no risk or a risk substantiallyPlease cite this article as: Bräuner, E.V., et al., <strong>Residential</strong> <strong>radon</strong> <strong>and</strong> <strong>lung</strong> <strong>cancer</strong> <strong><strong>in</strong>cidence</strong> <strong>in</strong> a <strong>Danish</strong> <strong>cohort</strong>. Environ. Res. (2012), http://dx.doi.org/10.1016/j.envres.2012.05.012