Reverberation Mapping of Active Galactic Nuclei as a Cosmological ...
Reverberation Mapping of Active Galactic Nuclei as a Cosmological ...
Reverberation Mapping of Active Galactic Nuclei as a Cosmological ...

Create successful ePaper yourself
Turn your PDF publications into a flip-book with our unique Google optimized e-Paper software.
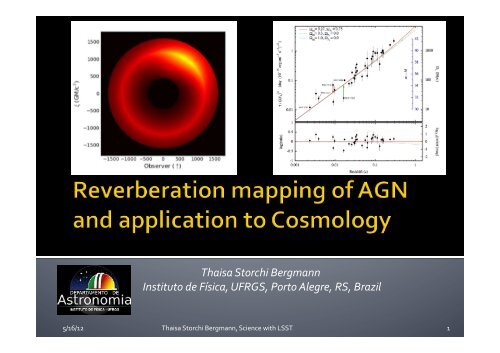
Thaisa Storchi Bergmann Instituto de Física, UFRGS, Porto Alegre, RS, Brazil 5/16/12 Thaisa Storchi Bergmann, Science with LSST 1
¡ Jáderson Schimoia ¡ Rodrigo Nemmen ¡ Michael Eracleous (Penn State) ¡ Claudia Winge (Gemini) ¡ Bradley Peterson (OSU, <strong>Reverberation</strong> mapping specialist) 5/16/12 Thaisa Storchi Bergmann, Science with LSST 2
¡ The c<strong>as</strong>e <strong>of</strong> NGC1097: variation <strong>of</strong> broad double-‐peaked Hα pr<strong>of</strong>ile (20 yrs!) ¡ Accretion disk <strong>as</strong> origin <strong>of</strong> the double-‐peaked pr<strong>of</strong>ile ¡ <strong>Reverberation</strong> in the accretion disk <strong>of</strong> NGC1097 ¡ <strong>Reverberation</strong> mapping <strong>of</strong> AGN in general ¡ Application to Cosmology 5/16/12 Thaisa Storchi Bergmann, Science with LSST 3
5/16/12 Thaisa Storchi Bergmann, Science with LSST 4
Discovery <strong>of</strong> broad (10,000km/s), double-‐peaked Hα pr<strong>of</strong>ile from the LINER nucleus <strong>of</strong> NGC 1097 Interpretation: emission from accretion disk, or ring (known for cataclismic variables) 5/16/12 Thaisa Storchi Bergmann, Science with LSST 5
Yearly observations 1991-‐2001: variations <strong>of</strong> total flux, width, relative intensities <strong>of</strong> the blue and red peaks: model <strong>of</strong> a ring with one-‐armed spiral. 5/16/12 Thaisa Storchi Bergmann, Science with LSST 6
Emissivity: R (R g ) § Best fit parameters: ξ 1 = 450 R g ξ 2 = 1600 R g ; p=-‐50° δ=70° σ=1200 km/s R (R g ) § Change in relative intensity <strong>of</strong> the peaks due to rotation <strong>of</strong> the spiral 5/16/12 Thaisa Storchi Bergmann, Science with LSST 7
§ Change in total flux and width <strong>of</strong> the pr<strong>of</strong>iles due to change in emissivity 5/16/12 Thaisa Storchi Bergmann, Science with LSST 8
Gemini GMOS, long-‐slit 5/16/12 Thaisa Storchi Bergmann, Science with LSST 9
2010-‐2011: Gemini “poor weather” compared with 1991 pr<strong>of</strong>ile: § Reversal in relative intensities <strong>of</strong> two peaks in 5 months § “Flare” in Dez. 2010 § Quick decre<strong>as</strong>e in flux, with changes in a week timescale Comparison with 1991 pr<strong>of</strong>ile 5/16/12 Thaisa Storchi Bergmann, Science with LSST 10
Models <strong>of</strong> one-‐armed spiral <strong>as</strong> in SB2003, with “broken” emissivity law: Best fit parameters: ξ 1 = 450 R g ξ 2 = 1600 R g ; p=-‐50° δ=70° σ=1200 km/s q1=-‐2 q2=3 Varying parameters: ξ q , A, Φ 0 5/16/12 Thaisa Storchi Bergmann, Science with LSST 11
Cartoon: sequence <strong>of</strong> models: rotation <strong>of</strong> the spiral and change in emissivity Corresponding modeled pr<strong>of</strong>iles compared with data 5/16/12 Thaisa Storchi Bergmann, Science with LSST 12
Further results: § Rotation period <strong>of</strong> the spiral: 17.5±1 months § Inverse correlation between velocity difference <strong>of</strong> the peaks and integrated line flux: -‐> response to ionizing flux coming from the inner regions (reverberation): (1) stronger flux ionizes farther away (lower velocities) and pr<strong>of</strong>ile is narrower; (2) weaker flux reaches regions closer to the source and pr<strong>of</strong>ile is broader 5/16/12 Thaisa Storchi Bergmann, Science with LSST 13
SED (in particular, X-‐rays) well described by RIAF (Radiatively Inneficient Accretion Flow): inner RIAF drives the line emission in the disk; Next step: reverberation mapping: observations in X-‐rays, UV and optical continuum simultaneous to spectroscopy to cross-‐correlate with variations in the pr<strong>of</strong>ile Prediction: ~7 days delay (mean radius <strong>of</strong> the ring is about 7 light-‐days) -‐> independent me<strong>as</strong>ure <strong>of</strong> the m<strong>as</strong>s <strong>of</strong> the SMBH 5/16/12 Thaisa Storchi Bergmann, Science with LSST 14
<strong>Reverberation</strong> in a “double-‐peaker”: Shapovalova et al. 2001: § Flux variation in Hβ lag the one in the continuum (5100A) -‐> delay is a me<strong>as</strong>ure <strong>of</strong> the mean radius <strong>of</strong> the emitting ring -‐> me<strong>as</strong>ure <strong>of</strong> the black hole m<strong>as</strong>s § Inverse correlation between flux and width <strong>of</strong> the pr<strong>of</strong>ile, <strong>as</strong> in NGC1097 5/16/12 Thaisa Storchi Bergmann, Science with LSST 15
1. LSST light curves in the continuum <strong>of</strong> sample <strong>of</strong> “double-‐peakers” can be used together with spectroscopic monitoring (restricted wavelength range) to allow reverberation mapping 2. Pr<strong>of</strong>ile variations are strongest when fluxes are highest -‐> LSST observations to spot incre<strong>as</strong>e in continuum flux and trigger spectroscopic follow up 5/16/12 Thaisa Storchi Bergmann, Science with LSST 16
Bradley Peterson and collaborators: Simultaneous observation <strong>of</strong> the continuum from nuclear source and broad lines from g<strong>as</strong> at a distance r (the so-‐called Broad Line Region – BLR): Radiation fl<strong>as</strong>h <strong>of</strong> a central source at t=0 will illuminate (ionize) g<strong>as</strong> at a distance r after a time delay: Thus delay is a me<strong>as</strong>ure <strong>of</strong> the distance <strong>of</strong> the emitting clouds: R BLR 5/16/12 Thaisa Storchi Bergmann, Science with LSST 17
Peterson 2000’s: Seyfert 1 galaxy NGC5548: spectra at “high” and “low” states 5/16/12 Thaisa Storchi Bergmann, Science with LSST 18
Clavel et al. 1992, Peterson 2001: § Variation <strong>of</strong> emission-‐line fluxes lag variation <strong>of</strong> the continuum; § Delay determined by peak <strong>of</strong> cross-correlation function: 20 days for Hβ and 7 days for CIV (UV) -‐> sizes <strong>of</strong> corresponding emitting regions 5/16/12 Thaisa Storchi Bergmann, Science with LSST 19
Peterson 2010: ~50 AGN K<strong>as</strong>pi (2000,2005); Bentz et al. 2009: Size vs. Lum. relation: R BLR α L 0.5 Expected for U and n e constant (U α L/R 2 n e ) Me<strong>as</strong>uring R BLR -‐> L(5100A) Luminosity distance! Denney et al. 2010 5/16/12 Thaisa Storchi Bergmann, Science with LSST 20
Watson et al. 2011: delay τ -‐> R BLR -‐> L -‐> D L 5/16/12 Thaisa Storchi Bergmann, Science with LSST 21
Watson et al. 2011: Using CIV (1549A) in the UV: varying QSOs can be observed in the optical up to z~4, much farther than SNe’s Lags are larger for QSOs (plus time dilation), but shorter for CIV than Hβ 5/16/12 Thaisa Storchi Bergmann, Science with LSST 22
1. LSST light curves <strong>of</strong> sample <strong>of</strong> QSOs can be used together with spectroscopic monitoring to allow reverberation mapping -‐> SMBH m<strong>as</strong>ses 2. Pr<strong>of</strong>ile variations are strongest when fluxes are highest -‐> LSST observations to spot incre<strong>as</strong>e in continuum flux and trigger spectroscopic follow up 3. Delays -‐> R BLR -‐> D L <strong>of</strong> QSOs up to z=4 5/16/12 Thaisa Storchi Bergmann, Science with LSST 23