Proceedings Crop Protection in Northern Britain 2002 - SASA
Proceedings Crop Protection in Northern Britain 2002 - SASA
Proceedings Crop Protection in Northern Britain 2002 - SASA

Create successful ePaper yourself
Turn your PDF publications into a flip-book with our unique Google optimized e-Paper software.
THE EFFECT OF RAINFALL AND TEMPERATURE ON THE INCIDENCE OF SEED-BORNE MICRODOCHIUM NIVALE ON WINTER WHEAT IN SCOTLAND 1991 –2000V Cockerell and M A JacksScottish Agricultural Science AgencyEast Craigs, EDINBURGH, EH12 8NJA M I RobertsBiomathematics and Statistics ScotlandJCMB, K<strong>in</strong>gs Build<strong>in</strong>gs, EDINBURGH, EH9 3JZSummary: An analysis of disease test results from w<strong>in</strong>ter wheat seed samplessubmitted to the Official Seed Test<strong>in</strong>g Station for Scotland between 1991 and2000 showed that the <strong>in</strong>cidence of seed-borne M. nivale fluctuated from year toyear with average <strong>in</strong>fection rang<strong>in</strong>g from 3% <strong>in</strong> 1995 to 42% <strong>in</strong> 1997. In eight ofthe ten years exam<strong>in</strong>ed average <strong>in</strong>fection was higher than the 5% advisorythreshold. In the two years when the average <strong>in</strong>fection level was below 5% therewere samples that exceeded this threshold. There appears to be no real regionaldifferences <strong>in</strong> <strong>in</strong>cidence of M. nivale seed <strong>in</strong>fection <strong>in</strong> the ma<strong>in</strong> wheat grow<strong>in</strong>gareas of Scotland. The correlation between mean <strong>in</strong>fection with M. nivale andtotal ra<strong>in</strong>fall dur<strong>in</strong>g the period 15 May – 30 June was 0.74 (p=0.015). The meanlevel of <strong>in</strong>fection generally <strong>in</strong>creased with <strong>in</strong>creas<strong>in</strong>g ra<strong>in</strong>fall. However, the year2000 was <strong>in</strong>consistent with the general relationship, hav<strong>in</strong>g low <strong>in</strong>fection levels <strong>in</strong>a year with high ra<strong>in</strong>fall. There did not appear to be a relationship between meanM. nivale levels and mean temperature for the same period 15 May – 30 June.INTRODUCTIONMicrodochium nivale (Fusarium nivale) is the seed-borne pathogen with the greatest potentialto cause pre-emergence blight of cereal seed <strong>in</strong> Scotland. Both Cockerell (1995) andHumphreys et al. (1995) have shown that the emergence of untreated w<strong>in</strong>ter wheat seed isrelated to levels of M. nivale on the seed. As seed <strong>in</strong>fection <strong>in</strong>creases emergence decreases.Although at present, most w<strong>in</strong>ter wheat seed lots <strong>in</strong> Scotland are sown with a seed treatmentto control M. nivale, surveys of pesticide usage, on w<strong>in</strong>ter wheat, have shown a 2% <strong>in</strong>crease(from 1%-3%) <strong>in</strong> the area sown untreated between 1998 and 2000 (Snowden & Thomas 1999,Kerr and Snowden 2001). Possible reasons for growers to sow seed untreated are: 1) an<strong>in</strong>creas<strong>in</strong>g <strong>in</strong>terest <strong>in</strong> treat<strong>in</strong>g seed only when disease levels exceed an advisory threshold of5% M. nivale (Cockerell 1995); 2) a drive to cut variable costs; and 3) an <strong>in</strong>crease <strong>in</strong> thedemand for organically grown wheat. The threshold of 5% is used by advisors to determ<strong>in</strong>ewhen seed treatment is required. With a result of less than or equal to 5% it is considered assafe to sow seed untreated <strong>in</strong> certa<strong>in</strong> circumstances.
Accord<strong>in</strong>g to Hewett (1965), seed produced <strong>in</strong> the north and west of the UK tends to be moreheavily <strong>in</strong>fected with M. nivale than seed from the south and east. Similarly, an analysis ofsix years data (1994-1999) from samples submitted to the Official Seed Test<strong>in</strong>g Station forEngland and Wales, showed variation between regions with samples from the north andsouth-west of England most likely to be more heavily <strong>in</strong>fected (Kenyon and Thomas, 2001).In contrast, a survey of cereal seed-borne diseases from 1992-94, showed levels of <strong>in</strong>fectionrecorded on Scottish produced wheat seed were lower than those on seed produced <strong>in</strong> England(Cockerell & Rennie, 1996).In order to provide the Scottish Executive Environment and Rural Affairs Department(SEERAD) with <strong>in</strong>formation on cereal seed-borne pathogen levels <strong>in</strong> Scotland the OfficialSeed test<strong>in</strong>g Station for Scotland (OSTS) collates data from seed samples submitted fortest<strong>in</strong>g by growers and producers. Although limited, this <strong>in</strong>formation can then be used to helpdeterm<strong>in</strong>e the extent of disease <strong>in</strong>cidence and trends that may be associated with changes toagronomic practice and climate.Seed samplesMATERIALS AND METHODSW<strong>in</strong>ter wheat samples submitted to the OSTS for disease analysis and a random selection ofsamples submitted for germ<strong>in</strong>ation assessment were tested for M. nivale <strong>in</strong>fection from 1991-2000. A work<strong>in</strong>g sample of either 200 or 100 seeds respectively was prepared and surfacesterilised <strong>in</strong> a solution of NaOCl conta<strong>in</strong><strong>in</strong>g 1.4% available chlor<strong>in</strong>e for 10 m<strong>in</strong>utes. Seedswere plated onto potato dextrose agar conta<strong>in</strong><strong>in</strong>g 100ppm streptomyc<strong>in</strong> sulphate and<strong>in</strong>cubated at 20 o C <strong>in</strong> the dark for 7 days. Identification of M. nivale was determ<strong>in</strong>ed by visualexam<strong>in</strong>ation of colony characteristics and spore morphology. Results were expressed as apercentage of seeds <strong>in</strong>fected.For regional analysis, data was arranged accord<strong>in</strong>g to the six ma<strong>in</strong> wheat grow<strong>in</strong>g areas <strong>in</strong>Scotland: the Borders; East Lothian and Berwick; Fife; Perthshire and K<strong>in</strong>ross-shire; Angus;and the North East. Test results from other areas were not used <strong>in</strong> the regional analysis.Ra<strong>in</strong>fall and temperatureTotal ra<strong>in</strong>fall and mean daily temperature record<strong>in</strong>gs for the period 15 May to 30 June fromsix Scottish weather stations were obta<strong>in</strong>ed from the Met Office <strong>in</strong> Glasgow. Weatherstations at Kelso, Hadd<strong>in</strong>gton, Cupar, Dundee, Brech<strong>in</strong> and Dyce were chosen. The 15 May to30 June was chosen to cover the period directly before anthesis and dur<strong>in</strong>g anthesis <strong>in</strong> Scottishwheat crops.Statistical AnalysisVariance components were calculated us<strong>in</strong>g REML (Residual Maximum Likelihood) (Anon.1993) to study the relative variation <strong>in</strong> <strong>in</strong>fection levels between years and regions.Correlation coefficients were used to measure the relationship between total ra<strong>in</strong>fall or meantemperature and mean M. nivale <strong>in</strong>fection.
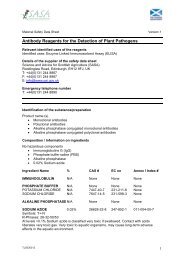
RESULTSIncidenceREML analysis of the average <strong>in</strong>fection levels from 1991-2000 showed large variationsbetween years (Table 1). Maximum <strong>in</strong>fection <strong>in</strong> all years was greater than the 5% advisorythreshold. With the exception of 1995 the percentage of samples <strong>in</strong>fected with M. nivale wasgreater that 80%. However <strong>in</strong> 5 of the 10 years exam<strong>in</strong>ed more than 40% of samples had lessthan or equal to the 5% threshold.Table 1Incidence of Microdochium nivale <strong>in</strong>fection on Scottish w<strong>in</strong>ter wheat seed 1991– 2000Year harvested 1991 1992 1993 1994 1995 1996 1997 1998 1999 2000Mean% M.nivale 29 12 16 7 3 6 42 35 15 4Range(% M.nivale)0-700-630-690-560-240-450.5-89.53-78.50-53.50-34.5Percentagesamples <strong>in</strong>fectedPercentage ofsamples > 5%92 96 98 83 71 82 100 100 98 8182 58 80 35 11 33 96 94 68 27When the data was subdivided accord<strong>in</strong>g to the ma<strong>in</strong> wheat grow<strong>in</strong>g regions, it was found thatthere were no consistent differences between regions. Average <strong>in</strong>fection levels betweenregions with<strong>in</strong> a year were also broadly similar (Figure 2), although the north-east had notablyhigher average <strong>in</strong>fection levels than other regions <strong>in</strong> 1992 and 1993.The relationship between ra<strong>in</strong>fall and temperature, and the <strong>in</strong>cidence of M. nivaleS<strong>in</strong>ce the variation <strong>in</strong> <strong>in</strong>fection between the ma<strong>in</strong> grow<strong>in</strong>g regions was relatively low, wefocussed on the relationships between the <strong>in</strong>fection levels, and ra<strong>in</strong>fall and temperature overthe years, averaged over the regions. The correlation between mean <strong>in</strong>fection and ra<strong>in</strong>fallover the ten years was 0.74 (p=0.015) and the mean level of <strong>in</strong>fection generally <strong>in</strong>creased with<strong>in</strong>creas<strong>in</strong>g ra<strong>in</strong>fall (Figure 3). The year 2000 was <strong>in</strong>consistent with the general relationship,hav<strong>in</strong>g low <strong>in</strong>fection levels <strong>in</strong> a year with high ra<strong>in</strong>fall.There did not appear to be a relationship between M. nivale levels and the mean temperatureexperienced before and dur<strong>in</strong>g anthesis. The correlation between average <strong>in</strong>fection and meantemperature was - 0.16 (p=0.66) over the ten years.
AngusMean percentage M. nivale605040302010BordersEast Lothian/BerwickFifeNorth eastPerth/K<strong>in</strong>ross-shire01991 1992 1993 1994 1995 1996 1997 1998 1999 2000YearFigure 2Mean M. nivale <strong>in</strong>fection for each region and year
Kenyon and Thomas (2001), considered the relationship between resistance rat<strong>in</strong>gs ofdifferent wheat varieties and M. nivale <strong>in</strong>fection but found that it only accounted for 5.8% ofthe variation between samples. Whilst <strong>in</strong>vestigat<strong>in</strong>g the development of ear blight Jenn<strong>in</strong>gsand Turner (1996), suggested that cool dry weather <strong>in</strong> the spr<strong>in</strong>g which encouraged thedevelopment of M. nivale on the stem base, followed by heavy ra<strong>in</strong>fall dur<strong>in</strong>g anthesis mayhave accounted for widespread ear <strong>in</strong>fection by M. nivale <strong>in</strong> their experimental plots. Ear<strong>in</strong>fection was highest <strong>in</strong> plots ma<strong>in</strong>ta<strong>in</strong>ed at a high humidity. However, M. nivale is one ofmany fungi associated with ear blight and years where high levels of ear blight are recordedmay not necessarily be consistent with years when high levels of seed-borne M. nivale arerecorded.Recently a class of fungicides called the strobilur<strong>in</strong>s used to control ear blight have been<strong>in</strong>troduced. There have been suggestions that these fungicides may be responsible for lowlevels of M. nivale recorded <strong>in</strong> some crops. Experimental data has shown that wheat earssprayed with the fungicide azoxystrob<strong>in</strong> (a stobilur<strong>in</strong>) before be<strong>in</strong>g artificially <strong>in</strong>oculated withM. nivale at anthesis reduced levels of M. nivale on the harvested seed compared to seed fromunsprayed controls (W<strong>in</strong>son et al, 2001). Strobilur<strong>in</strong>s have been used <strong>in</strong> Scotland s<strong>in</strong>ce 1998.Usage has <strong>in</strong>creased by 125%, from 7700Kg of active <strong>in</strong>gredient used <strong>in</strong> 1998 to 17346Kg <strong>in</strong>2000, (Snowden &Thomas, 1999, Kerr and Snowden, 2001). Over the next few years the<strong>in</strong>cidence of M. nivale and strobilur<strong>in</strong> usage will be monitored to determ<strong>in</strong>e whether there is<strong>in</strong>deed a relationship between strobilur<strong>in</strong> ear sprays and M. nivale <strong>in</strong>cidence.ACKNOWLEDGEMENTSThe authors would like to thank the staff of the OSTS for their help and co-operation <strong>in</strong>provid<strong>in</strong>g this data and both <strong>SASA</strong> and SEERAD for their support.REFERENCESAnon., (1993) Genstat 5 Release 3 Reference Manual, Oxford Science Publications 1993Cockerell, V (1995) Review of work carried out at the Official Seed Test<strong>in</strong>g Station forScotland (OSTS) on the control of Microdochium nivale (Fusarium nivale) on w<strong>in</strong>ter wheat <strong>in</strong>Scotland. <strong>Proceed<strong>in</strong>gs</strong> of the ISTA Pre-Congress Sem<strong>in</strong>ar on Seed Pathology, Copenhagan,Denmark June6, 1995, pp 25-38.Cockerell, V; Rennie, W J (1996) Survey of seed-borne pathogens <strong>in</strong> certified and farm-savedcereal seed <strong>in</strong> Brita<strong>in</strong> between 1992 and 1994. HGCA Project Report No. 124, Home GrownCereals Authority Publications.Hewett, P D (1965) A survey of seed-borne fungi of wheat. I. The <strong>in</strong>cidence ofLeptosphaeria nodorum and Griphosphaeria nivalis. Transactions of the British MycologicalSociety 48, 59-72.Humphreys, J; Cooke, B M; Storey, T (1995) Effects of seed-borne Microdochium nivale onestablishment and gra<strong>in</strong> yield of w<strong>in</strong>ter-sown wheat. Plant Varieties and Seeds 8, 107-117
Jenn<strong>in</strong>gs, P; Turner, J A (1996) Towards the prediction of fusarium ear blight epidemics <strong>in</strong>the UK - the role of humidity <strong>in</strong> disease development. Brighton <strong>Crop</strong> <strong>Protection</strong> Conference– Pest & Diseases, BCPC <strong>Proceed<strong>in</strong>gs</strong> Volume 1, 18 –21 November 1996 pp 233-238.Kenyon, D M; Thomas J E (2001) The relationship between season, variety and location onthe <strong>in</strong>cidence and severity of Microdochium nivale levels <strong>in</strong> w<strong>in</strong>ter wheat seedlots. In: SeedTreatment Challenges & Opportunities BCPC Symposium <strong>Proceed<strong>in</strong>gs</strong> No. 76, BCPCPublications, pp 241-246.Parry, D W; Jenk<strong>in</strong>son, P; McLeod L (1995) Fusarium ear blight (scab) <strong>in</strong> small gra<strong>in</strong>cereals – a review. Plant Pathology 44 , 207-238.Snowden, J P; Thomas, L A (1999) Arable <strong>Crop</strong>s 1998. Pesticide Usage <strong>in</strong> Scotland, ScottishAgricultural Science Agency, Scottish Executive Rural Affairs Department, pp 39-40 and pp89-90.W<strong>in</strong>son, S J; Hare, M C; Jenk<strong>in</strong>son P (2001) The <strong>in</strong>teraction between ear sprays and seedtreatment for the control of Fusarium seedl<strong>in</strong>g blight <strong>in</strong> wheat. In: Seed TreatmentChallenges & Opportunities BCPC Symposium <strong>Proceed<strong>in</strong>gs</strong> No. 76, BCPC Publications, pp251-256.