Rodenticides on Arable Farms 2000-2010 - SASA
Rodenticides on Arable Farms 2000-2010 - SASA
Rodenticides on Arable Farms 2000-2010 - SASA
You also want an ePaper? Increase the reach of your titles
YUMPU automatically turns print PDFs into web optimized ePapers that Google loves.
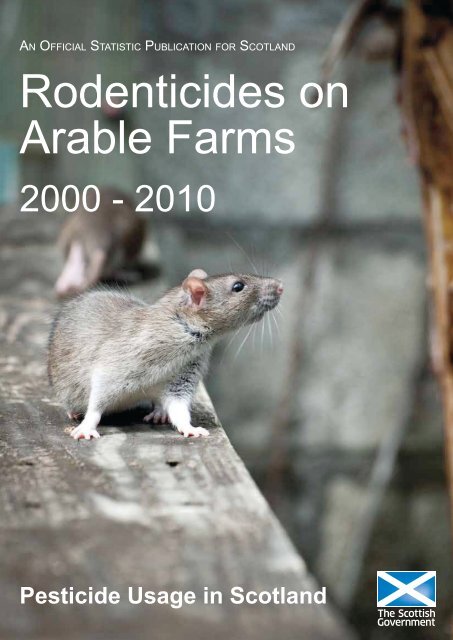
An OfficiAl StAtiStic PublicAtiOn fOr ScOtlAnd<str<strong>on</strong>g>Rodenticides</str<strong>on</strong>g> <strong>on</strong><strong>Arable</strong> <strong>Farms</strong><strong>2000</strong> - <strong>2010</strong>Pesticide Usage in Scotland
Pesticide Usage in Scotland<str<strong>on</strong>g>Rodenticides</str<strong>on</strong>g> <strong>on</strong> <strong>Arable</strong> <strong>Farms</strong><strong>2000</strong> to <strong>2010</strong>J. HughesScience and Advice for Scottish Agriculture (<strong>SASA</strong>)Roddinglaw Road, Edinburgh, Scotland, EH12 9FJpsu@sasa.gsi.gov.ukwww.sasa.gov.uk/pesticidesPublished by the Scottish Government, September 2012
CONTENTSPageSummary ........................................................................................................ 1Introducti<strong>on</strong> ...................................................................................................... 2Definiti<strong>on</strong>s and notes ....................................................................................... 2Method ........................................................................................................ 3Results and discussi<strong>on</strong> .................................................................................... 4Acknowledgements .......................................................................................... 7References....................................................................................................... 7Figure 1 Land-use regi<strong>on</strong>s of Scotland.......................................................... 8Figure 2 Estimated occurrence of anticoagulant rodenticides in Scotland<strong>2000</strong>-<strong>2010</strong> ....................................................................................... 9Figure 3 Estimated quantity of anticoagulant rodenticide products applied inScotland <strong>2000</strong>-<strong>2010</strong> ........................................................................ 9Table 1 Number and regi<strong>on</strong>al distributi<strong>on</strong> of holdings sampled .................. 10Table 2 Percentage of holdings using chemical c<strong>on</strong>trol for vertebrate pests...................................................................................................... 11Table 3 Percentage of holdings <strong>on</strong> which pest c<strong>on</strong>trol was c<strong>on</strong>ducted by thefarmer ............................................................................................ 11Table 4 Estimated occurrence of rodenticide formulati<strong>on</strong>s......................... 12Table 5 Estimated quantities of rodenticide products ................................. 13Table 6 Estimated quantities of rodenticide formulati<strong>on</strong>s ........................... 14Table 7 Chemical c<strong>on</strong>trol of rabbits ............................................................ 15Table 8 Chemical c<strong>on</strong>trol of moles ............................................................. 15Table 9 Raising and adjustment factors ..................................................... 16Appendix 1 UK approval status of compounds encountered.......................... 19
SummaryThroughout the surveyed period, rodenticides were used <strong>on</strong> more than threequarters of arable holdings. Farmers were resp<strong>on</strong>sible for rodenticide use <strong>on</strong> themajority of farms from <strong>2000</strong> to 2008. However, in <strong>2010</strong> baiting was c<strong>on</strong>ducted bypest c<strong>on</strong>trol professi<strong>on</strong>als <strong>on</strong> 55% of the farms sampled.Anticoagulant compounds were the most frequently encountered rodenticides,accounting for over 99% of all rodenticide use. The most comm<strong>on</strong>ly used activeingredients were the sec<strong>on</strong>d generati<strong>on</strong> compounds bromadiol<strong>on</strong>e and difenacoum.These two rodenticides cumulatively accounted for more than 78% of all occurrencesof use and 80% of total quantity of rodenticide products applied during the surveyedperiod.Bromadiol<strong>on</strong>e use in <strong>2010</strong> was double that encountered in <strong>2000</strong>, in relati<strong>on</strong> to bothoccurrences and quantity of product. C<strong>on</strong>versely, occurrence of difenacoum in <strong>2010</strong>was almost a third less than in <strong>2000</strong> and the quantity used was almost two thirdsless. However, usage data showed c<strong>on</strong>siderable inter-survey variati<strong>on</strong> over thedecade.Chemical c<strong>on</strong>trol of rabbits was recorded <strong>on</strong> fewer than 10% of farms during thesesurveys. The most comm<strong>on</strong>ly used compound for rabbit c<strong>on</strong>trol was aluminiumphosphide. Sodium cyanide use was recorded in the first half of the decade but wasnot encountered after its withdrawal in 2004.The percentage of holdings employing chemical c<strong>on</strong>trol for moles in <strong>2010</strong> was justover <strong>on</strong>e third of those doing so in <strong>2000</strong>. A notable decline in chemical use occurredafter the withdrawal of strychnine in 2006. Thereafter aluminium phosphide was the<strong>on</strong>ly active ingredient available for mole c<strong>on</strong>trol.1
Introducti<strong>on</strong>This report summarises the results of six biennial surveys of rodenticide use <strong>on</strong>arable holdings in Scotland between <strong>2000</strong> and <strong>2010</strong>. It also includes informati<strong>on</strong> <strong>on</strong>the use of chemicals to c<strong>on</strong>trol moles and rabbits.The rodenticide surveys were performed al<strong>on</strong>gside pesticide usage surveys <strong>on</strong>arable crops c<strong>on</strong>ducted by the Pesticide Survey Unit at Science and Advice forScottish Agriculture (<strong>SASA</strong>), a divisi<strong>on</strong> of the Scottish Government’s Agriculture,Food and Rural Communities Directorate.Rodenticide use data were collected from a sample of arable holdings. Sample sizevaried am<strong>on</strong>g surveys, accounting for approximately 2% of the total arable holdingsin Scotland (Table 1). Estimates of nati<strong>on</strong>al rodenticide use have been calculatedbased <strong>on</strong> the sampled data.The <strong>2000</strong> and 2002 survey data have been published previously 1,2 but aresummarised in this report to provide an overview of rodenticide use over the lastdecade. There are some differences in the estimated quantity of rodenticidesreported previously and in this summary report (please refer to the method secti<strong>on</strong>for explanati<strong>on</strong>). The data from the surveys c<strong>on</strong>ducted from 2004 to <strong>2010</strong> arepublished for the first time in this report.Definiti<strong>on</strong>s and NotesThe term ‘rodenticide’ is used to describe a substance used to kill or c<strong>on</strong>trol rodents.Surveys <strong>on</strong>ly c<strong>on</strong>cerned chemical c<strong>on</strong>trol of vertebrate pests and informati<strong>on</strong> <strong>on</strong>other c<strong>on</strong>trol methods, such as trapping or shooting, were not collected.The term ‘formulati<strong>on</strong>(s)’ is used to describe the active ingredient or mixture of activeingredients formulated together. The term ‘product’ is used to describe the marketedrodenticide product c<strong>on</strong>taining active ingredients, bait and other co-formulants.The term ‘occurrence’ is used to describe the number of holdings <strong>on</strong> which aformulati<strong>on</strong> has been used. If a holding has used a product with the sameformulati<strong>on</strong> more than <strong>on</strong>ce or more than <strong>on</strong>e product with the same formulati<strong>on</strong> it isrecorded as a single occurrence.Throughout the tables, data based <strong>on</strong> fewer than 10 sampled occurrences aremarked with an asterisk and should be treated with cauti<strong>on</strong> as these estimates mayhave an unacceptably high associated error.The term ‘holding’ is the basic unit used in the agricultural census and, in this report,is syn<strong>on</strong>ymous with the term ‘farm’.Due to rounding, there may be slight differences in totals both within and betweentables.2
MethodIn each survey rodenticide use data were collected from a random sample ofholdings growing arable crops (Table 1). The holdings were grouped by land-useregi<strong>on</strong> 3 (Figure 1) and stratified by five size groups based <strong>on</strong> the total area of arablecrops grown. Sampling within size groups was based <strong>on</strong> area rather than numbers ofholdings, so that smaller size groups did not dominate the sample. This stratificati<strong>on</strong>was designed to take into account differences in rodenticide use pattern in relati<strong>on</strong> togeography and holding size when making estimates of nati<strong>on</strong>al use.Data were collected by interview with farmers. When rodenticides were applied by apest c<strong>on</strong>trol c<strong>on</strong>tractor the data were obtained from the <strong>on</strong> farm rodent c<strong>on</strong>trol recordbook or from the c<strong>on</strong>tractor.Previously, in the <strong>2000</strong> and 2002 reports, when rodenticide data could not beobtained from pest c<strong>on</strong>trol c<strong>on</strong>tractors their occurrence was recorded as unspecifiedbut quantity of use was estimated and assigned to different active ingredients based<strong>on</strong> known c<strong>on</strong>tractor use patterns in the nati<strong>on</strong>al sample. In this report suchestimati<strong>on</strong> was not c<strong>on</strong>ducted and if rodenticides were used but the product or activeingredient data were not obtainable this was recorded as unspecified use for bothoccurrence and quantity. This change in methodology was undertaken due tomarked differences in the type and quantity of bait used by different c<strong>on</strong>tractorswhich introduced additi<strong>on</strong>al uncertainty into the nati<strong>on</strong>al estimate. However, as mostunspecified use relates to pest c<strong>on</strong>trol c<strong>on</strong>tractor applicati<strong>on</strong>s it should be noted thatthis missing data will influence the overall estimated use pattern.The sample data were used to estimate nati<strong>on</strong>al rodenticide use by multiplying themby a raising factor dependent <strong>on</strong> the number of farms within each regi<strong>on</strong> and sizegroup to match the data recorded in the relevant June Agricultural Census for arablecrops in each survey year 4-9 . Due to small sample sizes the data from some regi<strong>on</strong>swere merged and a sec<strong>on</strong>dary adjustment factor was applied to the raising factors toaccount for regi<strong>on</strong> and size groups for which no holdings were sampled. Details ofregi<strong>on</strong>s, size groups, raising and adjustment factors are presented in Table 9.3
Results and Discussi<strong>on</strong>Overall changes in rodenticide use pattern between <strong>2000</strong> and <strong>2010</strong> are discussed inthis secti<strong>on</strong>. However, the data showed c<strong>on</strong>siderable inter-survey variati<strong>on</strong> anddiscussi<strong>on</strong> of temporal changes in use does not indicate statistical significance.Extent of rodenticide use and primary user (Tables 2 and 3)The percentage of farms using rodenticides was c<strong>on</strong>sistently high throughout thesurveyed period, ranging from 76 to 86% (Table 2). Temporal differences in use mayhave been influenced by a number of factors such as rodent populati<strong>on</strong> or whetherfarms sampled in that year had livestock or grain stores or were members of aquality assurance scheme in which rodenticide use was mandatory.Farmers were resp<strong>on</strong>sible for rodenticide use <strong>on</strong> the majority of farms, 58 to 73% ofthe sample, from <strong>2000</strong> to 2008 (Table 3). In <strong>2010</strong> baiting was c<strong>on</strong>ducted by pestc<strong>on</strong>trol professi<strong>on</strong>als <strong>on</strong> 55% of holdings.Rodenticide compounds encountered (Appendix 1)Eight anticoagulant rodenticide compounds were encountered during the surveys;brodifacoum, bromadiol<strong>on</strong>e, chlorophacin<strong>on</strong>e, coumatetralyl, difenacoum,diphacin<strong>on</strong>e, flocoumafen and warfarin. Anticoagulant rodenticides (ARs) prevent thesynthesis of blood clotting factors and result in death from haemorrhage. Thesecompounds are split into two groups. The first generati<strong>on</strong> anticoagulants (FGARs)include the coumarin compounds; coumatetralyl and warfarin and the 1,3-indandi<strong>on</strong>es; chlorophacin<strong>on</strong>e and diphacin<strong>on</strong>e. These were succeeded, followingresistance development, by the more acutely toxic and persistent sec<strong>on</strong>d generati<strong>on</strong>anticoagulant rodenticides (SGARs); brodifacoum, bromadiol<strong>on</strong>e, difenacoum andflocoumafen.N<strong>on</strong>-anticoagulant rodenticides, alphachloralose, aluminium phosphide, powderedcorn cob and zinc phosphide, were also recorded. Alphachloralose is animmobilising agent which depresses the central nervous system. Aluminiumphosphide c<strong>on</strong>taining products are laid in burrows where they react with moisture inthe soil and air releasing toxic phosphine gas. Zinc phosphide is used in baits andreacts with acid in the digestive system <strong>on</strong> ingesti<strong>on</strong> to produce phosphine.Powdered corn cob is also ingested, causing dehydrati<strong>on</strong> leading to reduced bloodvolume and blood pressure, tissue ischemia and circulatory shock culminating indeath. In additi<strong>on</strong>, difenacoum products formulated with calciferol and cholecalciferol(vitamins D 2 and D 3 ) were also encountered. These compounds causehypercalcemia leading to heart problems and kidney failure. They are alsosynergistic with anticoagulant rodenticides, displaying enhanced hypercalcemic andhemorrhagic effects when used in combinati<strong>on</strong>.A summary of the UK approval status of the compounds encountered during thesesurveys is provided in Appendix 1.4
Occurrence of rodenticide use (Table 4 and Figure 2)Throughout the reported period, anticoagulant compounds were the most frequentlyencountered rodenticides, accounting for over 99% of all specified occurrences ofuse. First generati<strong>on</strong> anticoagulants accounted for 20% of total rodenticideoccurrences in <strong>2000</strong> and 3% in <strong>2010</strong>. Whereas, sec<strong>on</strong>d generati<strong>on</strong> compoundsaccounted for 80 and 97% of all rodenticides in <strong>2000</strong> and <strong>2010</strong> respectively.The most comm<strong>on</strong>ly used compounds were bromadiol<strong>on</strong>e and difenacoum. Theseactive ingredients are the <strong>on</strong>ly SGARs with approval for outdoor use in the UK, andcumulatively accounted for between 78 and 96% of all occurrences of rodenticidesduring the surveys. The relative proporti<strong>on</strong> of use of these compounds changed overthe surveyed period. The percentage of holdings using bromadiol<strong>on</strong>e increased from27 to 59% over the decade and occurrence of use increased from 32 to 58% of allrodenticide occurrences. Difenacoum (including use as a single active ingredient andin formulati<strong>on</strong>) was used <strong>on</strong> 38% of holdings in <strong>2000</strong> and 30% in <strong>2010</strong>, accountingfor 46 and 30% of all rodenticide occurrences in those years respectively. It shouldbe noted however that these were not linear trends and there was inter-surveyvariati<strong>on</strong> in use over the decade.Brodifacoum, which is approved <strong>on</strong>ly for indoor use, was used <strong>on</strong> 2 to 4 % ofholdings between <strong>2000</strong> and 2008 and <strong>on</strong> 9% of holdings in <strong>2010</strong>. Flocoumafen,which is also approved for indoor use, was <strong>on</strong>ly encountered in 2002 and 2004 <strong>on</strong>less than 1% of holdings.Quantity of rodenticide product use (Table 5 and Figure 3)As with the occurrence data, 99% of rodenticidal products used by weight wereanticoagulants (Table 5 and Figure 3). There was c<strong>on</strong>siderable variati<strong>on</strong> in thequantity of rodenticides used over the decade. As discussed previously, variati<strong>on</strong>over time may be a functi<strong>on</strong> of a number of factors such as pest pressure and thetype of farms sampled in each year.SGAR c<strong>on</strong>taining products accounted for 88% of total rodenticides applied in <strong>2000</strong>and 99% in <strong>2010</strong>, whilst FGAR products were 12 and 1% of the total quantity appliedin <strong>2000</strong> and <strong>2010</strong> respectively. However, whilst the quantity of FGAR productsdeclined over the surveyed period, from almost 18 t<strong>on</strong>nes in <strong>2000</strong> to less than half at<strong>on</strong>ne in <strong>2010</strong>, the quantity of SGAR products were very similar at the start and endof the decade at around 126 t<strong>on</strong>nes.Bromadiol<strong>on</strong>e and difenacoum accounted for 80 to 97% of all products applied overthe decade. The quantity of bromadiol<strong>on</strong>e used in <strong>2010</strong> was more than twice thatrecorded in <strong>2000</strong> whilst difenacoum applicati<strong>on</strong>s were almost two thirds less. Thequantity of brodifacoum used was almost three times greater in <strong>2010</strong> than in <strong>2000</strong>.In additi<strong>on</strong> to the discussed rodenticide product use (Table5), the estimated quantityof active ingredients applied is presented in Table 6.5
Chemical c<strong>on</strong>trol of rabbits (Tables 2, 3 and 7)Chemical c<strong>on</strong>trol of rabbits was encountered <strong>on</strong> fewer than 10% of farms and wasc<strong>on</strong>ducted by farmers <strong>on</strong> 89 to 100% of holdings. Sodium cyanide use was recordedin the first half of the decade but was not encountered after its approval was revokedin 2004. The most comm<strong>on</strong>ly used compound overall was aluminium phosphide.Chemical c<strong>on</strong>trol of moles (Tables 2, 3 and 8)The percentage of holdings employing chemical c<strong>on</strong>trol for moles in <strong>2010</strong> (5%) wasjust over <strong>on</strong>e third of those doing so in <strong>2000</strong> (14%). The decline was most notableafter the withdrawal of strychnine in 2006 which until then had been the mostcomm<strong>on</strong>ly used chemical c<strong>on</strong>trol agent. Thereafter aluminium phosphide was the<strong>on</strong>ly compound available for use. The proporti<strong>on</strong> of c<strong>on</strong>trol c<strong>on</strong>ducted by farmerswas influenced by the change in active ingredient used; in the earlier part of thedecade when strychnine use was prevalent the majority of mole c<strong>on</strong>trol was appliedby pest c<strong>on</strong>trol c<strong>on</strong>tractors (ca 75%) as approval was restricted to those holding alicence. Once strychnine was removed from the market most mole c<strong>on</strong>trol wasc<strong>on</strong>ducted by farmers.6
AcknowledgementsThe author would like to thank the farmers and pest c<strong>on</strong>trol c<strong>on</strong>tractors who providedthe informati<strong>on</strong> used in this report. Thanks are also given to <strong>SASA</strong> staff whocollected the data; Chris Bierley, John Kerr, Gillian Reay, Louis Thomas, AndrewWalker and Jeremy Snowden, to Jennifer Wats<strong>on</strong> and Michael Taylor from <strong>SASA</strong> foreditorial assistance and to Lee Walker (CEH), Alan Buckle (University of Reading)and Gill Hartley (<strong>SASA</strong>) for helpful comments <strong>on</strong> the manuscript. In additi<strong>on</strong> theauthor is grateful for support from Adrian Roberts of Biomathematics & StatisticsScotland.References1. Thomas, L A. <str<strong>on</strong>g>Rodenticides</str<strong>on</strong>g> <strong>on</strong> <strong>Arable</strong> <strong>Farms</strong> <strong>2000</strong>. SEERAD, Edinburgh 20022. Thomas, L A. <str<strong>on</strong>g>Rodenticides</str<strong>on</strong>g> <strong>on</strong> <strong>Arable</strong> <strong>Farms</strong> 2002. SEERAD, Edinburgh 20053. Wood, H J. An Agricultural Atlas of Scotland; George Hill and S<strong>on</strong>s, L<strong>on</strong>d<strong>on</strong>1931.4. Agricultural Statistics, Scotland <strong>2000</strong>, HMSO, Edinburgh <strong>2000</strong>5. Agricultural Statistics, Scotland 2002, HMSO, Edinburgh 20026. Agricultural Statistics, Scotland 2004, HMSO, Edinburgh 20047. Agricultural Statistics, Scotland 2006, HMSO, Edinburgh 20068. Agricultural Statistics, Scotland 2008, HMSO, Edinburgh 20089. Agricultural Statistics, Scotland <strong>2010</strong>, HMSO, Edinburgh <strong>2010</strong>7
Figure 1Land-use regi<strong>on</strong>s of Scotland8
Estimated Quantity of <str<strong>on</strong>g>Rodenticides</str<strong>on</strong>g> Applied (t<strong>on</strong>nes)Estimated Number of OccurrencesFigure 2 Estimated occurrence of anticoagulant rodenticides inScotland <strong>2000</strong>-<strong>2010</strong>1<strong>2000</strong>10000Total First Generati<strong>on</strong> AnticoagulantsTotal Sec<strong>on</strong>d Generati<strong>on</strong> AnticoagulantsBromadiol<strong>on</strong>eDifenacoumBrodifacoum800060004000<strong>2000</strong>0<strong>2000</strong> 2002 2004 2006 2008 <strong>2010</strong>Survey YearFigure 3 Estimated quantity of anticoagulant rodenticideproducts applied in Scotland <strong>2000</strong>-<strong>2010</strong>160140120Total First Generati<strong>on</strong> AnticoagulantsTotal Sec<strong>on</strong>d Generati<strong>on</strong> AnticoagulantsBromadiol<strong>on</strong>eDifenacoumBrodifacoum100806040200<strong>2000</strong> 2002 2004 2006 2008 <strong>2010</strong>Survey Year9
Table 1Number and regi<strong>on</strong>al distributi<strong>on</strong> of holdings sampledRegi<strong>on</strong> <strong>2000</strong> 2002 2004 2006 2008 <strong>2010</strong>Highlands & Islands 6 8 7 5 8 8Caithness & Orkney 6 11 6 1 6 5Moray Firth 24 30 28 30 35 27Aberdeen 59 46 51 24 38 35Angus 38 41 57 58 55 37East Fife 21 21 22 5 19 20Lothian 25 19 23 23 30 11Central Lowlands 23 36 32 22 30 18Tweed Valley 33 33 27 31 30 8Southern Uplands 5 7 5 4 5 3Solway 11 12 12 12 9 7Total holdings sampled 251 264 270 215 265 179Number of arable holdings in Scotland 11917 12339 11927 10957 10921 10302Percentage of holdings sampled 2.1 2.1 2.3 2.0 2.4 1.710
Table 2Percentage of holdings using chemical c<strong>on</strong>trol for vertebrate pestsPest <strong>2000</strong> 2002 2004 2006 2008 <strong>2010</strong>Rodents 76 78 86 82 77 85Rabbits 9 9 9 2 5 6Moles 14 22 14 16 5 5Table 3 Percentage of holdings <strong>on</strong> which pest c<strong>on</strong>trol was c<strong>on</strong>ducted by the farmerRefers to holdings <strong>on</strong> which chemical c<strong>on</strong>trol was recorded, the remainder was c<strong>on</strong>ducted by pest c<strong>on</strong>trol c<strong>on</strong>tractor.Pest <strong>2000</strong> 2002 2004 2006 2008 <strong>2010</strong>Rodents 65 73 60 67 58 45Rabbits 93 96 100 100 96 89Moles 24 27 24 61 88 6211
Table 4 Estimated occurrence of rodenticide formulati<strong>on</strong>sEstimated nati<strong>on</strong>al number of occurrences and percentage of farms using each formulati<strong>on</strong> of active ingredientsFormulati<strong>on</strong> <strong>2000</strong> 2002 2004 2006 2008 <strong>2010</strong>No. % No. % No. % No. % No. % No. %Alphachloralose* 7
Table 5 Estimated quantities of rodenticide productsEstimated nati<strong>on</strong>al quantity of rodenticide products (including active ingredients, bait and other co-formulants) applied (kg)Active Ingredients in<strong>2000</strong> 2002 2004 2006 2008 <strong>2010</strong>ProductAlphachloralose* 25Aluminium phosphide*
Table 6 Estimated quantities of rodenticide formulati<strong>on</strong>sEstimated nati<strong>on</strong>al quantity of active ingredients in each formulati<strong>on</strong> applied (kg)Formulati<strong>on</strong> <strong>2000</strong> 2002 2004 2006 2008 <strong>2010</strong>Alphachloralose* 0.985Aluminium phosphide* 0.205 25.200 10.572 1.653Brodifacoum 0.038 0.043 0.498 0.043 0.104 0.225Bromadiol<strong>on</strong>e 2.210 2.668 4.820 2.250 4.120 4.624Calciferol/difenacoum* 0.354 0.650Cholecalciferol/difenacoum* 0.445 0.042 aChlorophacin<strong>on</strong>e 0.310 0.413 0.329 0.153 0.226 0.106Coumatetralyl 10.339 4.466 2.941 4.601 0.679Difenacoum 4.058 1.885 2.400 1.602 2.253 1.502Diphacin<strong>on</strong>e* 0.037 0.026 0.004 bFlocoumafen*
Table 7 Chemical c<strong>on</strong>trol of rabbitsEstimated nati<strong>on</strong>al number of occurrences, percentage of holdings using each formulati<strong>on</strong> and quantity appliedFormulati<strong>on</strong> <strong>2000</strong> 2002 2004 2006 2008 <strong>2010</strong>Number of Occurrences (% of holdings)Aluminium phosphide 461 (4%) 931 (8%) 1130 (9%) 248 (2%) 547 (5%) 640 (6%)Sodium cyanide 604 (5%) 342 (3%)Unspecified rabbit c<strong>on</strong>trol 44 (
Table 9 Raising and adjustment factorsThe sampled data within a regi<strong>on</strong> and size group are multiplied by the appropriate raising and adjustment factors to create an estimate of totaluse (refer to methods). For example, a total recorded rodenticide use of 1 kg <strong>on</strong> 20-49.9 ha farms in Angus in <strong>2000</strong> would be multiplied by192.5 (raising factor) and 1.3165 (adjustment factor 1) to give an estimated use in that regi<strong>on</strong> and size group of 253 kg.<strong>2000</strong>Regi<strong>on</strong>/Size Group (ha) 0-19.9 20-49.9 50-99.9 100-149.9 150+ Adjustment factorCaithness & Orkney and Highlands & Islands 201.22 74.00 46.00 NA NA 1.0045Moray Firth 578.00 147.50 28.14 13.83 7.13 1.0000Aberdeen 208.17 61.31 26.72 13.27 10.73 1.0000Angus NA 192.50 33.50 18.78 10.20 1.3165East Fife 108.00 64.50 25.86 14.17 12.60 1.0000Lothian 123.00 46.00 64.00 14.17 6.71 1.0000Central Lowlands 151.67 74.67 50.40 25.00 14.67 1.0000Tweed Valley 144.00 64.50 23.33 14.44 8.13 1.0000Solway and Southern Uplands 202.00 49.80 19.50 14.00 4.33 1.00002002Regi<strong>on</strong>/Size Group (ha) 0-19.9 20-49.9 50-99.9 100-149.9 150+ Adjustment factorCaithness & Orkney and Highlands & Islands 161.00 71.00 25.00 NA NA 1.0038Moray Firth 116.80 33.56 36.40 20.25 8.43 1.0000Aberdeen 619.5 76.70 34.71 16.75 10.00 1.0000Angus 192.00 42.56 35.36 18.67 14.70 1.0000East Fife 111.00 32.25 34.00 20.00 9.29 1.0000Lothian 127.00 40.50 40.33 15.33 12.71 1.0000Central Lowlands 107.25 42.70 26.67 15.2 11.00 1.0000Tweed Valley 31.50 32.75 24.33 15.00 11.00 1.0000Solway and Southern Uplands 79.57 39.71 26.00 NA 7.50 1.0162NANot applicable, no holdings sampled in this regi<strong>on</strong>/size group16
TABLE 9Raising and adjustment factors (c<strong>on</strong>tinued)2004Regi<strong>on</strong>/Size Group (ha) 0-19.9 20-49.9 50-99.9 100-149.9 150+ Adjustment factorCaithness & Orkney and Highlands & Islands 329.57 37.25 25.00 NA NA 1.0040Moray Firth 543.00 75.50 26.00 13.33 6.40 1.0000Aberdeen 571.00 75.80 29.00 16.78 8.64 1.0000Angus 177.00 49.57 29.31 14.50 6.96 1.0000East Fife NA 41.33 23.00 16.00 9.57 1.2407Lothian NA 79.00 29.75 13.00 8.36 1.3018Central Lowlands 202.75 63.00 20.91 20.75 7.17 1.0000Tweed Valley NA 131.00 25.40 17.14 9.14 1.2411Solway and Southern Uplands 181. 67 43.83 16.60 15.00 7.00 1.00002006Regi<strong>on</strong>/Size Group (ha) 0-19.9 20-49.9 50-99.9 100-149.9 150+ Adjustment factorCaithness & Orkney and Highlands & Islands 518.75 77.00 NA NA NA 1.0242Moray Firth 168.67 38.86 24.00 15.40 6.63 1.0000Aberdeen 1068.00 143.00 50.88 29.80 20.20 1.0000Angus 319.00 71.40 19.21 13.80 6.30 1.0000Lothian and East Fife NA 199.00 38.14 26.00 10.50 1.2861Central Lowlands 238.67 82.00 26.25 29.00 10.00 1.0000Tweed Valley 128.00 56.50 31.25 14.71 6.65 1.0000Solway and Southern Uplands 258.50 34.83 19.00 6.50 7.00 1.0000NANot applicable, no holdings sampled in this regi<strong>on</strong>/size group17
TABLE 9Raising and adjustment factors (c<strong>on</strong>tinued)2008Regi<strong>on</strong>/Size Group (ha) 0-19.9 20-49.9 50-99.9 100-149.9 150+ Adjustment factorCaithness & Orkney 223.33 54.50 31.00 NA NA 1.0099Highlands & Islands 210.67 67.00 22.00 NA NA 1.0044Moray Firth 237.00 37.29 20.67 10.57 7.80 1.0000Aberdeen 326.67 77.56 51.22 28.83 12.18 1.0000Angus NA 56.50 20.50 16.18 8.05 1.2955East Fife NA 52.50 36.00 14.60 9.88 1.2344Lothian NA 39.50 16.67 11.29 7.00 1.3223Central Lowlands 231.67 57.29 27.38 12.00 8.43 1.0000Tweed Valley 131.00 54.50 28.25 11.67 9.79 1.0000Solway 388.00 49.75 30.50 8.00 11.00 1.0000Southern Uplands 132.00 40.00 28.00 9.00 9.00 1.0000<strong>2010</strong>Regi<strong>on</strong>/Size Group (ha) 0-19.9 20-49.9 50-99.9 100-149.9 150+ Adjustment factorCaithness & Orkney and Highlands & Islands 235.00 50.33 22.50 14.00 NA 1.0005Moray Firth 463.00 60.25 27.50 15.80 6.45 1.0000Aberdeen 485.00 161.00 40.18 12.67 21.00 1.0000Angus NA 80.50 40.50 15.64 11.64 1.3252East Fife and Lothian NA NA 39.33 19.00 10.65 1.6995Central Lowlands NA 50.86 52.50 32.00 11.60 2.0625Solway, Southern Uplands and Tweed Valley NA 86.75 63.0 21.80 27.00 1.7435NANot applicable, no holdings sampled in this regi<strong>on</strong>/size group18
Appendix 1 UK approval status of compounds encounteredActive Ingredient UK Approval Status during Survey PeriodFirst generati<strong>on</strong> anticoagulantsChlorophacin<strong>on</strong>e ApprovedCoumatetralylApprovedDiphacin<strong>on</strong>e Withdrawn 2006WarfarinApprovedSec<strong>on</strong>d generati<strong>on</strong> anticoagulantsBrodifacoumApproved, indoor use <strong>on</strong>lyBromadiol<strong>on</strong>eApprovedDifenacoumApprovedFlocoumafenApproved, indoor use <strong>on</strong>lyN<strong>on</strong>-anticoagulantsAlphachloralose ApprovedAluminium phosphide ApprovedCalciferol Withdrawn 2006Cholecalciferol Withdrawn 2006Powdered corn cob ApprovedSodium cyanide Withdrawn 2004Strychnine Withdrawn 2006Zinc phosphide Withdrawn 200619
AN OFFICIAL STATISTICS PUBLICATION FOR SCOTLANDOfficial and Nati<strong>on</strong>al Statistics are produced to high professi<strong>on</strong>al standards set out inthe Code of Practice for Official Statistics athttp://www.statisticsauthority.gov.uk/assessment/code-of-practice/code-of-practicefor-official-statistics.pdf.Both undergo regular quality assurance reviews to ensurethat they meet customer needs and are produced free from any political interference.Further informati<strong>on</strong> about Official and Nati<strong>on</strong>al Statistics can be found <strong>on</strong> the UKStatistics Authority website at www.statisticsauthority.gov.ukSCOTTISH GOVERNMENT STATISTICIAN GROUPOur AimTo provide relevant and reliable informati<strong>on</strong>, analysis and advice that meets theneeds of government, business and the people of Scotland.For more informati<strong>on</strong> <strong>on</strong> the Statistician Group, please see the Scottish Governmentwebsite at www.scotland.gov.uk/statisticsCorresp<strong>on</strong>dence, feedback and enquiriesEnquiries <strong>on</strong> this publicati<strong>on</strong> should beaddressed to:Jackie HughesScience and Advice for ScottishAgriculturePesticides and WildlifeRoddinglaw RoadEdinburgh, EH12 9FJTeleph<strong>on</strong>e: 0131 244 8913;Fax: 0131 244 8926e-mail: jackie.hughes@sasa.gsi.gov.ukGeneral enquiries <strong>on</strong> Scottish Governmentstatistics can be addressed to:Office of the Chief Statistician andPerformanceScottish Government4N.06, St Andrews HouseEDINBURGH EH1 3DGTeleph<strong>on</strong>e: (0131) 244 0442e-mail:statistics.enquiries@scotland.gsi.gov.ukFurther c<strong>on</strong>tact details, e-mail addresses and details of previous and forthcomingpublicati<strong>on</strong>s can be found <strong>on</strong> the Scottish Government Website atwww.scotland.gov.uk/statisticsComplaints and suggesti<strong>on</strong>sIf you are not satisfied with our service, please write to the Chief Statistician, 4N.06,St Andrews House, Edinburgh, EH1 3DG, Teleph<strong>on</strong>e: (0131) 244 0302, e-mailstatistics.enquiries@scotland.gsi.gov.uk. We also welcome any comments orsuggesti<strong>on</strong>s that would help us to improve our standards of service.ScotStatIf you would like to be c<strong>on</strong>sulted about new or existing statistical collecti<strong>on</strong>s orreceive notificati<strong>on</strong> of forthcoming statistical publicati<strong>on</strong>s, please register your interest<strong>on</strong> the Scottish Government ScotStat website at www.scotland.gov.uk/scotstatISSN 2045-5461Crown CopyrightBrief extracts from the Crown Copyright material in this publicati<strong>on</strong> may bereproduced provided the source is fully acknowledged.
Cover design by <strong>SASA</strong> Photography Services, Brown Rat © Heiko Kiera© Crown copyright 2012You may re-use this informati<strong>on</strong> (excluding logos and images) free of charge in anyformat or medium, under the terms of the Open Government Licence. To view thislicence, visit http://www.nati<strong>on</strong>alarchives.gov.uk/doc/open-government-licence/or e-mail: psi@nati<strong>on</strong>alarchives.gsi.gov.uk.Where we have identified any third party copyright informati<strong>on</strong> you will need toobtain permissi<strong>on</strong> from the copyright holders c<strong>on</strong>cerned.ISBN: 978-1-78256-028-9 (web <strong>on</strong>ly)The Scottish GovernmentSt Andrew’s HouseEdinburghEH1 3DGProduced for the Scottish Government by APS Group ScotlandDPPAS13324 (09/12)Published by the Scottish Government, September 2012Cover design by <strong>SASA</strong> Photography Services, Brown Rw w w . s c o t l a n d . g o v . u k


