The Case of Yellow Fever
The Case of Yellow Fever
The Case of Yellow Fever
- No tags were found...
You also want an ePaper? Increase the reach of your titles
YUMPU automatically turns print PDFs into web optimized ePapers that Google loves.
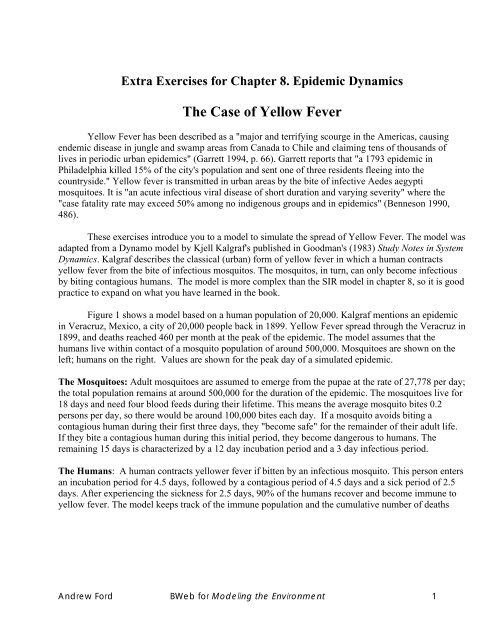
Extra Exercises for Chapter 8. Epidemic Dynamics<strong>The</strong> <strong>Case</strong> <strong>of</strong> <strong>Yellow</strong> <strong>Fever</strong><strong>Yellow</strong> <strong>Fever</strong> has been described as a "major and terrifying scourge in the Americas, causingendemic disease in jungle and swamp areas from Canada to Chile and claiming tens <strong>of</strong> thousands <strong>of</strong>lives in periodic urban epidemics" (Garrett 1994, p. 66). Garrett reports that "a 1793 epidemic inPhiladelphia killed 15% <strong>of</strong> the city's population and sent one <strong>of</strong> three residents fleeing into thecountryside." <strong>Yellow</strong> fever is transmitted in urban areas by the bite <strong>of</strong> infective Aedes aegyptimosquitoes. It is "an acute infectious viral disease <strong>of</strong> short duration and varying severity" where the"case fatality rate may exceed 50% among no indigenous groups and in epidemics" (Benneson 1990,486).<strong>The</strong>se exercises introduce you to a model to simulate the spread <strong>of</strong> <strong>Yellow</strong> <strong>Fever</strong>. <strong>The</strong> model wasadapted from a Dynamo model by Kjell Kalgraf's published in Goodman's (1983) Study Notes in SystemDynamics. Kalgraf describes the classical (urban) form <strong>of</strong> yellow fever in which a human contractsyellow fever from the bite <strong>of</strong> infectious mosquitos. <strong>The</strong> mosquitos, in turn, can only become infectiousby biting contagious humans. <strong>The</strong> model is more complex than the SIR model in chapter 8, so it is goodpractice to expand on what you have learned in the book.Figure 1 shows a model based on a human population <strong>of</strong> 20,000. Kalgraf mentions an epidemicin Veracruz, Mexico, a city <strong>of</strong> 20,000 people back in 1899. <strong>Yellow</strong> <strong>Fever</strong> spread through the Veracruz in1899, and deaths reached 460 per month at the peak <strong>of</strong> the epidemic. <strong>The</strong> model assumes that thehumans live within contact <strong>of</strong> a mosquito population <strong>of</strong> around 500,000. Mosquitoes are shown on theleft; humans on the right. Values are shown for the peak day <strong>of</strong> a simulated epidemic.<strong>The</strong> Mosquitoes: Adult mosquitoes are assumed to emerge from the pupae at the rate <strong>of</strong> 27,778 per day;the total population remains at around 500,000 for the duration <strong>of</strong> the epidemic. <strong>The</strong> mosquitoes live for18 days and need four blood feeds during their lifetime. This means the average mosquito bites 0.2persons per day, so there would be around 100,000 bites each day. If a mosquito avoids biting acontagious human during their first three days, they "become safe" for the remainder <strong>of</strong> their adult life.If they bite a contagious human during this initial period, they become dangerous to humans. <strong>The</strong>remaining 15 days is characterized by a 12 day incubation period and a 3 day infectious period.<strong>The</strong> Humans: A human contracts yellower fever if bitten by an infectious mosquito. This person entersan incubation period for 4.5 days, followed by a contagious period <strong>of</strong> 4.5 days and a sick period <strong>of</strong> 2.5days. After experiencing the sickness for 2.5 days, 90% <strong>of</strong> the humans recover and become immune toyellow fever. <strong>The</strong> model keeps track <strong>of</strong> the immune population and the cumulative number <strong>of</strong> deathsAndrew Ford BWeb for Modeling the Environment 1
1. Build and Verify.Figure 1. Model <strong>of</strong> <strong>Yellow</strong> <strong>Fever</strong> with values shown at the peak <strong>of</strong> the epidemic.Build the model in Figure 1. Initialize the model with 19,900 vulnerable people and 100incubating people. <strong>The</strong> mosquitoes may be initialized with 417,000 safe mosquitos and 83,000 newmosquitos. All other stocks may be set to zero. Simulate the model for 280 days, and you should see theresults in Figure 2. <strong>The</strong> simulation begins with 100 people in the incubation stage. <strong>The</strong> epidemic reachesits peak by the 140th day with around 450 sick people. <strong>The</strong> peak death rate is around 18 people/day.(Kalgraf does not comment on the magnitude <strong>of</strong> the peak death rate, but it is approximately the same asthe reports from Veracruz.) <strong>The</strong> simulation shows the peak <strong>of</strong> the epidemic in the 140th day. Figure 1focuses on the peak day by providing a "snap shot" in what appears to be an equilibrium diagram. Butyou can see that system is not in equilibrium because there are over 8,000 people who remain vulnerableto the disease.<strong>The</strong> mosquito stocks, on the other hand, are close to dynamic equilibrium. <strong>The</strong>re are 81,259mosquitoes in the "new" category. Each <strong>of</strong> these mosquitoes bites 0.2 humans per day, for a total <strong>of</strong> over16,000 bites per day. But only 4.2% <strong>of</strong> these bites draw blood from a contagious human, so they becomedangerous flow is 686 mosquitoes/day.Andrew Ford BWeb for Modeling the Environment 2
Moving down the dangerous side <strong>of</strong> the mosquito stocks, we see 7,909 mosquitoes in theincubation stage and 1,945 in the infectious stage. <strong>The</strong> 1,945 infectious mosquitoes are responsible forthe humans that contract yellow fever in the 140th day. Notice that 8,103 humans are in the vulnerablecategory at this point. <strong>The</strong> epidemic has reduced the total population to 19,014, so 42.6% <strong>of</strong> the humansare vulnerable. <strong>The</strong> flow <strong>of</strong> humans contracting yellow fever is calculated as follows:1,945 contagious mosquitos*0.2 bites/day*42.6% vulnerable = 166 persons/dayThis flow adds to the stock <strong>of</strong> people in the incubation stage. Figure 1 shows 781 people in theincubation stage, 803 in the contagious stage, and 450 sick. With a 2.5 day period <strong>of</strong> sickness, therewould be 180 people reaching the final stage <strong>of</strong> the disease. Kalgraf assumes that 10% would die, so 18people are simulated to die in the 140th day.Figure 2. Simulated outbreak <strong>of</strong> yellow fever in a city <strong>of</strong> 20,000.2. Sensitivity to the Bites Per Day: Conduct the sensitivity analysis displayed in Figure 3.Figure 3. Sensitivity analysis <strong>of</strong> the yellow fever model.<strong>The</strong> first simulation shows that the epidemic would never get started if there were only 0.1 bites/day.<strong>The</strong> second simulation is the base case shown previously. <strong>The</strong> remaining three simulations show morerapid increases to higher peaks if the mosquitoes bite more frequentlyAndrew Ford BWeb for Modeling the Environment 3
3. Sensitivity to the Initial Number <strong>of</strong> Incubating HumansTest the sensitivity <strong>of</strong> the Figure 2 results to a change in the initial value <strong>of</strong> the number <strong>of</strong> incubatingpeople. Document your analysis with a comparative time graph like Figure 3 with the initial number <strong>of</strong>incubating people set at 10, 20, 50 and 100.4. Reproductive NumberReview Hastings' (1997, p. 194) explanation <strong>of</strong> the reproductive number <strong>of</strong> a basic epidemic model.This number combines several model parameters to tell us the mean number <strong>of</strong> new infections caused bya single infective individual. Derive an expression for a reproductive number for the yellow fever model.Do the results in Figure 3 agree with the use <strong>of</strong> the number?5. Causal Loop DiagramFigure 4 shows two feedback loops in the epidemic model. Complete this diagram by labeling eacharrow as + or - and each loop as (+) or (-). You will see a positive feedback loop which powers theinitial growth in the epidemic and a negative loop which applies the brakes to the epidemic.new mosquitosemerging per daymosquitos in theincubation stagemosquitos in thecontagious stagefranction <strong>of</strong> humansthat are vulnerablevulnerable peoplebites per day thatinfect mosquitosbits per day thatinfect humansfraction <strong>of</strong> humans thatcan infect mosquitoshumans in theincubation stage6. <strong>The</strong> Logistic Functionhumans in thecontagious stageFigure 4. Key loops in the model <strong>of</strong> <strong>Yellow</strong> <strong>Fever</strong>. (complete this diagram)Review the logistic function described in Chapter 7. Do you expect to see exponential growth in thenumber <strong>of</strong> people impacted by the epidemic during the early days? If so, estimate the value <strong>of</strong> "r", theintrinsic growth rate <strong>of</strong> the epidemic, based on model parameters (such as the bites/day and the number<strong>of</strong> days spent in each stage <strong>of</strong> the disease.) Does the negative feedback loop in Figure 4 apply the brakesto the epidemic in a linear manner, as required in the logistic function? What is the value <strong>of</strong> "K" to allowthe logistic equation to give an accurate estimate <strong>of</strong> the number <strong>of</strong> people impacted by the epidemic?Andrew Ford BWeb for Modeling the Environment 4
7. Verify the Logistic FunctionReview the method used to confirm the applicability <strong>of</strong> the logistic function in the flower model inexercise 7.7. Apply the same method to confirm the relevance <strong>of</strong> the logistic function to the yellowfever. Define the total population impacted by subtracting the vulnerable people from the 20,000 peoplein the city at the start <strong>of</strong> the simulation. You should find a good match between the simulated value <strong>of</strong>total population impacted and the logistic equation with a K set to 17,721 and r set to 4.2%/day.Policy Simulations<strong>The</strong> previous exercises require you to build and verify the <strong>Yellow</strong> <strong>Fever</strong> Model and to conductsome simple tests. <strong>The</strong>se exercises should not take a lot <strong>of</strong> time, and you will <strong>of</strong>ten know when youhave the right answer. <strong>The</strong> next three exercises challenge you to expand model to simulate policies thatmight reduce the severity <strong>of</strong> the epidemic.8. Expand the Model to Simulate Mosquito Control ProgramsExpand the model to simulate the impact <strong>of</strong> a program to reduce the size <strong>of</strong> the mosquito population bythe application <strong>of</strong> larvacide. You may assume that the larvacide will reduce the number <strong>of</strong> emergingmosquitoes, but it will not directly affect the adult population. Include the start date and the percentreduction in emerging mosquitoes as program parameters that may be specified by the model user.9. Summary <strong>of</strong> Mosquito Control ProgramsUse the expanded model from the previous exercise to experiment with varying start dates and varyingmagnitudes. Summarize your results with a parameter space diagram, a two-dimensional diagram withthe start date on the horizontal axis and the magnitude <strong>of</strong> the mosquito reduction on the vertical axis.Label the space according to whether the simulated control programs would be successful orunsuccessful. For purposes <strong>of</strong> this exercise, define success as limiting the number <strong>of</strong> people impactedby the epidemic to 500 or less.10. Detection and Isolation ProgramsAssume that it is possible to detect the disease during the 4.5 day incubation period and that it is possibleto isolate the infected people before they reach the contagious stage. Add the new stocks and flowsneeded to move a fraction <strong>of</strong> these people into a separate category that is isolated from the mosquitopopulation. As in the previous exercise, allow the start date and the magnitude <strong>of</strong> isolation to bespecified by the model user. Experiment with the new model to learn the program parameters necessaryto limit the number <strong>of</strong> people impacted by the epidemic to 500 or less.Andrew Ford BWeb for Modeling the Environment 5


