Procera Networks Fourth Quarter 2011 Financial Tables
Procera Networks Fourth Quarter 2011 Financial Tables
Procera Networks Fourth Quarter 2011 Financial Tables
- No tags were found...

You also want an ePaper? Increase the reach of your titles
YUMPU automatically turns print PDFs into web optimized ePapers that Google loves.
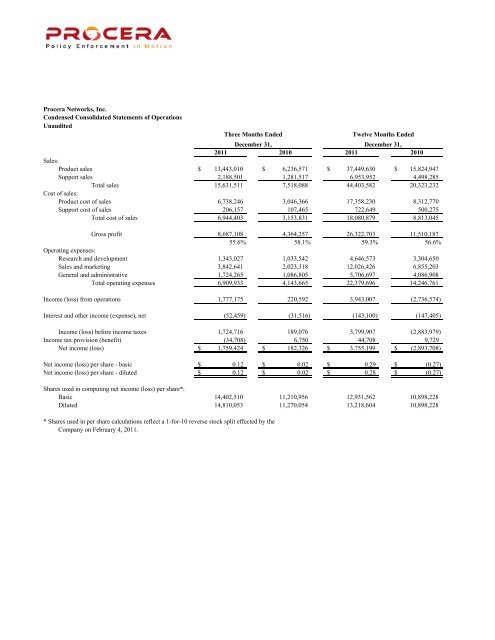
<strong>Procera</strong> <strong>Networks</strong>, Inc.Condensed Consolidated Statements of OperationsUnauditedThree Months EndedDecember 31, December 31,<strong>2011</strong> 2010 <strong>2011</strong> 2010Sales:Product sales $ 13,443,010 $ 6,236,571 $ 37,449,630 $ 15,824,947Support sales 2,188,501 1,281,517 6,953,952 4,498,285Total sales 15,631,511 7,518,088 44,403,582 20,323,232Cost of sales:Product cost of sales 6,738,246 3,046,366 17,358,230 8,312,770Support cost of sales 206,157 107,465 722,649 500,275Total cost of sales 6,944,403 3,153,831 18,080,879 8,813,045Gross profit 8,687,108 4,364,257 26,322,703 11,510,18755.6% 58.1% 59.3% 56.6%Operating expenses:Research and development 1,343,027 1,033,542 4,646,573 3,304,650Sales and marketing 3,842,641 2,023,318 12,026,426 6,855,203General and administrative 1,724,265 1,086,805 5,706,697 4,086,908Total operating expenses 6,909,933 4,143,665 22,379,696 14,246,761Income (loss) from operations 1,777,175 220,592 3,943,007 (2,736,574)Interest and other income (expense), net (52,459) (31,516) (143,100) (147,405)Income (loss) before income taxes 1,724,716 189,076 3,799,907 (2,883,979)Income tax provision (benefit) (34,708) 6,750 44,708 9,729Net income (loss) $ 1,759,424 $ 182,326 $ 3,755,199 $ (2,893,708)Net income (loss) per share - basic $ 0.12 $ 0.02 $ 0.29 $ (0.27)Net income (loss) per share - diluted $ 0.12 $ 0.02 $ 0.28 $ (0.27)Shares used in computing net income (loss) per share*:Basic 14,402,510 11,210,956 12,931,562 10,898,228Diluted 14,810,053 11,270,054 13,218,604 10,898,228* Shares used in per share calculations reflect a 1-for-10 reverse stock split effected by theCompany on February 4, <strong>2011</strong>.Twelve Months Ended
<strong>Procera</strong> <strong>Networks</strong>, Inc.Condensed Consolidated Balance SheetsDecember 31, December 31,<strong>2011</strong> 2010ASSETSCurrent Assets:Cash and cash equivalents $ 23,899,610 $ 7,875,798Short-term investments 13,503,844 -Accounts receivable, net of allowance 11,403,226 11,407,220Inventories, net 7,625,103 2,549,695Prepaid expenses and other 937,579 831,737Total current assets 57,369,362 22,664,450Property and equipment, net 1,806,440 873,173Goodwill 960,209 960,209Other non-current assets 19,673 19,150Total assets $ 60,155,684 $ 24,516,982LIABILITIES AND STOCKHOLDERS' EQUITYCurrent liabilities:Line of credit $ - $ 1,718,732Accounts payable 3,366,207 1,943,799Deferred revenue 5,504,538 3,732,756Accrued liabilities 3,844,894 2,662,564Total current liabilities 12,715,639 10,057,851Non-current liabilities:Deferred revenue 873,039 704,735Total liabilities 13,588,678 10,762,586Commitments and contingencies - -Stockholders' equity:Common stock 14,627 11,315Additional paid-in capital 105,205,360 76,093,272Accumulated other comprehensive loss (389,872) (331,883)Accumulated deficit (58,263,109) (62,018,308)Total stockholders' equity 46,567,006 13,754,396Total liabilities and stockholders' equity $ 60,155,684 $ 24,516,982