Data User’s Guide
Data User's Guide
Data User's Guide
- No tags were found...

You also want an ePaper? Increase the reach of your titles
YUMPU automatically turns print PDFs into web optimized ePapers that Google loves.
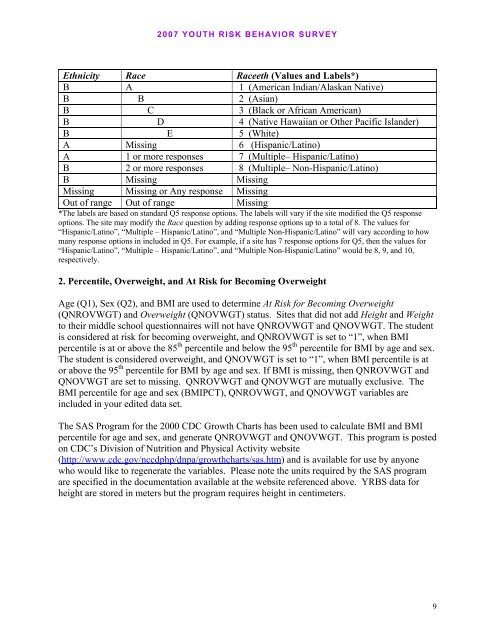
2007 YOUTH RISK BEHAVIOR SURVEYEthnicity Race Raceeth (Values and Labels*)B A 1 (American Indian/Alaskan Native)B B 2 (Asian)B C 3 (Black or African American)B D 4 (Native Hawaiian or Other Pacific Islander)B E 5 (White)A Missing 6 (Hispanic/Latino)A 1 or more responses 7 (Multiple– Hispanic/Latino)B 2 or more responses 8 (Multiple– Non-Hispanic/Latino)B Missing MissingMissing Missing or Any response MissingOut of range Out of range Missing*The labels are based on standard Q5 response options. The labels will vary if the site modified the Q5 responseoptions. The site may modify the Race question by adding response options up to a total of 8. The values for“Hispanic/Latino”, “Multiple – Hispanic/Latino”, and “Multiple Non-Hispanic/Latino” will vary according to howmany response options in included in Q5. For example, if a site has 7 response options for Q5, then the values for“Hispanic/Latino”, “Multiple – Hispanic/Latino”, and “Multiple Non-Hispanic/Latino” would be 8, 9, and 10,respectively.2. Percentile, Overweight, and At Risk for Becoming OverweightAge (Q1), Sex (Q2), and BMI are used to determine At Risk for Becoming Overweight(QNROVWGT) and Overweight (QNOVWGT) status. Sites that did not add Height and Weightto their middle school questionnaires will not have QNROVWGT and QNOVWGT. The studentis considered at risk for becoming overweight, and QNROVWGT is set to “1”, when BMIpercentile is at or above the 85 th percentile and below the 95 th percentile for BMI by age and sex.The student is considered overweight, and QNOVWGT is set to “1”, when BMI percentile is ator above the 95 th percentile for BMI by age and sex. If BMI is missing, then QNROVWGT andQNOVWGT are set to missing. QNROVWGT and QNOVWGT are mutually exclusive. TheBMI percentile for age and sex (BMIPCT), QNROVWGT, and QNOVWGT variables areincluded in your edited data set.The SAS Program for the 2000 CDC Growth Charts has been used to calculate BMI and BMIpercentile for age and sex, and generate QNROVWGT and QNOVWGT. This program is postedon CDC’s Division of Nutrition and Physical Activity website(http://www.cdc.gov/nccdphp/dnpa/growthcharts/sas.htm) and is available for use by anyonewho would like to regenerate the variables. Please note the units required by the SAS programare specified in the documentation available at the website referenced above. YRBS data forheight are stored in meters but the program requires height in centimeters.9