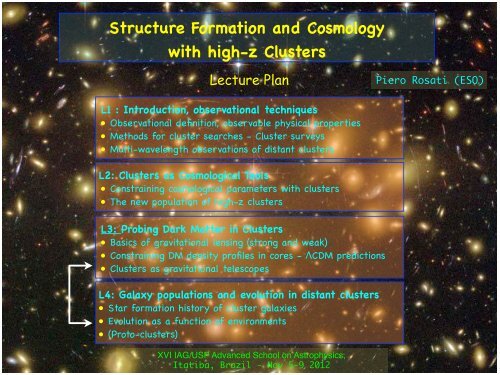
Structure Formation and Cosmology with high-z Clusters
Lecture4 - USP
Lecture4 - USP
- No tags were found...
Create successful ePaper yourself
Turn your PDF publications into a flip-book with our unique Google optimized e-Paper software.
<strong>Structure</strong> <strong>Formation</strong> <strong>and</strong> <strong>Cosmology</strong><strong>with</strong> <strong>high</strong>-z <strong>Clusters</strong>Lecture PlanPiero Rosati (ESO)L1 : Introduction, observational techniques• Observational definition, observable physical properties• Methods for cluster searches - Cluster surveys• Multi-wavelength observations of distant clustersL2: <strong>Clusters</strong> as Cosmological Tools• Constraining cosmological parameters <strong>with</strong> clusters• The new population of <strong>high</strong>-z clustersL3: Probing Dark Matter in <strong>Clusters</strong>• Basics of gravitational lensing (strong <strong>and</strong> weak)• Constraining DM density profiles in cores - !CDM predictions• <strong>Clusters</strong> as gravitational telescopesL4: Galaxy populations <strong>and</strong> evolution in distant clusters• Star formation history of cluster galaxies• Evolution as a function of environments• (Proto-clusters)XVI IAG/USP Advanced School on Astrophysics,Itatiba, Brazil - Nov 5-9 2012
Can we extend this work beyond redshift one ?[...continues from Lecture 3]– Can we measure the DM distribution inz>1 clusters <strong>with</strong> sufficient accuracy ?!evolution of DM distribution– Can we then measure M200 of mostdistant clusters <strong>with</strong> sufficientaccuracy ?!mass calibration of future surveys!test !CDM <strong>with</strong> most massiveclusters N(>10 15 M!,z>1)
Can we extend this work beyond redshift one ?– Can we measure the DM distribution inz>1 clusters <strong>with</strong> sufficient accuracy ?!evolution of DM distribution– Can we then measure M200 of mostdistant clusters <strong>with</strong> sufficientaccuracy ?!mass calibration of future surveys!test !CDM <strong>with</strong> most massiveclusters N(>10 15 M!,z>1)
Can we extend this work beyond redshift one ?
Distribution of baryons <strong>and</strong> DM in a distant cluster (z=1.24)RDCS1252Hot GasHot gas <strong>with</strong>Ch<strong>and</strong>raK-b<strong>and</strong> lightStellar mass<strong>with</strong> VLT/ISAACDM MassWeak Lensing<strong>with</strong> HST/ACSLombardi et al. 05" Weak lensing feasible <strong>with</strong> HST: good news for mass calibration of distant clusters
Distribution of baryons <strong>and</strong> DM in a distant cluster (z=1.24)RDCS1252Hot GasHot gas <strong>with</strong>Ch<strong>and</strong>raK-b<strong>and</strong> lightStellar mass<strong>with</strong> VLT/ISAACDM MassWeak Lensing<strong>with</strong> HST/ACSLombardi et al. 05" Weak lensing feasible <strong>with</strong> HST: good news for mass calibration of distant clusters
Probing the DM mass distribution of most distant systems:Lynx clusters (RDCS0848,49) at z=1.27, M=(1-2)x10 14 M ⊙ (Jee et al. 04)
Weak-lensing analysis from HST/ACS of XMM2235 at z=1.39(Jee, PR et al. 09)
Weak-lensing analysis from HST/ACS of XMM2235 at z=1.39(Jee, PR et al. 09)Mass reconstruction• Shear signal detected out to ~1 Mpc (max >8!), beyond Ch<strong>and</strong>ra, <strong>with</strong> 8150s exp. (i775 b<strong>and</strong>)• X-ray <strong>and</strong> Weak Lensing based masses at r=1 Mpc agree <strong>with</strong>in 5% !
Weak-lensing analysis from HST/ACS of XMM2235 at z=1.39(Jee, PR et al. 09)X-rayLensingMass reconstruction• Shear signal detected out to ~1 Mpc (max >8!), beyond Ch<strong>and</strong>ra, <strong>with</strong> 8150s exp. (i775 b<strong>and</strong>)• X-ray <strong>and</strong> Weak Lensing based masses at r=1 Mpc agree <strong>with</strong>in 5% !
Multiple image system in most distant lens• Flat core to produce radial arcs• NS isothermal density profile fits better than NFW
Multiple image system in most distant lens• Flat core to produce radial arcs• NS isothermal density profile fits better than NFW
Mass components of XMM2235 (at z=1.4!)Inner cored profileM200(
Mass components of XMM2235 (at z=1.4!)Inner cored profileM200(
The core mass distributionc=3.2c
The core mass distributionc=3.2c
The core mass distributionc
WARPSJ1415 at z=1.01 - M200!5"10 14 M"The deepest (370 ksec) Ch<strong>and</strong>ra observations of a z=1 clusterTemperature profilez=3.9 arcACS i/zMetallicity Ch<strong>and</strong>raprofileon Subaru brzHuang et al. 09Cool coreWeak Lensing mass map(Jee et al. 2011)Santos al. 2011
WARPSJ1415 at z=1.01 - M200!5"10 14 M"The deepest (370 ksec) Ch<strong>and</strong>ra observations of a z=1 clusterTemperature profilez=3.9 arcACS i/zMetallicity Ch<strong>and</strong>raprofileon Subaru brzHuang et al. 09Cool coreMass profileWLX-ray! "#$%&! '%(R2500R500R200Weak Lensing mass map(Jee et al. 2011)Santos al. 2011
<strong>Clusters</strong> as Gravitational Telescopes
Geometric scaling of Lensing Signal• Geometrically, strong lensing is maximized at low-to-intermediateredshifts, where, for a given mass, #crit is minimalFor a given mass distribution at z=zLz=0.2z=0.5z=0.8zL=0.5zL=0.2zL=0.8zL=1.4zS
What makes a cluster an efficient gravitational telescope(besides geometrical considerations, DL,DS,DLS) ?• Lensing efficiency (e.g. measured from the number of multiple images)depends from factors which lead to increase the critical area:– ellipticity– degree of merging– degree of substructure– cluster concentration (the <strong>high</strong>er c, the <strong>high</strong>er the lensing efficiency
What makes a cluster an efficient gravitational telescope(besides geometrical considerations, DL,DS,DLS) ?• Lensing efficiency (e.g. measured from the number of multiple images)depends from factors which lead to increase the critical area:– ellipticity– degree of merging– degree of substructure– cluster concentration (the <strong>high</strong>er c, the <strong>high</strong>er the lensing efficiencyCritical curve for zs=1.9Zitrin et al. 2012
Discovery a <strong>high</strong>ly magnified galaxy at z=5.576 (Ellis et al. 01)Magnification=3.8 mag !I mag(unlensed)=29.7 !
Discovery a <strong>high</strong>ly magnified galaxy at z=5.576 (Ellis et al. 01)Magnification=3.8 mag !I mag(unlensed)=29.7 !
Spatial magnification of (strongly) lensed sources
Spatial magnification of (strongly) lensed sourcesExample (Zitrin et al. 2010):! Reconstruction of a z = 4.92 source lensed by the z = 0.33 cluster MS1358+62.! Best resolved <strong>high</strong>-z object: $%100, spatial resolution of ~50 pc ! (rest-frame UV)! Equivalent to 20-m space telescope resolution of a non-lensed z=5 galaxy!! Typical (or better) resolution of ELTsLens planeSource planeDataModelZitrin et al. 2010z = 4.92 GalaxyACS PSF0.2”How object would look <strong>with</strong>out cluster lensing
A primordial galaxy a z!7.6(Bradley et al. 08)
(1 kpc = 0.2” at z=7.6)likelihood ofbest fit modelsH160=24.7AB (observed)=27.1AB whencorrected for ~9.3x magn.MS=(1-4)x10 9 M!Age=(40-300) MyrzF~8-10
Lyman-break galaxy detectionDickinson 1998
Typical LBG LBG C<strong>and</strong>idate Selection SelectionLyman Break Color! Select galaxies in• “Drop-out color-color galaxies” diagramselected in color-color! Require non-detectiondiagramin optical b<strong>and</strong>s• Require non-detection in! (deep) Potential optical b<strong>and</strong>• Potential Contaminants: contaminants:SNe, Supernovae cool stars,photometric Cool Galactic scatter, starsspurious Photometric detections scatterPotential Issues:Missing filtersSpurious optical detectionsRest-frame UV Continuum ColorBowensBouwenset al.et al.2011(2011)
Searching for galaxies beyond z!6• Near-IR wavelengths are needed, as well as deep optical imaging to exclude very dustylower z objects• L<strong>and</strong>mark progress in recent years thanks to WFC3 on HST:! 9 yr of NICMOS: ~10 galaxies at z>6.5! WFC3/IR: 40xSelectionmore efficient (FOV,ofsensitivity,z >~6resolution)Galaxiesthen NICMOS at very<strong>high</strong>-z # 2 yr of WFC3 produced ~150 at z~7--9[only a few spec. confirmed at z=7-7.5]z >~ 6 galaxies can be seen only at NIR wavelengths
Old HST NIR Camera – NICMOS – 72 orbits!"#$%&'(%$#)*&+,()-&.""#/012()-3&45!53&6#'7&89:%(;,)2(
New HST NIR Camera – WFC3 – 16 orbits!"#$%&'#!"#$%&'(%$#)*&+,()-&.""#/012()-3&45!53&6#'7&89:%(;,)2(
The advantage of using gravitational telescopesto search for z>7 galaxiesCluster vs Field strategySurvey LimitThe blue <strong>and</strong> red solid curvesshow the expected number of z=8<strong>and</strong> z=10 galaxies, respectively, tobe discovered behind our 25clusters as a function ofmagnitude in the detection b<strong>and</strong>(F110W at z=8 <strong>and</strong> F140W atz=10).A significant advantage ofsearching for <strong>high</strong>-z objectsbehind strongly lensing clustersis that the lens model can alsobe used to discriminatebetween <strong>high</strong>ly-reddenedobjects <strong>and</strong> truly distant, <strong>high</strong>-zobjects as the projectedposition of the lensed image isa strong function of the sourceredshift.Postman et al. 2012)*+(,+'-'.*%$&/-*+0%+1*(-$0*-%2,&,$/-$#-3*$*1$-3,($%+$-'%&%4,*(Uncertainties on the magnificationare not found to be a seriousproblem for the derivation of theSFR density at very <strong>high</strong>-z
MACS J0329-02: Quadruply-lensed Galaxy at z ph= 6.15Zitrin et al. 2012Age
MACS1149-JD1: z ph= 9.6±0.2Zheng et al. 2012, Nature, Sept.DEFG448H$IJK5:>8L2$M"#M)C&#'"N0&A,'()%&'*$*+,-,./$0+"/1+"&234456$7$34856$9$4:;34856$7$34=?@$*1/10A,'$"'$345>6=4@$*1/10A,'$"'$,-A0&B$*1/10A,'$"C$< 1& < 1 3.6 4.9>28.7 1& 27.5±0.3 26.8±0.213 25.9±0.1 16 25.7±0.1 < 1 3.3 24.8±0.3
Zheng et al. 2012, Nature, Sept.1.56”J$K$H:
The Reionization Epoch <strong>with</strong> HST27Courtesy of L. Bradley
The Impact of Lensing <strong>Clusters</strong>A1689z~7.6CLASHz~1128Courtesy of L. Bradley
Observational Probes of Cluster <strong>Formation</strong> & EvolutionCluster Mass (DM)• Mass Function (e.g. from X-ray) ! N-body simulations, Extended PS• Mass Distribution (inner cores from Lensing) ! CDM simulationsIntra-Cluster Medium (ICM)• Cluster Scaling Relations (L x-T, M-T, Entropy, f gas)• Gas Metallicity! hydro cosmo simulations + SAMs + chemical evolutionbaryonsGalaxies/Stellar Mass Assembly• Spectrophotometry, line diagnostics• Red Sequence of Early types: normalization, scatter, slope• Luminosity Function of cluster galaxies• M/L (fundamental plane), Stellar Mass Function! ! stellar synthesis + semi-analytical models (SAM) + hydro simulations
Large look-back times " stronger leverage on models(fractional age differences among galaxies are greater, #T/T ! <strong>with</strong> z)"Color Sequence Evolution: stellar populationmodels for a 2 Gyr burst <strong>and</strong> z F= 4,3,2!Evolution of M/L of cluster early-types:observations <strong>and</strong> models (van Dokkum et al .02)# ln(M/L B ) $ (1.0 ± 0.2) z = f(%, IMF, Z)derived from the Fundamental Plane:
The colour-magnitude diagram indifferent environments“blue cloud”Baldry et al. 2003
The Color-Magnitude relation in clustersCMD in the Coma cluster (Terlevich A. et al. 99)
The Color-Magnitude relation in clustersCMD in the Coma cluster (Terlevich A. et al. 99)• The red sequence becomes extremely narrow(
RDCS1252 (z = 1.24) C-M Relation <strong>with</strong> HST/ACS <strong>and</strong> VLT/ISAAC(Blakeslee et al. 03; Lidman et al. 03)
RDCS1252 (z = 1.24) C-M Relation <strong>with</strong> HST/ACS <strong>and</strong> VLT/ISAAC(Blakeslee et al. 03; Lidman et al. 03)HST/ACSComa at z=1.24ES0LateBlakeslee et al. 2003The scatter (0.042±0.015 mag in i-z, 0.06 in J-K) <strong>and</strong> slope of the redsequence are very similar to low-z clusters (e.g. Coma)
Using the color sequence to constrain the formation history of ETGsslopeBower et al. 92Ellis et al. 97Stanford et al. 97vanDokkum et al. 01Blakeslee et al. 06scatterHomeier et al. 06Blakeslee et al. 03Mei et al. 06aMei et al. 06bSantos et al. 08Lidman et al. 08Mei & ACS team, 08No (or little) evolution of the CMD slope <strong>and</strong> scatter out to z=1.4! The Cluster RS frozen over ~9 Gyr, well <strong>with</strong>in 0.1 mag!
A Nascent Red Sequence at z&2MRC1138-262 (z=2.16) (Zirm et al. 2008)H! emittersMRC1138Ly! emittersDeep FieldsJ110-H160
SF histories of ETGs in clusters (<strong>and</strong> field) at z~1.2A long-st<strong>and</strong>ing prediction of hierarchical models is that early-type galaxies in the field are younger <strong>and</strong>less massive than those in cluster cores, since galaxy formation is accelerated in dense environments…(Gobat al. 2008; Rettura et al. 08,11, Tanaka et al. 11)RDCS 1252GOODS (z~1.25)• Star formation in clusters is accelerated, rather than significantly delayed• Galaxy mass regulates the timing of galaxy formation, the environment regulates the timescale of SFH
SF histories of ETGs in clusters (<strong>and</strong> field) at z~1.2A long-st<strong>and</strong>ing prediction of hierarchical models is that early-type galaxies in the field are younger <strong>and</strong>less massive than those in cluster cores, since galaxy formation is accelerated in dense environments…(Gobat al. 2008; Rettura et al. 08,11, Tanaka et al. 11)z∼0 (fossil record)(Thomas et al. 2005)• Star formation in clusters is accelerated, rather than significantly delayed• Galaxy mass regulates the timing of galaxy formation, the environment regulates the timescale of SFH• Fossil record data in the local Universe show an increased lag between SFHs
SF histories of ETGs in clusters vs field at z~1.2• General agreement <strong>with</strong> semi-analytical models (e.g. De Lucia+ 06, Menci+ 08)• Models however cannot reproduce the very tight relation in clusters (Menci+ 08)Color scatterModelsDataRedshift
Measuring metallicity of the ICM at z>1
Measuring metallicity of the ICM at z>1
Out to z=1.4: Ch<strong>and</strong>ra Observations of XMM2235CoreRosati et al. 09Core! The ICM is already enriched at local values at z=1.4 (metal enrichmentmust be completed by z# 2.5)• Global fit:• Core fit (r=7.5”=60 kpc):
Evolution of ICM metallicity from Ch<strong>and</strong>ra Observations of distant clustersMethod:stacking spectral analysis of asample of 20 <strong>high</strong>-z clusters(0.3
WARPSJ1415 at z=1.01 - M200!5"10 14 M"The deepest (370 ksec) Ch<strong>and</strong>ra observations of a z=1 clusterCh<strong>and</strong>ra on Subaru brzMetallicity profileat z=1 !Santos al. 2011
Galaxy populations in distant clustersClear signs (from spectro-photometry <strong>and</strong> morphology) of evolution of ETGs in <strong>high</strong>densitiesat z~1.5#2 <strong>and</strong> (perhaps) enhanced AGN activity2012proto-clusters around RGs/AGNMassive cluster formation ?(Gobat et al. 2011)z=2.07(Santos et al. 2011)IDCS 14626+36(Stanford et al. 2012)z=1.75
Galaxy populations in distant clustersIdentification of the epoch when massive galaxies showed the first signs of SF as a functionof galaxy mass, environmental density <strong>and</strong> cluster halo mass can set tight constraints ongalaxy formation modelsIntermediate mass clusters at 1.5
Approaching the epoch of cluster formationCluster baryon formation history! Probing Hot <strong>and</strong> Cold baryonsat 1.5
THANKS!XVI IAG/USP Advanced School on Astrophysics,Itatiba, Brazil - Nov 5-9 2012
THANKS!Message to the students...• Feel free to email me (prosati@eso.org) forquestions, mistakes, references or..if you have a good idea about a project <strong>with</strong> thematerial I have shown!• If they tell you that the “golden age of Astronomy isover”, don’t believe them!They haven’t seen anything yet !• Vast territory ahead for new discoveries: astechnology is getting ahead <strong>with</strong> data volume <strong>and</strong>quality, intellectual exploitation of this goldmine willremain the main challengeXVI IAG/USP Advanced School on Astrophysics,Itatiba, Brazil - Nov 5-9 2012


