National Census Report 2001, St. Vincent and the GrenadinesTable 5.5 (b): Percentage of Employed Population 15 years or Over by Industry, Age Group,and Sex, 2001Age groupIndustry Total 15-19 20-24 25-29 30-34 35-39 40-44 45-49 50-54 55-59 60-64 65 +Total 35,036 1,877 4,749 5,020 4,832 5,341 4,456 3,121 2,296 1,343 923 1,078100.00 100 100 100 100 100 100 100 100 100 100 100Agriculture 13.73 9.59 6.91 8.75 11.30 14.79 15.62 15.19 16.29 21.44 31.09 38.03Fishing 1.46 1.28 0.80 0.96 1.30 1.35 1.50 1.51 2.13 3.35 3.58 2.32Manufacturing 7.01 10.55 9.03 6.57 6.42 6.80 6.91 6.73 6.01 5.44 5.09 4.64Electricity, Gas, and Water Supply 1.72 0.96 1.14 1.45 1.99 1.87 2.49 2.21 1.83 2.16 0.65 0.28Construction 10.48 14.28 13.16 11.47 11.03 10.84 9.58 7.91 8.23 8.79 5.63 5.38Wholesale and Retail trade,etc 16.88 23.55 18.05 17.01 15.91 15.45 14.99 15.86 16.29 17.35 18.96 20.59Hotels and Restaurants 6.85 7.62 9.33 8.51 8.01 6.35 5.48 5.03 5.10 4.84 5.09 2.78Transport, Storage and Communications 7.44 6.29 7.98 10.24 8.73 7.34 6.01 6.54 6.45 5.96 5.20 3.06Financial Intermediation 2.30 1.01 3.62 3.09 2.30 2.23 2.11 1.76 1.70 1.41 1.30 1.11Real Estate, Renting and Business Activities 3.16 3.94 5.10 3.67 2.73 2.36 2.51 2.79 2.74 2.31 2.82 2.78Public Administration, Social Security 6.16 3.25 6.76 6.83 6.31 5.75 7.07 7.37 7.19 4.91 2.49 1.95Education 7.18 3.30 4.74 6.43 7.62 8.76 9.18 10.67 8.41 6.03 2.17 2.97Health and Social Work 2.13 0.27 1.24 1.53 2.55 2.64 2.92 2.76 3.05 2.98 0.87 0.65Other Community, Soc. & Pers Serv Act 3.45 3.20 4.04 3.86 3.31 2.68 3.12 2.82 4.09 4.24 5.20 2.97Extra-territorial Organisations and Bodies 0.04 0.00 0.04 0.04 0.00 0.04 0.02 0.06 0.13 0.00 0.33 0.00Not Stated 10.02 10.92 8.06 9.58 10.49 10.77 10.48 10.80 10.37 8.79 9.53 10.48Male 21,518 1,312 2,888 2,995 2,960 3,192 2,654 1,842 1,426 884 620 745100.00 100.00 100.00 100.00 100.00 100.00 100.00 100.00 100.00 100.00 100.00 100.00Agriculture 17.72 12.27 9.90 12.25 15.10 19.83 19.29 19.33 19.35 24.66 35.48 45.10Fishing 2.29 1.75 1.25 1.57 2.06 2.19 2.37 2.55 3.37 4.75 5.16 3.22Manufacturing 8.04 13.11 11.05 7.45 7.06 7.68 7.61 7.76 6.52 6.11 5.32 5.10Electricity, Gas, and Water Supply 2.31 0.99 1.39 1.80 2.43 2.76 3.54 3.47 2.66 3.05 0.81 0.40Construction 16.23 19.82 20.57 18.36 17.33 17.14 15.07 12.76 12.62 12.90 7.58 6.98Wholesale and Retail trade,etc 13.48 22.10 15.96 13.62 12.36 11.50 12.40 11.62 12.62 11.43 13.55 13.42Hotels and Restaurants 4.84 5.26 6.30 6.08 5.44 4.07 3.88 4.51 3.51 3.96 3.71 3.22Transport, Storage and Communications 9.99 7.70 10.53 14.16 11.69 10.06 8.40 8.63 8.98 7.92 6.77 4.30Financial Intermediation 1.32 0.76 1.80 1.60 1.49 1.13 1.17 0.87 1.68 0.90 1.13 1.07Real Estate, Renting and Business Activities 2.14 1.98 2.49 1.94 1.86 1.60 2.15 2.55 2.38 2.38 3.06 2.82Public Administration, Social Security 6.44 3.05 7.38 7.15 6.76 5.39 7.54 8.31 7.71 5.20 3.55 2.15Education 3.76 0.84 1.25 2.10 3.55 5.14 5.69 7.65 5.05 4.98 1.45 1.74Health and Social Work 0.86 0.08 0.28 0.60 1.05 0.85 1.09 1.30 1.33 2.26 0.81 0.27Other Community, Soc.& Per Service Act 3.19 2.44 3.08 2.97 2.94 2.47 3.01 3.15 4.49 4.98 5.81 3.76Extra-territorial Organisations and Bodies 0.03 0.00 0.07 0.00 0.00 0.03 0.00 0.11 0.07 0.00 0.00 0.00Not Stated 7.36 7.85 6.72 8.35 8.89 8.18 6.78 5.43 7.64 4.52 5.81 6.44Female 13518 565 1861 2025 1872 2149 1802 1279 870 459 303 333100.00 100.00 100.00 100.00 100.00 100.00 100.00 100.00 100.00 100.00 100.00 100.00Agriculture 7.40 3.36 2.26 3.56 5.29 7.31 10.21 9.23 11.26 15.25 22.11 22.22Fishing 0.13 0.18 0.11 0.05 0.11 0.09 0.22 0.00 0.11 0.65 0.33 0.30Manufacturing 5.36 4.60 5.91 5.28 5.40 5.49 5.88 5.24 5.17 4.14 4.62 3.60Electricity, Gas, and Water Supply 0.76 0.88 0.75 0.94 1.28 0.56 0.94 0.39 0.46 0.44 0.33 0.00Construction 1.33 1.42 1.67 1.28 1.07 1.49 1.50 0.94 1.03 0.87 1.65 1.80Wholesale and Retail trade,etc 22.30 26.90 21.28 22.02 21.53 21.31 18.81 21.97 22.30 28.76 30.03 36.64Hotels and Restaurants 10.04 13.10 14.02 12.10 12.07 9.73 7.82 5.79 7.70 6.54 7.92 1.80Transport, Storage and Communications 3.37 3.01 4.03 4.44 4.06 3.30 2.50 3.52 2.30 2.18 1.98 0.30Financial Intermediation 3.87 1.59 6.45 5.28 3.58 3.86 3.50 3.05 1.72 2.40 1.65 1.20Real Estate, Renting and Business Activities 4.78 8.50 9.13 6.22 4.11 3.49 3.05 3.13 3.33 2.18 2.31 2.70Public Administration, Social Security 5.70 3.72 5.80 6.37 5.61 6.28 6.38 6.02 6.32 4.36 0.33 1.50Education 12.61 9.03 10.16 12.84 14.05 14.15 14.32 15.01 13.91 8.06 3.63 5.71Health and Social Work 4.16 0.71 2.74 2.91 4.91 5.30 5.60 4.85 5.86 4.36 0.99 1.50Other Community, Soc. & Pers. Serv Act 3.85 4.96 5.53 5.19 3.90 2.98 3.27 2.35 3.45 2.83 3.96 1.20Extra-territorial Organisations and Bodies 0.07 0.00 0.00 0.10 0.00 0.05 0.06 0.00 0.23 0.00 0.99 0.00Not Stated 14.26 18.05 10.16 11.41 13.03 14.61 15.93 18.53 14.83 16.99 17.16 19.5270
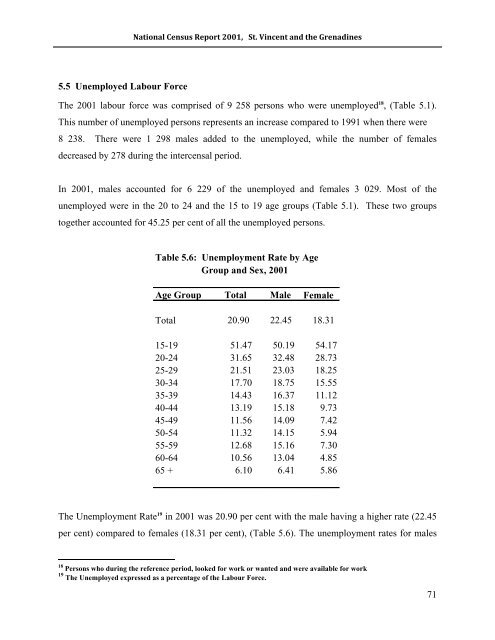
National Census Report 2001, St. Vincent and the Grenadines5.5 Unemployed Labour ForceThe 2001 labour force was comprised of 9 258 persons who were unemployed 18 , (Table 5.1).This number of unemployed persons represents an increase compared to 1991 when there were8 238. There were 1 298 males added to the unemployed, while the number of femalesdecreased by 278 during the intercensal period.In 2001, males accounted for 6 229 of the unemployed and females 3 029. Most of theunemployed were in the 20 to 24 and the 15 to 19 age groups (Table 5.1). These two groupstogether accounted for 45.25 per cent of all the unemployed persons.Table 5.6: Unemployment Rate by AgeGroup and Sex, 2001Age Group Total Male FemaleTotal 20.90 22.45 18.3115-19 51.47 50.19 54.1720-24 31.65 32.48 28.7325-29 21.51 23.03 18.2530-34 17.70 18.75 15.5535-39 14.43 16.37 11.1240-44 13.19 15.18 9.7345-49 11.56 14.09 7.4250-54 11.32 14.15 5.9455-59 12.68 15.16 7.3060-64 10.56 13.04 4.8565 + 6.10 6.41 5.86The Unemployment Rate 19 in 2001 was 20.90 per cent with the male having a higher rate (22.45per cent) compared to females (18.31 per cent), (Table 5.6). The unemployment rates for males18 Persons who during the reference period, looked for work or wanted and were available for work19 The Unemployed expressed as a percentage of the Labour Force.71
- Page 1:
CARICOM CAPACITY DEVELOPMENTPROGRAM
- Page 4:
National Census Report 2001, St. Vi
- Page 7 and 8:
National Census Report 2001, St. Vi
- Page 9 and 10:
National Census Report 2001, St. Vi
- Page 11 and 12:
National Census Report 2001, St. Vi
- Page 13 and 14:
National Census Report 2001, St. Vi
- Page 15 and 16:
National Census Report 2001, St. Vi
- Page 17 and 18:
National Census Report 2001, St. Vi
- Page 19 and 20:
National Census Report 2001, St. Vi
- Page 21 and 22:
National Census Report 2001, St. Vi
- Page 23 and 24:
National Census Report 2001, St. Vi
- Page 25 and 26:
National Census Report 2001, St. Vi
- Page 27 and 28:
National Census Report 2001, St. Vi
- Page 29 and 30:
National Census Report 2001, St. Vi
- Page 31 and 32:
National Census Report 2001, St. Vi
- Page 33 and 34:
National Census Report 2001, St. Vi
- Page 35 and 36:
National Census Report 2001, St. Vi
- Page 37 and 38: National Census Report 2001, St. Vi
- Page 39 and 40: National Census Report 2001, St. Vi
- Page 41 and 42: National Census Report 2001, St. Vi
- Page 43 and 44: National Census Report 2001, St. Vi
- Page 45 and 46: National Census Report 2001, St. Vi
- Page 47 and 48: National Census Report 2001, St. Vi
- Page 49 and 50: National Census Report 2001, St. Vi
- Page 51 and 52: National Census Report 2001, St. Vi
- Page 53 and 54: National Census Report 2001, St. Vi
- Page 55 and 56: National Census Report 2001, St. Vi
- Page 57 and 58: National Census Report 2001, St. Vi
- Page 59 and 60: National Census Report 2001, St. Vi
- Page 61 and 62: National Census Report 2001, St. Vi
- Page 63 and 64: National Census Report 2001, St. Vi
- Page 65 and 66: National Census Report 2001, St. Vi
- Page 67 and 68: National Census Report 2001, St. Vi
- Page 69 and 70: National Census Report 2001, St. Vi
- Page 71 and 72: National Census Report 2001, St. Vi
- Page 73 and 74: National Census Report 2001, St. Vi
- Page 75 and 76: National Census Report 2001, St. Vi
- Page 77 and 78: National Census Report 2001, St. Vi
- Page 79 and 80: National Census Report 2001, St. Vi
- Page 81 and 82: National Census Report 2001, St. Vi
- Page 83 and 84: National Census Report 2001, St. Vi
- Page 85 and 86: National Census Report 2001, St. Vi
- Page 87: National Census Report 2001, St. Vi
- Page 91 and 92: National Census Report 2001, St. Vi
- Page 93 and 94: National Census Report 2001, St. Vi
- Page 95 and 96: National Census Report 2001, St. Vi
- Page 97 and 98: National Census Report 2001, St. Vi
- Page 99 and 100: National Census Report 2001, St. Vi
- Page 101 and 102: National Census Report 2001, St. Vi
- Page 103 and 104: National Census Report 2001, St. Vi
- Page 105 and 106: National Census Report 2001, St. Vi
- Page 107 and 108: National Census Report 2001, St. Vi
- Page 109 and 110: National Census Report 2001, St. Vi
- Page 111 and 112: National Census Report 2001, St. Vi
- Page 113 and 114: National Census Report 2001, St. Vi
- Page 115 and 116: National Census Report 2001, St. Vi
- Page 117 and 118: National Census Report 2001, St. Vi
- Page 119 and 120: National Census Report 2001, St. Vi
- Page 121 and 122: National Census Report 2001, St. Vi
- Page 123 and 124: National Census Report 2001, St. Vi
- Page 125 and 126: National Census Report 2001, St. Vi
- Page 127 and 128: National Census Report 2001, St. Vi
- Page 129 and 130: National Census Report 2001, St. Vi
- Page 131 and 132: National Census Report 2001, St. Vi
- Page 133 and 134: National Census Report 2001, St. Vi
- Page 135 and 136: National Census Report 2001, St. Vi
- Page 137 and 138: National Census Report 2001, St. Vi
- Page 139 and 140:
National Census Report 2001, St. Vi
- Page 141 and 142:
National Census Report 2001, St. Vi
- Page 143 and 144:
National Census Report 2001, St. Vi
- Page 145 and 146:
National Census Report 2001, St. Vi
- Page 147 and 148:
National Census Report 2001, St. Vi
- Page 149 and 150:
National Census Report 2001, St. Vi
- Page 151 and 152:
National Census Report 2001, St. Vi
- Page 153 and 154:
National Census Report 2001, St. Vi
- Page 155 and 156:
National Census Report 2001, St. Vi
- Page 157 and 158:
National Census Report 2001, St. Vi
- Page 159 and 160:
National Census Report 2001, St. Vi
- Page 161 and 162:
National Census Report 2001, St. Vi
- Page 163 and 164:
National Census Report 2001, St. Vi
- Page 165 and 166:
National Census Report 2001, St. Vi