contents
jrasc dec 1998 - The Royal Astronomical Society of Canada
jrasc dec 1998 - The Royal Astronomical Society of Canada
- No tags were found...

You also want an ePaper? Increase the reach of your titles
YUMPU automatically turns print PDFs into web optimized ePapers that Google loves.
4Market FailuresWhat are some of the identifiable sources of market failures that led to the currentfinancial turbulence?First, the prolonged benign macroeconomic conditions gave rise to complacencyamong many market participants and led to an erosion of sound practices, resulting inadoption of poor credit risk appraisal standards.Second, some of the standard risk management tools and models used by marketparticipants were not equipped to estimate the potential impact of adverse events forstructured credit products and high uncertainty around model estimates that largelymissed the underlying combination of risks. Further, these risk models, generally tendedto induce the market participants to adopt a unidirectional approach.Third, many investors, including institutional ones, with the capacity to undertaketheir own credit analysis, did not undertake sufficient in-house examination of the risks inthe assets underlying structured investments.Fourth, the role of credit rating agencies (CRAs) in the recent marketdevelopments has attracted attention.Fifth, the distortions in incentive structures can be seen from various perspectivesnamely incentives for originators, arrangers, distributors and managers in the originateto-distributemodel; the compensation schemes in financial institutions not distinguishingbetween realised and unrealised profits; encouraging financial structures tailored toobtaining high ratings etc.Sixth, weaknesses in public disclosures by financial institutions on the type andmagnitude of risks associated with their on- and off-balance sheet exposures arenoticeable.Seventh, large commercial banks and investment banks have assumedincreasingly similar risk profiles, use similar models to assess and are subject to thesame risk-management challenges under the given circumstances.Eighth, there is a new dimension to bank liquidity, with the shifting emphasis to amarket based wholesale or purchased liabilities. This makes banks increasinglydependent on the market for raising liquidity, while markets may have a tendency to shyaway from providing liquidity when they are most needed.Regulatory ShortcomingsWhile the foregoing brings out the failures of the markets and of the marketparticipants, some of the regulatory shortcomings identified are as follows.
twelve divisions to account for the Sun’s unseen motion whilebelow the horizon, and you have fully explained the origin ofa 24-hour day. The reason for choosing six equal portions ratherthan, say, five or ten likely relates to the fact that six is a perfectnumber. In other words, we have a 24-hour day because six isa perfect number.Time zones and Daylight Saving Time are more recentadditions to our method of keeping time, and they in turnproduce some rather curious results. The interesting effectproduced on the observed times for sunrise throughout theyear as a result of the switch from Daylight Saving Time toStandard Time in late October is addressed in this issue byDavid Chapman. The even more remarkable local variations indaylight saving time arrangements, or non-arrangements, thatexist across Canada are described by H. David Matthews andMary Vincent in their GeoMap article “It’s about time” appearingin the September/October 1998 issue of Canadian Geographic.The article makes a fascinating read for those interested inknowing the exact details of how watch time is regulated indifferent parts of Canada.News NotesEn ManchettesMONT MÉGANTIC HAPPENINGSThe Mont Mégantic Observatory, shared by l’Université Lavalin Quebec City and l’Université de Montréal, celebrated itstwentieth anniversary in an asteroidal manner. A mid-sizedmain-belt asteroid discovered February 20, 1990, by the Belgianastronomer Henri Debehogne has been named in its honour(see JRASC, 92, 227, 1998, October). Situated in the EasternTownships of southern Quebec, the observatory has been afocal point for astronomical activity and popularization, andrecently the research facility has been joined by the new“Observatoire Populaire du Mont Mégantic,” which has educationalfacilities including telescopes available for public viewing.LEONID METEORSBy the time this note is published the 1998 Leonid meteorshower may have turned out to be a meteor storm reminiscentof that of 1966, although it was not expected to reach the levelsof up to 150,000 meteors per hour reported that year fromwestern North America. Although the forecast storm levelswere only one-tenth of that peak rate, the present recurrenceis significant in that there is now far more space hardwaresusceptible to damage by the micron-sized meteoroids. Sucha potential for damage, as well as scientific interest in the event,led to international expeditions being mounted, including apaired expedition to Mongolia and Australia conducted by theToronto-based Centre for Research in Earth and Space Technology(CRESTech), with participation by Canadian universities, theUnited States Air Force, the Canadian Space Agency, the CanadianDepartment of National Defence, the Hughes Space Corporation,and the European Space Agency. With the aid of electro-opticalcamera systems and radar, those participating in the expeditionhoped to obtain real-time data about the hazard levels frommeteoroids during the storm period.The Leonid meteoroids have high space velocity, of orderThe Mont Mégantic Observatory celebrated the 15 th Festival d’AstronomiePopulaire du Mont-Mégantic July 10–12, 199870 km s –1 , and upon impact with a spacecraft vapourize intosmall plasma clouds capable of causing short circuits in sensitiveelectronic components. There has been increasing awarenessof the hazards of the near-Earth environment resulting fromsolar and magnetospheric activity, but the meteoroid hazardhas not been seriously evaluated despite the loss of a spacecraftduring high Perseid activity several years ago. The storm periodfor 1998 is brief, only about one hour long, thus necessitatingtravel to a favourable longitude for proper observation. Generallya 33-year recurrence period is associated with the Leonids,with enhanced levels for one to three years. Thus it is quitelikely that the Leonids will be strong again in 1999. Unfortunatelyfor Canadian ground-based observers, the present predictionis for prime viewing in Eastern Europe in 1999. More informationon the Leonids can be found at the web sitewww.imo.net/news/leohints.html.KITCHENER METEORITEAccording to a newspaper story in the Kitchener-WaterlooRecord, golfing may be more hazardous than previously thought.Golfer Orville Delong had a meteorite pass close to his headwhile he was golfing at the Doon Valley Golf Club on the morningof Sunday, July 12. The golf course is located just northwest ofHighway 401 and somewhat east and south of Kitchener nearDecember/décembre 1998 JRASC279
the village of Doon. Mr. Delong subsequently retrieved the fistsizedpiece of space debris and had it confirmed as a stonymeteorite — complete with fusion crust — by scientists fromthe University of Toronto. The meteorite, now known as theKitchener Meteorite, presently resides with curator RichardHerd of the National Collection. While meteorite finds arecommon (although not as common as finds of misidentified“meteor-wrongs”), falls occur much less frequently. If enoughobservations are gathered, a fall may be used to identify thelikely origin of a meteorite based upon its orbit. Only fourmeteorites have ever had reliable enough sighting data for theirprecise pre-collision orbits to be established with certainty,and it is unlikely that this daylight event will be analyzed insuch fashion. The prompt recovery of the specimen permittedstudy of the short-lived radioactive isotopes that are presentin small amounts in freshly fallen meteorites. Meanwhile, onewonders who is responsible for yelling “fore” when a meteoriteis seen flying over a golf course.A SUPERLATIVE CANADIAN SATELLITEThe Microvariability and Oscillations of STars project (seeJRASC, 92, 223, 1998, October), or MOST, will place a smalltelescope in Earth orbit to study stellar structure and evolution.Under Principal Investigator Jaymie Matthews of the Departmentof Physics and Astronomy of the University of British Columbia,a team of Canadian and U.S. researchers and designers willdevelop an instrument capable of doing extremely accuratestellar photometry over extended periods of time. Workingabove the atmosphere, an instrument of a size familiar to mostamateurs, with a novel stabilization and pointing system, willbe able to record extremely small variations in stellar light.Much like seismic waves have certain favoured frequencies tiedto the structure of the Earth, it is expected (and known alreadyto be so in the case of the Sun) that stars will show preferencefor oscillations at certain frequencies depending upon theirstructures. As a result, the expected changes in the structureand dimension of stars as they mature should affect their modesof oscillation in such a manner that a knowledge of them canbe used to determine their ages. MOST is part of the CanadianSpace Agency’s (CSA) Small Payloads Program, and CSA willcontribute $4 million to its cost.IS JUPITER A NOT-SO-FAILED STAR?For decades astronomers have been perplexed by the excessamount of heat coming from the planet Jupiter; the planetactually emits slightly more energy than it receives from theSun. Now a group of Canadian astronomers, led by RachidOuyed of Saint Mary’s University in Halifax, may have a solutionthat could radically change the way we think about our largestplanet (July 1 issue of the Astrophysical Journal).A new interior model of Jupiter proposed by Ouyed et al.Previously the accepted explanation for the extra heatwas through the slow release of gravitational potential energyassociated with the planet’s formation and contraction. Accordingto such a model, heat from the interior of the planet is transportedto the surface through convection. The model does have problems,however, since it has difficulty accounting for Jupiter’s powerfulmagnetic field and also results in an estimated age for the planetthat is perhaps 500 million years older than the accepted valueof 4.5 to 4.6 billion years.Ouyed, with his collaborators Wojciech Fundamenski ofthe University of Toronto and Gregory Cripps and Peter Sutherlandof McMaster University, have put together an alternative andpotentially revolutionary explanation for the excess heat. Theypropose that it may be produced by nuclear fusion, the samebasic engine that powers the Sun and stars. In the core of theSun, 15 million-degree temperatures and 250,000 Mbar pressures(approximately 250 billion sea level atmospheres) are sufficientto fuse hydrogen nuclei into helium, releasing huge amountsof energy. Jupiter, on the other hand, has a core temperature ofonly about 20,000 K and central pressures of 40 Mbar. Accordingto Ouyed’s team, such conditions are still sufficient for deuterium– deuterium fusion to produce the isotope 3 He (helium-3).Deuterium is an isotope of hydrogen that has a nucleus composedof a neutron and proton instead of the single proton found inthe nucleus of the hydrogen atom. The Ouyed et al. modelrequires that 5% to 15% of Jupiter’s deuterium must have beendeposited relatively quickly into the core of the planet duringits formation in order to account for present observations ofthe planet’s heat and interior sound velocities. The exactmechanism capable of transporting that amount of deuteriumhas not yet been thoroughly established. Ouyed and hiscollaborators argue, however, that deuterium sedimentationcould be possible if Jupiter was formed from the collision andcoalescence of planetesimals rather than forming directly froma primordial gas cloud.The total energy output is estimated to be less than abillionth the amount from the Sun. However, according to thecalculations presented by Ouyed et al., Jupiter would be ableto sustain such a tiny nuclear power plant for 100 billion years,outlasting our Sun ten times over. Ouyed has also extended theconcept to the other gaseous planets. The team concluded that280JRASC December/décembre 1998
if they formed under similar conditions, then deuterium fusionmight also be taking place deep in the cores of Saturn, Uranusand Neptune.For many years Jupiter has been called a “failed star” owingto its Sun-like composition and apparent absence of a nuclearfurnace. That way of thinking may have to change.Rev. 30-Oct-98 – one image past.tif FROM – THE place PAST within or after News NotesAU FIL DES ANSFROM THE PASTAU FIL DES ANSOBSERVATIONS OF THE 1933 LEONIDS — PART IA program of photographic and visual observations of the Leonid meteors wascarried out at a number of stations in and near Toronto on the nights of Nov.14-15, 15-16, and 16-17, 1933. It is proposed this month to discuss thoseobservations made at the David Dunlap Observatory and next month to reporton the others.The visual observations were organized on the same general plan as thoseof 1932 at the Harvard Observatory. Groups were made up of one recordertogether with three to six observers. All meteors seen were plotted and recordedto the nearest second. Each group worked independently, covering a certainportion of the sky. Later, the records of the various groups were compared, allduplicate meteors picked out, and thus the total count for the whole partydetermined. Mr. K. O. Wright, of the Department of Astronomy at Toronto, tookcomplete charge of the organization and the carrying out of the observationsat the David Dunlap Observatory, the writer being located at the HarvardObservatory during the Leonid period. Mr. Wright also performed the above reduction, the chief difficulty encountered being uncertainties in timingowing to the fact that some of the timepieces did not function properly in the below-zero weather which greeted the observers. Observations werealso made with a reticle simiIar to that described in Popular Astronomy, 41, 283, 1933.* * * * *The nights of Nov. 14-15 and 15-16 were clear and cold. Nov. 16-17 started to cloud in shortly after midnight and after alternate clearing andclouding till 3 a.m. the sky clouded up for the rest of the night. For that reason no estimate of the total number of meteors appearing on Nov. 16-17 can be obtained from the Toronto observations. The total number of meteors observed by the whole party is given in Table I. These numberscontain no duplicate meteors.Of these meteors 630 were plotted on the maps. Since the number of observers varied throughout the night it was thought best to reducethe above counts to a standard of six observers and this was done by multiplying the actual count for each twenty-minute interval by the factorsin Table II. These factors depend on the number of observers and were formed from an average of tables given by Denning, (Obs., 80, 373, 1897),and Kleiber, (A.N., 110, 69, 1884). Denning concluded that six observers will see half the meteors visible.The reduced rates for the first two nights are shown in the diagram, each plot being for the thirty minutes preceding and following. Thesteady increase of the Leonid rate to a maximum is very noticeable on both nights. This maximum rate occurred about 4.25 a.m. on Nov. 15 and at4.15 a.m. on Nov. 16. In the 1932 observations at Harvard the maximum rate on Nov. 16 was at 3.55 a.m. The corresponding local mean times are4.08, 3.58, and 4.09 respectively, showing very good agreement. The Non-Leonids were surprisingly numerous in 1933, many seeming to comefrom radiants to the west of the Leonid radiant. Their varying hourly rate throughout the night is in marked contrast to the behaviour of the Leonids.The six brightest meteors on the morning of Nov. 17 were all Non-Leonids with an average magnitude brighter than –1. Two daylight meteors wereobserved on Nov. 15, shortly before sunrise, as the party was leaving the observatory. These meteors appeared within thirty seconds of each otherand were apparently Leonids, leaving trains that remained visible for several seconds.* * * * *by Peter. M. Millman,from Journal, Vol. 28, pp. 137–142, March, 1934.December/décembre 1998 JRASC281
Questions and AnswersQuestions et réponsesPredicting Sky Transparency andSeeing ConditionsIs there any relationship between weather patterns and goodobserving conditions?Here are a few general rules for picking a promising observingnight:The best transparency (clean, unpolluted air) normally occurswhen the sky first clears behind a strong cold front. That isbecause the source region of the air mass behind the cold frontis normally an area of higher latitude to the northwest (whichis essentially an uninhabited area in most parts of Canada).Such a night, however, is apt to be restricted to low-powerviewing because, while the transparency is excellent, the seeing(image steadiness) is poor as a result of all of the turbulencealoft caused by the strong winds and wind shear associatedwith active weather systems.If a large high-pressure area builds in behind the coldfront, the seeing will probably improve night after night, as thewinds become lighter both at the surface and aloft. The downsideof that, of course, is that as the seeing improves the transparencywill probably deteriorate as your local pollution sources causeincreasing concentrations of pollutants in the now stagnantair.I find that the best overall observing conditions arefrequently the second night after the cold front passes through.The air is still clean enough to offer transparency that rangesfrom very good to excellent, and the seeing may, by then, haveimproved as the wind shear aloft decreases.The very best seeing occurs just as the upper ridgelinepasses overhead. For a few hours the winds may be light all theway from the surface to the stratosphere and your telescope’sresolution may indeed be “diffraction-limited” for once! Thatis the rare night on which you can use high power to split veryclose double stars and see incredible planetary detail, thingslike details in Jupiter’s Great Red Spot; not only Cassini’s Divisionin Saturn’s rings but perhaps even Encke’s Division.As an upper ridge passed on October 12 th , 1983, I sawSirius’s white dwarf companion through my Meade 20-cmNewtonian at 34 using a polarizing filter in bright morningtwilight. (They were 9˝ apart in 1983, but are separated by only3˝.5 now.) Another upper ridge allowed me to split GammaAndromedae BC at 0˝.43 using 522 and a polarizing filterutilizing my Meade 40-cm Newtonian on October 29 th , 1995.[The well-known components of Gamma Andromedae aregolden (A) and blue (B), but I am talking about splitting B intoits two components, B and C.]If you have had a long, hot, dry spell and the forecast isfor a change beginning tomorrow (either increasing highcloudiness or a forecast cold frontal passage), observe tonightbecause the upper ridge line is forecast to pass through shortlyand image steadiness (seeing) could be the stuff of legends. (Iuse the term “could be” because in meteorology there are alwaysqualifiers that cannot be discussed without going into a textbooklengthreply!)As soon as the upper ridge passes, you will probably getthin, high cirrus or cirrostratus cloud pushing in and yourseeing quality will plummet. Even if the winds aloft remainrelatively light for a day or two, the ice crystals in cirrus andcirrostratus clouds destroy image quality. Conversely, you canview planets or the Moon quite happily through clouds formedof water droplets, like thin altocumulus clouds, thin stratocumulusclouds, or fog, if the winds aloft are light. These thin waterdropletclouds just act as a neutral density filter.Other things being equal, the best seeing in a high-pressurearea usually occurs towards dawn. That is because: (a) theradiational cooling of the ground has largely ceased so you arenot dealing with rising warm air as you were in the evening,and (b) the lower layers of the atmosphere become stratifiedas an inversion forms and the winds frequently are nearly calmfor several thousand feet above the surface. (If, however, amorning low-level jet forms just above the inversion, yourhoped-for fine seeing will not then materialize — there are nosure things, but there are very promising patterns that repeatover and over again.)Your immediate observing environment also improvestowards dawn for two reasons: (a) your telescope should be inthermal equilibrium with its surroundings after an all-nighter,and (b) most of your heat-producing fellow observers have gonehome to bed! The Prince George Observatory’s 0.6-m Cassegrainis in a dome with a classical slit. The heat from all the bodiesin the dome rises through the same slit through which you aretrying to view. I have never had a high-resolution view when282JRASC December/décembre 1998
more than one other observer was in the dome at the sametime. Worse yet, every time that someone enters the dome fromthe warm room, the surge of warm air through the open doorinstantaneously destroys the seeing until the door is closedand the warm air exits the dome.While I am at it, let me mention one of my pet peeves. Theword “seeing” is misused by far too many amateur astronomers,including experienced ones who should know better. Seeingrefers only to image steadiness and the potential for achievinghigh resolution. Seeing has nothing to do with sky clarity andcleanliness — that is transparency. The transparency will likelybe poor after the air in a high pressure area has stagnated overyou for a few days, but the seeing should improve night afternight, with the best seeing as the upper ridge passes, eventhough your limiting magnitude may be down to a murkymagnitude four by then.Alan Whitman (retired weatherman)Okanagan CentreThe Journal now accepts commercial advertising. By advertising within these pages you will reach the over 3000 membersof the RASC who are the most active and dedicated amateur and professional astronomers in Canada. It is also distributedby subscription to university libraries and professional observatories around the world.Black and White RatesSIZE One Insertion Three Insertions1/8 Page $125 $1151/4 Page $175 $1601/2 Page $250 $225Full Page $375 $340Inside Back Cover $500 $425Outside Back Cover $750 $550For information or to receive a copy of our advertising flyer contact:RASC Journal AdvertisingPO Box 31011, Halifax, NS, B3K 5T9Telephone: 902-420-5633Fax: 902-826-7957E-Mail: ads@rasc.caADVERTISE IN THE JOURNALDecember/décembre 1998 JRASC283
Feature ArticlesArticles de FondHow To Stay Warm at a Cold Eyepieceby Tony Wallace, Hamilton Amateur Astronomers(bravhart@interlynx.net)Winter is one of my favourite seasons. No, I am notderanged, but I have learned to harmonize ratherthan fight with the weather it brings. I have spentmany a weekend winter camping and enjoyed it thoroughly,day and night, even in temperatures of –35˚ C.That learning came at the cost of numbness, shivers, andgenerally living through my mistakes in the early boldness ofsuch ventures. Last winter I was able to confirm that the sametechniques that warmed me on the trail and in camp wouldkeep me cozy at the eyepiece of my telescope. Here, then, issome of what I now know about dressing for comfort as appliedto winter observing.“In order to be comfortablewe need to dress for atemperature about 10degrees lower than theair temperature”How warmly should I dress?Observing consists mostly of sitting or standing around asopposed to walking, chopping wood, etc. Add to that the effectsof radiating our heat into the inky night sky and you have arecipe for disappointment. The cure is simple. We need onlyto dress somewhat warmer than if we were outside doing somephysical activity. In order to be comfortable we need to dressfor a temperature about 10 degrees lower than the air temperature.That, by the way, is good advice for observing at any time ofthe year, but particularly so in winter.Know thine enemy!Rather than provide you with a list of solutions, I would like toexplain some of the processes at work that counteract effortsto keep warm and the basic remedies for them. Once youunderstand what is happening, you become able to recognizesymptoms and devise your own solutions to problems that mayarise while you are outside on a winter’s night.The major culprit in making us feel cold is our perspiration.We are all familiar with the perspiration of summer, but whatabout at other times? It may surprise you to know that weperspire continually, all year round, all day long. It seems ourskin is very partial to life in a tropical rain forest and tries tocreate the same humid conditions wherever it may be. In factour comfort demands such conditions. Skin loves moist airand sets about making the same environment by perspiringinto the adjacent atmosphere. The perspiration emerges fromour pores as water vapour. We are generally unaware of theprocess and only feel a change when it forms on the skin as afilm of water and then evaporates directly from the skin’s surface.In that case, the perspiration is being used for cooling ratherthan just avoiding dryness.The process of evaporation, you may recall from highschool physics, requires an additional amount of heat (latentheat of vaporization is the technical term) to bring a liquid toits gaseous state at the same temperature. It gets that heat fromthe skin’s surface, thus cooling us in the bargain. The problemis that we do not want to lose heat on cold winter nights, sowe put some clothing next to our skin to feel warmer. Well,perhaps…It depends on what that undergarment is made of. Themost popular fabric for underclothes is cotton. We like its softfeel, and it is both inexpensive and durable. The difficulty isthat it is just about the worst thing one can wear next to theskin on a cold night. You see, cotton likes water. That is, cottonabsorbs and retains water, which is why we use it in the besttowels. One reason it feels so nice is that it is much easier tohave a rain forest next to your skin when what you are wearingis sopping wet. So, getting back to our skin, cotton soaks upthe water and holds it like a jug. Then, in order to stay warmwe not only have to keep ourselves warm, but that wet garmentmust be kept warm, too. What we need is a fabric that abhorswater and would rather dump it out than retain it. Polypropyleneis the best known of such hydrophobic fabrics. It is a bit more284JRASC December/décembre 1998
expensive than cotton and you have to be careful to wash it incold water and hang it to dry (otherwise you will be lucky if itwill fit the cat after a good hot wash and dry). We refer to suchfabric as having the ability to wick the water away — and thatis just what happens. The perspiration is conducted away fromthe skin, often before it can even condense. Condensation, ifit occurs at all, takes place on the outside surface of the garmentundetected by our lily whites and we feel warm.The Layered LookWe have seen how important it is to choose the right kind ofundergarment fabric for staying warm in winter. The undergarment(winter lingerie, if you will) is part of a system of layers designedto maximize our heat retention and to stay cozy while at theeyepiece or some other activity. The garment ought to fit snugly.We will refer to it as Layer 1.Next comes Layer 2, the insulation layer (or the fluffies).Its purpose, as the name states,is to insulate us from the coldof night. Garments are betterif they fit loosely, not tightly.Appropriate fabrics arecharacteristically bulky,lightweight, and able to trapstill air in their tangled fibresor tiny air pockets — airmovement being a no-no forheat retention. Roughly speaking,they can be divided into twotypes, natural and synthetic. Each of them has pros and cons.The most popular natural fabrics are down and wool.Down is “nature’s own snuggly blanket” and the most efficientinsulator for our purposes. High-grade goose down is able toprovide more insulation value per unit weight and per unitvolume than any other material for such an application. It has,however, one serious drawback. If it ever gets damp, or, Godforbid, wet, you have big trouble! It takes days to dry out andits insulating value plummets to the point of making it uselessin that state. Down is definitely not hydrophobic. Rememberthe perspiration that passes through Layer 1? If it collects inLayer 2 (and it will) you are in for discomfort. Down is beautifulstuff and a great temptation, but I have come to avoid it inclothing for that very reason. Well, that, and the fact it is soexpensive that they want my firstborn for it.Wool, on the other hand, is relatively affordable and, whilenot having as high an insulation value as down, does a prettygood job in clothing. One can always make up for its lowerinsulation value by putting on two sweaters, right? I will saymore about that later.What about dampness? Wool has the wonderful qualityof retaining much of its insulation value even when it is wet.It is much more forgiving than down. Think of it as having builtininsurance. I like it. My skin does not. Many people, like myself,“Wool has the wonderfulquality of retaining muchof its insulation value evenwhen it is wet.”have skin that rebels against dressing up like sheep. We eitherput up with the itching, tickling, and general torture, or findsomething else.Enter the synthetics. There are now on the market severalgreat synthetic fabrics with excellent insulation qualities. Nameslike Hollofil, Quallofil, and Thinsulate come to mind. They areall hydrophobic and a good choice for Layer 2. My favourite,though, is Polartec by Malden Mills. The stuff is very lightweight,has a luxurious fluffy feel to it, does not pill (the technical termfor forming little balls of fabric on the surface after repeateduse, a.k.a. nubblies), and comes in an endless array of coloursand patterns. It is so hydrophobic that, if you get it completelysoaked, just squeeze out the water and it will hang dry in twentyminutes. It will even dry while you are wearing it. I had theprivilege of confirming that empirically on a fall canoe triponce, but that is another story.Okay, there you have it. Some Layer 2 facts and personalbiases. The last thing to remember about Layer 2 is that it isfar better to wear multiple thinlayers than a single thick one.The wisdom in that is as follows:if you are warm to the pointthat you are feeling perspiration,then you can (must) peel off alayer or two until your brainturns off the water tap. If not,you continue to push moisturethrough Layer 2 at a high rate.Even the best will have troublekeeping up with such a process,and that will leave you with a jacket full of water to keep warm.So, Layer 2 is simply as many thin layers of insulation as youwill need for the coldest temperature of the night in question.Layer 3 (the wrapper) is an outer shell with two importantfunctions. It must be able to keep the wind and rain from gettingto you, and, it must allow the moisture that has been travellingout through Layers 1 and 2 to escape from your skin. We donot do much observing in the rain, so that is not a concernhere, but keep it in mind for other outings when buying.Wind? If it is clear but windy, astronomers stay inside,not! Even the slightest of breezes will meander through Layers1 and 2 and kiss you with frozen lips. We need to keep that airmovement, however small, outside Layer 3. At the same time,Layer 3 must allow our inner moisture free access to the universe.Those two requirements may seem to be mutually exclusive ina single garment. They used to be, but not any more.There are now a number of high-tech synthetic fabricsthat can do just that. The best known of them is undoubtedlyGore-Tex. Gore-Tex is as waterproof as a rubber glove, yet willallow water vapour or air to pass through the micropores in itswaterproof barrier. If absolute waterproofing is not a big concernfor you, then consider a fabric known as Super Microft. It iswhat the manufacturer calls “water repellent.” My experiencewith it has been that it will keep you dry long enough to get toDecember/décembre 1998 JRASC285
shelter, if you run! I like it because it is an excellent wind barrier,lightweight, soft and comfortable, and, above all, is a goodbreather that will vent my own moisture to the world outside.Get clothes a size larger than you normally would, and theywill be perfect at the eyepiece or any other cold outing. Suchspecialty fabrics, and consequently the garments, are a bitpricey, but consider the following.I have two shells: one is Gore-Tex, the other is Super Microft.My last Gore-Tex jacket is ten years old and still going strong.(Actually, I grew out of it.) I do not own or need a raincoat,overcoat, leather coat, parka, snowmobile suit, fall or springjacket, K-way shell, or umbrella; I have avoided a lot of purchasesover the years. The two jackets mentioned above are functionallysuperior and look good as well, at least to those who know themagic they hold!Extremities in Extreme WeatherSo far we have discussed materials for covering our torso, arms,and legs, but what about our head, hands, and feet? They aregenerally subject to the same three-layer concept, but requiresome special attention. The hands and feet, and to a lesserextent the head, are indicators that warn us that we need toadjust our clothing. They are the first discomfort we feel whenwe are not quite dressed for the part.HeadThere is a lot of truth in the old adage: if your feet are cold, putyour hat on. I have read and heard various reports that theamount of heat lost from an uncovered head lies between 25%and 40%. Even conservative estimates indicate that is in the“Wow, that’s a lot!” category. It may seem at first that it is adetriment. To the contrary, it gives us a range of control overour body heat just through changing headgear. So, get out yourearmuffs, headbands, balaklavas, berets, babushkas, turbans,hoods, and what-have-you. They constitute your arsenal of finetuningweapons with which you can maintain a balance ofwarmth and ventilation for the rest of your body (includingthose cold feet).We must not forget about ventilation of the ever-presentperspiration making its journey from skin to the outside air.Be aware that bundling up your head may impede the processand result in condensation in Layer 2 of your headgear. I findit useful to think of the head and its garments as a sort ofchimney conducting heat and moisture in an upward direction.My various combinations of headgear then become a damperthat regulates the chimney action. Too little, and you lose a lotof heat; too much and you retain heat but your head ends upwet (like when the fireplace damper is closed too far and smokefills the room).I tend to dispense with Layer 3 on headgear when observingsince it allows better moisture flow and winds will be low orabsent at such times. Layer 2 is supplied by all manner of noncottonheadgear. I must admit to a personal neglect of Layer 1in cold weather observing because I do not like snug-fittingheadwear. Nevertheless, I do own a polypropylene balaklavawhich gets use in very cold and windy conditions. The key toheadgear is to have a number of options available and to varythem to suit conditions at the eyepiece.HandsYour hands, and in particular your fingers, will be required, ata minimum, to change eyepieces and make fine adjustmentsto your telescope throughout the observing session. At theother extreme, you may be continually thumbing through chartsand sketching the objects that you find. As a result, they arequite vulnerable to the icy wiles of Old Man Winter.The range of available handwear includes three- and fivefingeredgloves, slit-fingered gloves, fingerless gloves (a.k.a.urchin gloves, like the ones that Bob Cratchit wore in CharlesDickens’ A Christmas Carol), mitts, combination glove-mitts,and the ever-useless and hard-to-find muff. They are availablein a mind-boggling array of materials from polypropylene toneoprene; Polartec to what-the-heck. The easy way out of themaze is to apply our three-layer principle to handwear. Thebasic warmth requirements are met with a polypropylene innerglove, a Layer 2-type overglove that insulates, and an outer mittof Gore-Tex or some other breathable material. The last layeris a mitt since mitts are always warmer than gloves.There is, however, another important criterion affectingour choice, and that is the need to be able to make fine mechanicaladjustments. That can be as frustrating as picking fly droppingsout of pepper while wearing boxing gloves unless we makeallowances. That is where the particular style of hand-wearcomes in. Fingerless gloves are a boon in such situations. Theyactually have only the finger tips missing and so allow goodtactile sensation as well as keeping most of your hand warmat the same time. They are excellent choices for Layer 2 andshould be worn over a full-fingered Layer 1. Layer 3 can be quitea nuisance because it has to come off each time you have tofiddle with things. A good candidate for such an outer layer isa Gore-Tex mitt with a Velcro closure applied to a slit acrossthe palm. They are made for the express purpose of freeing yourfingertips for work without having to remove the mitt.My own experiences at the eyepiece have resulted in mychoices as follows. I wear full-fingered polypropylene innergloves. Over them I wear a pair of wool urchin gloves. The combohas me comfortable in most cases, however, I occasionally resortto my “cold killer combo.” I replace the inner gloves with a pairof fisherman’s neoprene slit-fingered gloves. Neoprene is thetype of closed-cell foam rubber used in wet suits. The fingertips(and thumb) are slit on the palm side at the first joint, allowingme to peel them back and expose my fingertips for fiddlingabout with filters and such. Bits of Velcro keeps the “flaps” outof my way until I am ready to cover up again. That provides mewith the ultimate in warm hand-wear and dexterity. “But it is286JRASC December/décembre 1998
not breathable!” you say. You are right, but read on a bit further.FeetFeet are unforgiving! Let us face it, the threat of cold feet isresponsible for many of us refusing to even go outside in winter.Feet are the first to complain when they get cold — and theydo it so-o-o-o well, don’t they? Well, we can look at it positivelytoo. The same attribute makes them the early warning sensorin detecting heat loss and signaling the need to adjust our garb.Do we need to put on our hat?The above assumes we are properly attired in the footdepartment. Starting with Layer 1, we would wear a pair ofpolypropylene, or other wicking, socks, and, over them, one ormore insulating Layer 2 types of socks. Our winter boots wouldsuffice for the windproof Layer 3, except that they are oftennot breathable at all, or are grossly inadequate for the task.That fact alone is the cause of nearly all cold feet at the winterobserving site. Extreme countermeasures may be called for.Recall the neoprene gloves? They are as impenetrable asrubber gloves, because, well, that is what they are. What theydo is prevent any moisture from leaving the surface of my skin.The skin on my hands perspires enough to create its beloved“rain forest,” and then stops, as long as I am not too active. Theinsulating Layer 2 has absolutely no way of getting damp fromthe inside, and we are not about to observe in the rain. Thelayer is known as a vapour barrier when used next to the skin.It is a technique used by avid campers in extremely coldconditions. They (I) go so far as to spend the night using avapour barrier sleeping bag liner to eke out a ten to fifteendegree advantage over life without one. The vapour barrier isa type of Layer 0. It can be used to advantage when you are notphysically very active. Get too active and you will drown in yourown perspiration!Getting back to our feet, it is the same secret weapon wewill deploy to guarantee that the familiar cozy feeling prevails.All we need is to don a couple of plastic bags as the first layerand cover them with Layer 2 socks. Do not laugh, but I findbread wrappers are great for this, the kind without holes in thebottom. The extra length makes all the difference. I first discoveredit while on a fall camping trip with the local motorcycle club.It was a cold and rainy return from wherever we had been andI was intrigued to see the more experienced among us snap upall of the bread wrappers left over from our food supplies andwear them inside their socks. One has to be a quick study in abike club. I found it made a big difference on the ride home.Are you too shy to try it? Nobody is going to see anyway.I have not yet needed to resort to that level of footwearwhile observing, but some people are different in their, let ussay, cold tolerance limits. My wife, for example, would packsnowmobile boots for a trip to hell and would still complainof cold feet. I suppose that is exactly what she will give me forwriting that — hell and cold feet!My personal solution to cold feet is a bit more conventional.“Let us face it, the threatof cold feet is responsiblefor many of us refusing toeven go outside in winter.”I start with polypropylene socks, then a layer of wool or syntheticsocks. I will include a second layer of them if I am to wear mysize twelve hunting boots. I take a size ten shoe, but the sizetwelve boot keeps the Layer 2 socks thick and fluffy! My preference,though, is to wear a pair of moon boots over the polypros anda single pair of wool socks. Moon boots are a wonderful inventionfashioned directly after Inuit mukluks. They are available atmany specialty outdoors stores. They consist of a mid-calflength upper of ripstop nylon that has been stuffed with Hollofilor some other synthetic insulation. That is attached to a thicksole of Evazote (the yellow spongy closed-cell foam that somesleeping pads are made of) that has been finished by coveringwith heavy Cordura material for durability. The ripstop nylonseems to form enough of a wind barrier and still allows moistureto escape freely. They are the best when the snow has no chanceof melting.Fuel for Extra HeatNow that we have learned how to dress ourselves, there is onemore area to cover. While we are observing we need to consumecopious amounts of hot drinks. They go a long way to make acold night a pleasure for all but the most obstinate curmudgeons.A word about alcohol — don’t use it. There is nothingwrong with a glass of wine or a “wee dram” of the aqua vitae.I would not refuse one. There is, however, a danger in downinga few of them. The ability to sense subtle changes in temperatureis easily impaired without one even noticing. By the time youbecome aware of the cold, the best thing to do is pack up andgo home because, in reality, you are probably well down theroad to hypothermia, from which some never return. Enoughsaid.The usual hot chocolate, Ovaltine, and herbal teas are finecompanions. Be aware that strong tea and coffee result in a netloss in the body’s water reserves. Take water along to drink aswell. Hot Dr. Pepper is great, as is hot fresh cider, mulled if youlike (skip the rum). Here is one of my favorite cold night recipes.I usually make two litres.December/décembre 1998 JRASC287
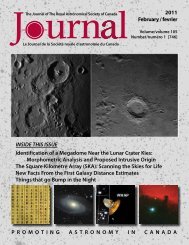
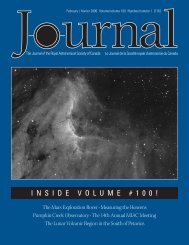
Pour 1 package raspberry Jello into a bowl.Add 1 litre hot water.Stir until dissolved.Add fruit punch drink crystals to taste.When it is okay to the taste, add some more.Stir and pour the lot into a thermos.Go to the observing site.Pour the lot into you and your friends.Do not let it go cold in your mug lest it become sloppy jello! Ohyes — be careful around the scopes. I just hate those stickyNaglers.–40˚ temperatures. Your scope will likely tell you when it hashad enough of that nonsense by creaking loudly or just refusingto move. If you should get cold and are not sure what to doabout it, just go for a walk. It is surprising how little you willhave to do to become warm. I would bet it takes less than ahundred metres to restore your comfort.Now then, no more excuses. I expect all of you to be oglingthe skies at observing sessions from December right throughMarch.Parting thoughtsThere you have it! Remember the three-layer formula and a fewtricks with the extremities and you will be a winter observerin comfort. Exercise an extra bit of common sense beforedeciding to venture out. That is, do not expect great results inTony Wallace’s interest in astronomy has recently come to includetelescope making. He can often be found suffering the rigours of the“Parabolic Willies” during yet another attempt to inflict his will uponsome obstinate piece of Pyrex.The Wilkinson Memorial Observatoryby R. A. Clark, Windsor Centre (rclark@wincom.net)The town of Eastend is in southwesternSaskatchewan, near the borders of Alberta andMontana. The population numbers seven hundredand fifty-two. It nestles in a wide coulee that was carvedby an ancestor of the Frenchman River. The stream windspeacefully southward through the prairie wheat lands.To the west, the Cypress Hills shelter the town from theinfamous prairie winds. These picturesque hills wereonce home to the mighty Tyrannosaurus Rex dinosaur,but are now a place where gentle white-faced cattle,mule deer, and antelope graze.Eastenders live in unique but quiet isolation. Thenearest large community is Swift Current, almost onehundred kilometres to the north. They are a communitymindedpeople. They have created resources that areunsurpassed by many larger towns. There are five churches,a high school, an arena, a curling rink, a nine-hole golfcourse, a 14-bed hospital, and a café where most of thecommunity’s business deals are consummated. Theyhave plans for a million dollar museum to display the completeskeleton of a Tyrannosaurus Rex that was recently discoveredin a nearby canyon wall — and on a hill, just south of town,they have an astronomical observatory that would be the envyof most educational institutions having an astronomy program.It is called the Wilkinson Memorial Observatory.In 1927 when a young blacksmith named Wilkinsonimmigrated to Canada, Eastend was already a bustling cowThe Wilkinson Memorial Observatory at Eastend, Saskatchewan.town. The ranchers and the wheat farmers needed someonewho was good with a forge and who could repair their specializedequipment. Jack Wilkinson’s smithy business boomed and soonhe had expanded into a machine shop, using his own handcraftedtools. Jack had a lively curiosity about almost everything. Hisneed to know and to discover extended to the stars that shoneso brightly from the clear skies of Saskatchewan. Mostly from288JRASC December/décembre 1998
mail-order sources, he began to assemble information aboutastronomy and optics.His first telescope was an ambitious 10-cm refractor, madefrom scrap tubing and welded in his own shop. Lenses wereground and polished with his own hands. Eyepieces wereconstructed as needed, from brass cylinders turned on his shoplathe. Next came a 15-cm reflector. The grinding of the mirrortook the Wilkinson family one whole winter. A testing jig wasdesigned and built to test the parabolic accuracy of the mirror.The town’s pharmacist supplied the coating for the mirror, andthe jeweler assisted with the application.In order to provide a rigid mounting for the telescope, theWilkinson machine shop truly came into its own. Many of thecomponents came from a World War II Anson training aircraftthat had crashed nearby. To track the stars according to theEarth’s rotation, an equatorial mount was designed andconstructed by the community blacksmith.A 20-cm telescope was next with a mount so heavy thatit sat at the back of the shop. When the stargazers of Eastendwanted a viewing session, they had to have enough strong mento roll the telescope onto the sidewalk with steel rollers. Fromthere they gathered to observe the craters of the Moon, therings of Saturn, star clusters, and nebulae. A whole new dimensionhad been opened for the citizens of this small agricultural town.A new and permanent site was needed. As with his previousefforts, Jack Wilkinson designed a circular building with arotating dome. By trial and error and with the help of manyfriends, the observatory was built on the roof of the high school.Jack Wilkinson died in 1953, but the interest that he hadawakened in the town lived on. A club was formed, withmembership shares that would pay for the care and theimprovement of the observatory. The structure was moved toa hill, on land donated by a local rancher. A Celestron C11 waspurchased, and the little town could boast that they had anobservatory with one of the largest telescopes in western Canada.They called their observatory the Wilkinson Memorial Observatory.Times have changed for small prairie towns. Many youngpeople have moved away and others have found new interests.The Wilkinson Observatory now sits alone, awaiting an eagerface to press against the eyepiece. Occasionally classroom toursarrive during daylight hours. The students are able to look forsunspots or to try reading the signs on the Shaunovon grainelevators, 30 kilometres away. Wade Selvig of Shaunovon andRichard Drockner of Maple Creek make the long drive asfrequently as possible. Jim Young of the Saskatoon Centre visitsto help with the maintenance and to give advice.My sister Beryl resides at Eastend, and so on a visit duringthe past summer I inquired at the town hall about a tour of theobservatory. In true western hospitality the reply came, “Yes,you may. We’ll send the key over and you may use it as long asyou wish.”It was Kendal McCuaig, the local Plumbing and Heatingcontractor, who brought the key. Generously he offered to driveto the observatory to ensure that all was in good working order.The road took us along the “Red Coat Trail,” the original routeof the Northwest Mounted Police when they were establishingforts for the protection of Canada’s southern border. It was onthe same trail that Commissioner Walsh rode out to meet ChiefSitting Bull. The Chief and his Sioux army had retreated intoCanada after the battle of the Little Big Horn. Walsh and a fewof his officers intended to remind the Chief that he was nowin Canada and must respect Canadian laws. The Chief agreedand he kept his word.Kendal and I entered the observatory, and I was amazedby the spacious installation. A well-maintained C11, restingon its steel mount, was anchored in concrete. Its electronicdrive is powered by solar panels. There is a fine assortment ofeyepieces and filters, a solar filter, and a modest but adequatelibrary of star charts and astronomy books. The dome movedeasily with a generous opening slide. Under the sparkling skiesof southern Saskatchewan and with no Moon, that night wasgoing to be a wonderful experience for me.My sister, her family, and some neighbours all expressedinterest in joining me for a star party. Alas, as evening came,clouds rolled in and the rain began to fall. It rained all thatnight, the next day, and the next night. The following day I hadto make a run for Regina to catch my flight home.The happy part of this story is that the area had beensuffering from a drought. The farmers and the ranchers werebeginning to have concern for their crops and their cattle. Therewas great rejoicing in Eastend as the life-giving rain fell on mystar party. As for me, I can only hope that the WilkinsonObservatory will be found by more of the curious with the samehunger for knowledge as that of the young blacksmith. Hisspirit lives in Eastend and on that lonely spot in the CypressHills.Rod Clark has been a member of the Windsor Centre for ten years.He became acquainted with the stars and constellations throughlessons in astral navigation taught by the Royal Canadian Air Forceduring World War II. He retired in 1989 from a career in radiobroadcasting, mostly with the CBC in technical operations, but withwriting opportunities. His interest in astronomy was rekindled bythe return of Halley’s Comet. (His father was fond of relating how hehad being awakened during the night by his grandfather to watchthe 1910 apparition of Halley’s Comet, but unfortunately did not liveto see it during its 1986 apparition.) Following retirement Roypurchased a Celestron C8 and joined the RASC. He has been writinga monthly column on astronomy for the Tecumseh Tribune for thepast seven years.December/décembre 1998 JRASC289
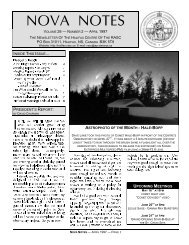
Starfest for the First Timeby Phil McCausland, London Centre (pjam@julian.uwo.ca)When I moved to Ontario last winter, one of my firstthoughts was that it would now be possible for meto go to Starfest, as I had wanted to do for severalyears. I hoped I would not be scheduled for geological fieldworkat the same time. As it happened, I returned from Manitobathe week just before Starfest, so was able to attend after all.With me were my girlfriend Rachel Jones and her parents Peterand Helen, who had made a timely visit from Nova Scotia. Wearrived at dusk on Thursday evening, after driving from Londonthrough brooding skies and occasional sprinkles. We wereanxious to set up the tent, and Rachel’s parents were anxiousto check into the B&B just outside the campground before theirroom was given away. Fortunately, it did not rain, and our tentwent up quickly.I knew very little about Starfest except for the fact that itwas an annual gathering of astronomy enthusiasts. Two yearsago St. John’s Centre member Garry Dymond came back fromhis first Starfest raving about the ’scopes, the people, and theatmosphere totally devoted to astronomy that pervaded theevent. He was right. I was immediately impressed, even on thatfirst cloudy night, by the friendly communal atmosphere atStarfest. You could talk to anyone present, all of whom werethere for a similar reason — to enjoy astronomy and the companyof their colleagues. The most obvious indicator of the amiableatmosphere was the widespread red lighting. While red lightingwas in evidence almost as if it was required by law, it turnedout to be a community response rather than the result of anonerous decree. Streetlights were not in evidence (hooray!) andthe permanent camp facilities were operating in all-red mode.Normally a building such as the two-storey Recreation Centreilluminated internally by red lights would look eerie and bloodchilling, much like Hallowe’en, but in the context of Starfest itwas downright cozy, an inviting centrepiece to the community.The campground as viewed from a distance, with some of the vendors’tents in the foreground.The “Red Light Cafe” as seen in the blazing Saturday afternoon sunlight.Nearly everyone present is in the shade. It was about then that PeterCeravolo flew overhead.Having a Red Light Café is a great idea. I think cafés are greatanyway, but this one was a lot of fun and was located in justthe right place. It was also open until 2 a.m. How did they knowmy normal waking hours so well? Rachel and I enjoyed discoveringit and other parts of the campground, wandering about underthe clouds until well after midnight.Friday morning arrived partly sunny and hot. During theday all four of us attended the beginner-level talks. Steve Dodson’s“Getting Started in Astronomy” was fairly comprehensive, andit was good to have the opportunity to try out assembled versionsof his build-it-and-the-stars-will-come Dobsonian kits. GlennLeDrew endured the heat of the upper level meeting room inthe Recreation Hall to present “Getting Started inAstrophotography.” It was already warm in the room when hedescribed some of the basic terms of astrophotography, andthen it was necessary for him (reluctantly) to shut all of theblackened sliding doors and to turn on the projector to illustratehis talk. It became seriously hot in that room! Rachel and Iducked out for a few minutes to appreciate the deliciouslycooler outdoor comfort of the 28˚ sunny afternoon. We returnedagain to the hot and humid interior of the room in time to catchthe rest of Glenn’s talk, as well as many good questions. I amjust developing an interest in astrophotography (no punintended!), and truly appreciated the opportunity to pick upso much basic information at one time. For instance, I neverknew that there were three colour layers in standard colourfilm, each with differing rates of diminishing sensitivity (whichis why Fuji slide film turns out dominantly green in astronomicalexposures). Something I regret not attending was the BarnDoor Tracker building bee, which followed shortly after Glenn’s290JRASC December/décembre 1998
talk in the much cooler outdoors Swap Table tent. Perhaps nextyear…Towards the end of the afternoon on Friday it began tocloud over, with a major thunderstorm cell visible to the north.Luckily that never hit us, but the clouds did, so the eveningobserving session was a patchwork affair at best. At times therewere many “sucker holes” to choose from. With 11 80 mountedbinoculars I was able to take advantage of the fleeting opportunitiesto spot Jupiter, M13 in Hercules, and the Andromeda Galaxy,and to sample parts of the prominent Milky Way driftingenticingly overhead in the Summer Triangle and running downthrough Sagittarius. Upon closer inspection, most of the clearpatches proved to host a milky haze of Earthly cloud that robbedour dark skies of contrast. When viewed through binoculars,Jupiter was accompanied by three of its four bright moons—two trailing and one preceding (Callisto, Ganymede and Io) —and an additional one (Europa) was visible telescopically justemerging from crossing in front of the gas giant. About fiftypeople came out for the Sky Tour, led enthusiastically by TonyWard. His 20-inch Dobsonian ’scope gave appealing views ofA view of the main tent with much of the campground lying beyond it.The grassy area in the foreground is the general gathering-place wherethe Sky Tour took place in the evening.M13 and the Jovian system, much to my babbling amazement(he said I was “saying all the right things” before I realized thatI was saying anything at all).It was as this session broke up under increasing cloudthat we were introduced to another feature of Starfest: Lightwars!Illegal white flashlights and strobes aimed into telescope focusingassemblies proved to be a handy tool for lighting up the cloudbottom — and each other. I felt inspired to poke my red pocketlight beam into one of the 1180 oculars, and was rewardedwith an ~80 mm red spot on the side of the Red Light Cafe,some 120 feet away! Marvellous! Even more gratifying was thediscovery that I could monitor the progress of my red beammore closely by looking through the other ocular… Hey, at leastI was legal!Saturday morning brought more sunshine (it had clearedoff at 3:30 in the morning) and a cooler day. We were up justin time for the solar eclipse. The solar eclipse wrap-up talk,that is, presented by five folks who took in last February’sCaribbean wonder from various locations: Terry Dickinson,Bob Sandness, Rob Dick, Randy Attwood, and Dave Petherick.Not only were there photos of the eclipse itself, but each speakeralso presented his personal eclipse experience. The panel laterfielded several questions from the eclipse-eager. A camcordervideo of the end of totality (Rob Dick) was my favourite; thesudden (so fast!) appearance of the diamond ring drew a deservedgasp from the audience. Book my flight to Europe!Prospects are not great for a shot at a 1998 Leonid meteorstorm in North America, as we learned from Wayne Hally inthe next talk. However, if you can find the cash for a trip to EastAsia (especially Manchuria or Mongolia) on November 17, youmay catch the estimated peak of the shower with its radianthigh overhead. In the meantime, those of us remaining on thiscontinent will likely get two nights (the 16 th and 17 th ) of elevated,but off-peak rates (I guess our counts can add definition to thesides of the meteor rate curve).It is fun to ramble around outside the tents at Starfest.We visited vendors’ tents to check out their astronomical wares.I got copies of Sky & Telescope and Astronomy at special Starfestrates, and enjoyed the rare luxury of browsing through astronomybooks in the warm sunshine. Between us Rachel and I pickedup four copies of the “Whizwheel,” a nifty planisphere-likenomographic device designed by Glenn LeDrew for easy dialupestimation of the photographic exposure times required forvarious astronomical objects, given the ƒ-stop and ISO filmspeed. Further afield there were purpose-built observatorytents, and many, many varieties of telescopes to investigate.An amazingly portable custom-made wooden 6-inch binoculartelescope was an excellent find (would that I had the money tobuy one!). The Swap Table tent was open and busy duringlunchtime. There were the usual assortment of observing andastrophotography accessories (binoculars, eyepieces, cameras),and also more organized items like “How to Build Your OwnObservatory,” a guidebook complete with building plans. I wascasually looking for a camera, but instead managed to buy anifty slide carousel from Dave McCarter for 25 cents (gee, Ihope it was his…).A series of maps mounted to accept pushpins was set upon tables outside the main tent. Upon closer inspection, thisodd attraction turned out to be a great idea: “Make Starfestlast all year,” a sign called to passers-by, “Share your knowledgeof dark sky sites with others!” Numbered blank index cards,pins, and cut ribbons were provided to pass on such usefulinformation to anyone who cared to browse the maps of Ontario,the eastern U.S., and Atlantic Canada for the numbered darksky sites. I filled out index cards for four locations in Newfoundland,and took down information for sites in Ontario, New England,and even one in the Florida Keys! As I did this, a high-wingaircraft buzzed and circled the River Place campground. It wasDecember/décembre 1998 JRASC291
the newly licensed Peter Ceravolo trying out his wings andgetting a few aerial snapshots of the Starfest gathering.Rachel, along with her parents and I, attended one moretalk in the afternoon, that by Ivan Semeniuk. He enthusiasticallylaunched into the early history of asteroid discovery, highlightingthe discovery of Ceres nearly 200 years ago, coming full circleto our own opportunity to personally discover Ceres in the fallas it passes through opposition in the Hyades — very close toits original discovery position. Emerging from the main tent,we were dismayed to find the western sky scudded withherringbone clouds in front of a higher icy whitewash. It wasnot a good sign for the evening observing session or for goodweather the next day. Sure enough, over suppertime the Sundisappeared prematurely, taking with it the last clear skies ofStarfest ’98. Final score: Clouds 2.5 nights, Stargazers 0.5 nights(not counting the two clear nights enjoyed by those who camein the days before Starfest).After supper Lief Robinson of Sky & Telescope gave a widerangingtalk on the opening horizons for amateur collaborationwith professional astronomers. He echoed the feeling I have(and I am sure the feelings of many in the hall) that we are inthe “golden age of amateur astronomy.” With widely availablequality equipment, personal computing power, and Internetcommunications, it is now more possible for the amateur toengage in useful, serious research. A particular strength foramateurs is their ability to dedicate extended observing timeto projects, unlike professional astronomers who are sorelysqueezed for observing time. Leif showed many examples ofuseful, exciting amateur astronomy, including sensitizedcamcorder videos of Perseid meteor fireballs (voices on tape inexcited Japanese), and the 4-second asteroidal occultation ofa 2 nd magnitude star. I found the last video even more breathtakingthan the solar eclipse video offered earlier in the day, probablybecause I have tried (and failed) many times to see and timean asteroid occultation. I felt (and feel) duly inspired!By then it was time for a reluctant last look around. Racheland I settled into the Red Light Café for an extended cozy stay.What better pastime is there for clouded out astronomers thancoffee, games and conversational company… and even theoccasional song?The view of the grassy area on Friday instead of Saturday. Joe O’Neil (inwhite shirt at left) is standing by his table of goodies, while fellow LondonCentre member Marc St. Clair (pony tail) is demonstrating his freshlybuilt,Dobsonian, binocular 20-cm telescope.As you might guess, my first Starfest was a lot of fun, eventhough we woke up to thundershowers and drizzly rain on theSunday getaway day. The hot breakfast available from the RedLight Café was especially welcome that morning! My thanksare extended to the folks at the River Place campground forproviding excellent facilities, and to the North York AstronomicalAssociation for organizing and running a wonderful gathering.Next year’s Starfest runs from July 15–19; I am hoping evennow that I will not be doing field work then…Phil McCausland is a planet-watcher and avid stargazer presentlyattached to the London Centre of the RASC, who also has close tiesto the Windsor and St. John’s Centres. In his alter-life he is workingon a Ph.D. in geophysics at the University of Western Ontario. Hehopes that his interests in geophysics and astronomy will soon dovetailtogether nicely.292JRASC December/décembre 1998
ReflectionsDark Morningsby David M. F. Chapman (dave.chapman@ns.sympatico.ca)By the time you receive this issue of the Journal, the dayswill have become very short and the Sun, being low inthe sky, will cast only feeble rays upon the ground (assumingyou are reading in Canada, not lounging in a wicker chair atsome sunny southern resort). For those who rise early to go towork or school, the mornings can be gloomy, even dark. Butreflect on this question: when is the darkest morning of 1999?To make it easier to answer, I’ll make it a multiple-choicequestion:1. December 22.2. January 2.3. October 30.4. None of the above.The most correct answer is number 2, and the subject of thismonth’s column is why I used the adjective “most.”The cycle of Earthly seasons owes its existence to the 23˚.4tilt of the Earth’s equator relative to the Earth’s orbital plane.That is common knowledge, although many otherwise welleducatedpeople remain confused about the origin of the seasons.The seasonal cycle is driven by the annual variation in solarheat delivered to the Earth’s surface at temperate latitudes. Innorthern-hemisphere summer, when the Earth’s North Poletilts towards the Sun, the days are long and the rays from thehigh-altitude Sun are tightly concentrated at the Earth’s surface.In winter, the North Pole tilts away from the Sun, the days areshort, and the rays from the low-altitude Sun are spread overa wider area. For anyone (like me) who habitually rises at thesame early time each morning for work (6:30 a.m.), the cycleof seasons is portrayed by the brightness of the sky: wintermornings are dark, summer mornings are bright, and equinoctialmornings are twilit.Imagine how dull life would be if the Earth’s axis were nottilted! The Sun would rise exactly east at the same time everyday, arc through the sky, and set exactly west twelve hours later.That would be true whatever the latitude, the only variancebeing the elevation of the Sun at noon. As one day would belike another, there would be no seasons. The Polar Regionswould be permanently frozen, the equatorial zone would beinsufferably hot (as now?), and one would have to search outa habitable intermediate latitude where the temperature wouldbe “just right.” (This is beginning to sound like Goldilocks andthe Three Bears!) Following the same train of thought further,consider how the polar tilt — through its influence on theweather — has shaped the history and culture of human lifeon our planet, and how things might have turned out differentlyif there were no tilt.But I digress: this column is about light and dark, not hotand cold, although the two are clearly intertwined. In the celestialsphere, the ecliptic is a great circle inclined at an angle of 23˚.4to the celestial equator. As the Sun moves along the eclipticthrough the year, its declination (angular distance north orsouth of the equator) cycles between +23˚.4 and –23˚.4. Bymanipulating the angular relations found on page 24 of theObserver’s Handbook 1999, anyone who is trigonometricallyadept can work out how the length of the day varies with theday of the year, and how the observer’s latitude influences theresult. (Alternatively, simply peruse the “Times of Sunrise andSunset” section of the Handbook, beginning on page 84.) In theequatorial zone, the latitude is low, and there is only a smallvariation in day length throughout the year. In temperate zonesat higher latitudes, there is significant annual variation in thelength of the day. At the high latitudes beyond the Arctic andAntarctic Circles, the length-of-day calculation can becomesingular, indicating that the Sun may never rise or never set oncertain days.Based on what has been presented so far, it seems obviousthat the latest sunrise (and hence the darkest morning) of anyyear would be the day of the winter solstice, which is December22 in 1999. (After all, it is the day of the year with the fewestdaylight hours.) Not so! The calculation of sunrise and sunsettimes is actually a bit more complicated than working out theday length from the angular relations and dividing it into twoequal parts before and after noon. A correction known as the“Equation of Time” must be applied to the nominal sunriseand sunset times symmetrically spaced about noon. Thecorrection is made up of two components. The largest componentresults from the Earth’s tilt and accounts for the fact that theSun moves steadily along the ecliptic, not the celestial equator;the correction amounts to as much as plus or minus 10 minutesand cycles back and forth twice during the year. The secondcomponent of the correction results from the eccentricity ofEarth’s orbit, and accounts for the fact that the Sun appears tomove faster along the ecliptic when the Earth-Sun distance issmaller (Kepler’s Second Law); the correction has an annualcycle of up to plus or minus 7.5 minutes. The two correctionsconsidered together form a fairly complicated correction formulaby which the Sun can lead the clock by as much as 16 minutesand lag behind the clock by as much as 14 minutes. Evidencefor that is found in the Ephemeris for the Sun in the Handbook(page 76). The time of the Sun’s transit of the meridian (i.e.when it is highest in the sky) is not 12 noon sharp, but variesthroughout the year.December/décembre 1998 JRASC293
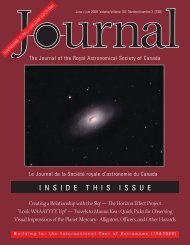
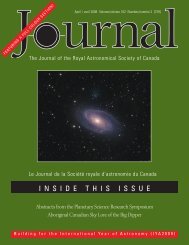
By some quirk of fate, around the time of the winter solstice,the equation of time is changing rapidly from “lead” to “lag.”For that reason the dates of earliest sunset, shortest day, andlatest sunrise, are not all the same. The precise dates aresomewhat latitude-dependent, but in mid-northern latitudes,the earliest sunset occurs in mid-December, about a week “early.”In many European countries, the day is traditionally celebratedon December 13, St. Lucy’s Day (Lucy = lux = light, get it?). Onthe other hand, the latest sunrise occurs around New Year’sday, about a week “late.” So the correct answer to the pop quiz,must be number 2, January 2… but not always!I must confess that the exception involves a bit of a trick,as one needs to invoke Daylight Saving Time. Between the firstSunday in April and the last Sunday in October, all Canadianprovinces except Saskatchewan advance the clock by one hourto brighten the evenings, which in turn darkens the mornings.As a result, it is possible that sunrise on the Saturday beforethe last Sunday in October can be later than sunrise on themornings of early January! Whether or not that is preciselytrue, it can be about as dark on late-October mornings as onmornings in the depths of winter. The amount of daylight israpidly shrinking in October, so the morning darkness invadesquickly, then vanishes as the clock is put back in its rightfulplace on the last Sunday of the month. For about a week, I cango out for my morning paper and see the constellation Orion,already past the meridian and sinking in the southwest. Forsome, the appearance of Orion in the morning just before sunriseis a herald of approaching winter.I have attempted to capture the effect in the accompanyingfigure, which represents the darkness of the nighttime skybetween sunset and sunrise at a latitude of 45˚ N throughout1999, including the sudden steps at the beginning and end datesof Daylight Saving Time. The chart is calculated for an observer’sstandard meridian (exact multiples of 15 degrees east or westof Greenwich), but is easily corrected for longitude within atime zone according to the instructions on page 84 of theHandbook. The lightest part of the figure represents full daylight,before sunset and after sunrise. The darkest part of the figuredenotes complete darkness, i.e. the time between the end ofTimes of daytime, twilight, and nighttime throughout 1999 for an observerat latitude 45˚ N on a standard meridian of longitude.astronomical twilight in the evening and the start of astronomicaltwilight in the morning. The various shades of gray in betweendenote different degrees of twilight in evening and in themorning. The pinched effect in midsummer is very latitudedependent,the length of night becoming shorter as one movesnorth. As Roy Bishop points out in the Handbook article“Midnight Twilight & Midnight Sun” (new to the 1999 edition),astronomically speaking there is no “night” in midsummernorth of the 49 th parallel, and much of Canada becomes the“Land of the Midnight Twilight,” along with all of the BritishIsles, Scandinavia, and most of Russia.The figure clearly shows that the date of earliest sunsetprecedes the date of latest sunrise. To see the variation inmorning darkness throughout the year, lay a ruler across thediagram at the appropriate time of day and read the graylevel. In the upper right hand corner of the figure, one cansee that the mornings at the end of October are about as darkas those near the end of the year, at the latitude 45° N. Atlower latitudes (Florida, say), the annual variation in daylength is reduced; however, the switch to Daylight SavingTime actually makes the mornings of early Autumn darkerthan winter mornings!David Chapman is a Life Member of the RASC and a past Presidentof the Halifax Centre. In addition to writing “Reflections” for the lastten issues, he has written for SkyNews and the U.S. National PublicRadio program StarDate, mostly on historical and calendrical aspectsof astronomy. In his other life, he is Head of the Naval Sonar Sectionof the Defence Research Establishment Atlantic.294JRASC December/décembre 1998
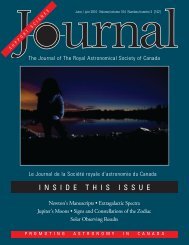
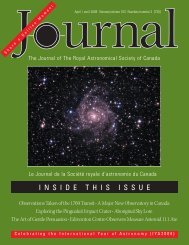
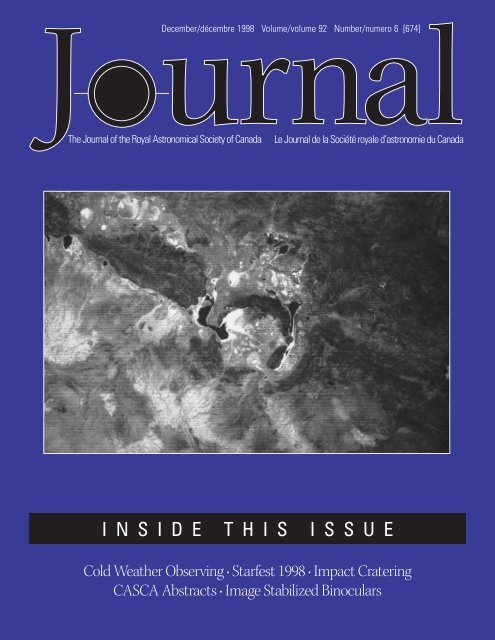
Second LightCounting Molecules in Galaxiesby Leslie J. Sage (l.sage@naturedc.com)Political pollsters and astronomershave a similar problem: bothgroups often have to makeinterpretations based on sparselysampled data. To illustrate why thismatters, say you ask a hundred peopleselected at random whether they supportfiscally conservative government policies.You will get a completely different resultif you conduct your poll at theintersection of King and Bay in Torontoor in an unemployment office in a smalltown. When one observes moleculargas in another galaxy, the mass oneinfers from the data could be in errorby a factor of ten or more because ofbiases in the way the gas is polled. Theresult is that, despite thousands ofpapers on the topic, just how muchmolecular gas there is in a normalgalaxy remains quite uncertain.Spiral galaxies generally containlots of gas; up to 10% of their mass could be in the form of gas,which is generally a mixture of atomic and molecular hydrogen(H i and H 2 , respectively), though the phases themselves areusually not well mixed. In most respects molecular gas is muchmore important because it is the “active” gas that makes newstars. The evolution of galaxies depends on the formation andevolution of stars, which are born exclusively (as far as we candetermine) in clouds of molecular hydrogen.Atomic hydrogen is quite easy to “see” — the atoms radiatephotons at radio wavelengths, particularly in the famous 21-cmline. With an instrument like the Very Large Array or the Arecibotelescope, it is easy to count the 21-cm photons and thereforecalculate how many hydrogen atoms there are in a galaxy, withonly a few assumptions. In essence one is counting the wholepopulation of atoms, rather than conducting a poll.Molecular hydrogen, however, is a lot more difficult tostudy because it can only be polled. By the laws of quantummechanics, hydrogen molecules can emit photons only underrather special conditions, which are not at all representativeof the bulk of the gas. Molecular hydrogen is therefore studiedby observing trace molecules, such as carbon monoxide (CO).Within our Galaxy, CO is thought to constitute about 1 part in10,000 relative to molecular hydrogen, which is not very much.The Andromeda Galaxy, M31 (Image by Peter Ceravolo).(It is still enough, though, that CO is generally considered tobe the second-most abundant molecule in the universe afterH 2 .) Even within the Milky Way, however, there has been a lotof argument about whether CO is 1 part in 5,000 or 1 part in20,000, and whether that factor varies according to the conditionsin the gas. Conditions in the gas in other galaxies are even moreuncertain. Despite that, many of the participants in the debatehold their positions with an almost religious fervour.The dispute surrounding how accurately CO traces moleculargas is now closer to being resolved, according to Michel Guélinand collaborators (see the 29 October issue of Nature). Theyfind that CO is a very accurate tracer of the total amount ofmolecular gas. Guélin and company have obtained detailedmaps of CO emission in the nearby Andromeda galaxy (M31),which they compare to optical images that show the absorptionof starlight. Within our Galaxy it is well known that the ratioof gas to dust is quite constant — if you have more gas, thenyou get more dust. The dust is responsible for the dark nebulae,such as the Horsehead Nebula in Orion — the dust associatedwith a dense molecular cloud absorbs the light of the stars onthe other side. When the gas is less dense, the light is reddenedand dimmed, just like sunlight at sunset. Yet much of it stillpasses through. One can therefore use the amount of obscurationDecember/décembre 1998 JRASC295
of starlight to trace the density of gas, under the assumptionof a common gas-to-dust ratio.M31 is a particularly important test case because it issufficiently nearby that it is possible to examine the correspondencein great detail. In more distant galaxies one is reduced to sayingthat there is a general consistency between the CO and the dust,but that is insufficient to settle the debate. Guélin et al. findan amazing degree of correlation between CO emission anddust obscuration, which shows that CO can be used as a tracerof H 2 . Such a result also serves to settle a separate debate aboutM31, and by implication other galaxies. Another group hasclaimed evidence for a huge reservoir of very cold moleculargas, which is not traced by CO emission. The idea is that thegas is so cold that the CO does not emit much radiation, justas cold objects emit less radiation than a warm stove, so therecould be a lot of gas that we simply cannot see directly. Guélinet al. see such a close correlation between CO emission anddust obscuration that there is no method for hiding the amountsof gas proposed, unless one declares that such a pool of gas,unlike any other observed, has almost no dust associated withit. That seems rather unphysical, and therefore unlikely.Will this finding really settle the debate about CO and itsrelationship to H 2 ? It does demonstrate that in another spiralgalaxy there is a linear correlation between the amount ofmolecular gas traced by CO and the amount of dust, althoughthere is still leeway to debate whether the absolute ratio is thesame as in the Milky Way. Since the fraction of “heavy” elements(anything heavier than helium to an astronomer) is roughlythe same across a broad range of spiral galaxies, and varies overthe inner regions of spiral galaxies by only a small factor, therelative abundance of both carbon and oxygen with respect tohydrogen ought to be comparatively stable. It does providesome confidence that the end of the debate is in sight. Insteadof arguing over a small technical point, we can use the CO datacollected to derive new insights into the nature and evolutionof galaxies.Dr. Leslie J. Sage is Assistant Editor, Physical Sciences, for NatureMagazine and a Research Associate in the Astronomy Departmentat the University of Maryland. He grew up in Burlington, Ontario,where even the bright lights of Toronto did not dim his enthusiasmfor astronomy. Currently he studies molecular gas and star formationin galaxies, particularly interacting ones.296JRASC December/décembre 1998
Research PapersArticles de rechercheIMPACT CRATERING THROUGH GEOLOGIC TIME 1by Eugene M. ShoemakerLowell Observatory and U.S. Geological Survey, Flagstaff, Arizona(Received July 20, 1998)Abstract. New data on lunar craters and recent discoveries about craters on Earth permit a reassessment of the bombardment historyof Earth over the last 3.2 billion years. The combined lunar and terrestrial crater records suggest that the long-term average rate ofproduction of craters larger than 20 km in diameter has increased, perhaps by as much as 60%, in the last 100 to 200 million years.Production of craters larger than 70 km in diameter may have increased, in the same time interval, by a factor of five or more over theaverage for the preceding three billion years. A large increase in the flux of long-period comets appears to be the most likely explanationfor such a long-term increase in the cratering rate. Two large craters, in particular, appear to be associated with a comet shower thatoccurred about 35.5 million years ago. The infall of cosmic dust, as traced by 3 He in deep sea sediments, and the ages of large craters,impact glass horizons, and other stratigraphic markers of large impacts seem to be approximately correlated with the estimated timesof passage of the Sun through the galactic plane, at least for the last 65 million years. Those are predicted times for an increased near-Earth flux of comets from the Oort Cloud induced by the combined effects of galactic tidal perturbations and encounters of the Sunwith passing stars. Long-term changes in the average comet flux may be related to changes in the amplitude of the z-motion of the Sunperpendicular to the galactic plane or to stripping of the outer Oort cloud by encounters with large passing stars, followed by restorationfrom the inner Oort cloud reservoir.Résumé. De nouvelles données sur les cratères lunaires, ainsi que de récentes découvertes au sujet des cratères sur la Terre, ont permisune réévaluation de l’historique du bombardement de la Terre durant les dernières quelques 3,2 milliards d’années. L’ensemble desrapports sur les cratères lunaires et terrestres indique que la moyenne à long terme de la production de cratères dépassant les 20 kms endiamètre a augmentée, peut-être près de 60%, durant les dernières 100 à 200 millions d’années. Il paraît aussi que la production de cratèresdépassant les 70 kms en diamètre aurait augmentée durant la même période, et selon un facteur de 5 fois au-delâ de la moyenne des 3milliards d’années précédentes. Une grande augmentation du flux de comètes à longue période semble être l’explication la plus raisonnablepour une telle augmentation à long terme du taux de bombardement. En particulier, deux cratères paraissent être associées à une pluiede comètes qui aurait eu lieu il y a environ 35,5 millions d’années. La tombée de la poussière cosmique, tel que l’indiquent les traces de3 He dans les sédiments océaniques profonds, l’âge des grandes cratères, les couches de globules de verre résultant des impacts et d’autresjalons stratigraphiques des grands impacts semblent indiquer une correlation avec les périodes de passage du Soleil à travers le plangalactique, au moins durant les dernières 65 millions d’années. Ces périodes prévoient une augmentation du flux de comètes s’approchantde la Terre à partir de l’amas d’Oort, le résultat des effets combinés des perturbations de la marée galactique et des rencontres avecd’autres étoiles qui croisent le Soleil. Les changements à long terme dans la moyenne du flux des comètes pourraient être liés auxchangements dans l’amplitude de la motion z du Soleil perpendiculaire au plan galactique ou au dépouillement de l’extérieur de l’amasd’Oort par de grandes étoiles qui croisent le Soleil, suivi d’une restauration depuis le réservoir intérieur de l’amas.SEM1. IntroductionPresented here are some ideas about the Earth’s history, or morespecifically the impact history of the Earth, as thought to be knownat the present time. It is recognized that there was an early period inthe history of the inner solar system of at least one episode, andperhaps several episodes, of heavy bombardment that produced mostof the craters on the Moon. The episode of bombardment, or at leastone part of it, may have peaked about 3.85 or 3.9 billion years ago,before decaying away. From about 3.2 billion years ago to the presentthe bombardment has been at a very much lower rate. The lunarhighlands are densely covered with craters, essentially as many cratersas there can be, and they are considered to be very old. For any suchsurface new impacts will obliterate craters left by older ones, so it issaid to represent an equilibrium population. Younger surfaces onthe Moon are represented by the maria, not all of the same age, twoof the younger ones being Oceanis Procelarium and Mare Imbrium.Some of the lava plains are very well dated from the return samplesof the Apollo program, the youngest maria being about 3.2 billionyears old. The present discussion is restricted to the 3.2 billion-yearperiod following the period of the last heavy bombardment.A point was reached recently in planetary research, perhapsten years ago, when the average rate of bombardment over the past3.2 billion years was known to within a factor of two. It is possible tocompare what happened on Earth with what happened on the Moonover that period of time, and one obtains essentially congruentanswers to within a factor of two. It is also possible to estimate thepopulation of near-Earth objects, and that yields a similar number1The 1997 Ruth J. Northcott Lecture, delivered at Queen’s University, Kingston, Ontario, June 30, 1997, during the RASC General Assembly.December/décembre 1998 Journal of the Royal Astronomical Society of Canada, 92:297–309, 1998 December 297
for what the bombardment rate should be at present.In this discussion I examine the problem via a less establishedapproach by addressing the variations that have probably occurredin the rate of bombardment. The usual assumption has been thatthe rate has remained reasonably constant for the last 3.2 billionyears; basically that is an assumption made in ignorance. A pointhas now been reached, however, where we have enough informationto begin looking at possible variations over geologic time. Since suchan approach deals with numerical estimates that are not always wellestablished, the presentation attempts to indicate what the uncertaintiesare at each step. They will become evident for those steps where thestatistical base of the results is rather small.2. Lunar CrateringOne of the advances that has been made on the problem has comefrom a small spacecraft, a “faster, better, cheaper” spacecraft, calledClementine, sent to the Moon in early 1994. The mission was deliberatelyplanned — literally on the back of an envelope during an airplaneflight — to image the Moon at high Sun angle, as high as possiblefor the low-lying regions, over the course of two months. Reflectedlunar light was observed through a selection of narrow band filterscentred on wavelengths covering spectral regions in the visible andnear infrared, from which it was possible to identify the major rocktypes on the lunar surface, i.e. the mineralogy of the lunar surface.There was no intent to study the morphology of the lunar surface,although that was done at the poles. A byproduct of the endeavourwas an excellent map from which one could obtain the albedo of theMoon, essentially very close to full face. That enabled us to examinethe far side of the Moon systematically for the first time.A mosaic of the far side of the Moon was produced by computerfrom several thousand individual images obtained by Clementine. Itwas found that there is a pattern to the rayed craters there. Largeones are readily identified from the background elements; actually,rayed craters as small as 10 km in diameter can be identified confidentlyfrom the images. McEwen et al. (1997) subsequently revisited theproblem of the spatial density of rayed craters on the Moon. Thestudy was restricted to an examination of the very uniform rock typecovered by the lunar highlands on the far side, and resulted in there-calibration of the crater density for rayed craters.A stratigraphic classification for craters on the Moon wasproposed about 35 years ago (Shoemaker & Hackman 1962). In thatscheme the younger systems of craters are divided broadly into twogroups: the oldest craters, designated Eratosthenian, date back 3.2billion years and forward to the boundary of the Copernican era; theyounger Copernican system extends from that boundary to thepresent time. Determining the age of the boundary has been one ofthe problems. There are some indicative samples, particularly fromthe Apollo 12 mission that landed on a ray of Copernicus, which, asbest can be determined, is the lowest-lying stratigraphically. Copernicusis the oldest rayed crater on the basis of rays superposed on thehighlands. However, there are other rayed craters that can be sampleddirectly to determine their ages, and sometimes one finds rays thatstretch out across the dark maria surfaces from much older craters.To explain the discrepancy, it was proposed that rays on bright surfaces,like the highland surfaces, fade at a standard rate and disappear intothe background at a given point in time. That point is what we defineFig. 1 — Lunar cratering rates scaled to model terrestrial distributions(McEwen et al. 1997).as the boundary of the Copernican system.McEwen et al. (1997) used the Clementine observations to countthe rayed craters on both the near side and the far side of the Moon,in the process re-examining all of the large rayed craters. The studyprovided a firm estimate for the density of such craters on the lunarsurface, in addition to knowledge about the density of the remainingpost-maria craters (post 3.2 billion year old craters), which are ofEratosthenian age. Figure 1 depicts the calculated density of combinedCopernican and Eratosthenian era craters (top slope), as well as thedensity of Copernican era craters alone (bottom slope) extrapolatedto Earth, i.e. with the crater sizes scaled to sizes that would be expectedfor impacts on the Earth rather than on the Moon. What is shownis the cumulative number of craters, starting with the largest, whichis a little over a 100 km in diameter. The values are plotted on alogarithmic scale where the values refer to the cumulative numberof craters per square kilometre. (If the values are multiplied by amillion, one obtains the number of craters per million square kilometres.)By the time one considers 10-km diameter craters on the Copernicanerasurface, the number density has increased by a factor of aboutthree hundred.In figure 1 the upper curve indicates what one obtains for thecombined Copernican and Eratosthenian era crater density, asextrapolated to Earth. By subtracting the density of Copernican eracraters, one can examine the density of Eratosthenian era cratersalone, in which case one obtains an average cratering rate both forthe Eratosthenian era and the Copernican era. It is apparent fromthe data that the distribution falls off steeply — on both faces of theMoon — as one considers larger and larger craters, in particular those70 km or 80 km in diameter and up to something approaching 100km in diameter. That is true whether one considers all craters youngerthan 3.2 billion years in age or just the youngest, the Copernican eracraters.The largest crater formed on the Moon in the last 3.2 billionyears is only slightly larger than the giant Chicxulub crater at thenorthern tip of the Yucatan peninsula, which has a diameter of 170298 JRASCDecember/décembre 1998
Table IEstimated Crater Production Rates for Earth 1Data Set Time Period Production of Craters WithD ≥ 20 km (10 –15 km –2 yr –1 )Eratosthenian Craters 0.8–3.2 Ga 3.7 ±0.4 (asteroidal velocities)3.0 ±0.3 (50:50 asteroids:comets)Copernican and ≤ 3.2 Ga 4.1 ±0.2 (asteroidal velocities)Eratosthenian Craters3.3 ±0.1 (50:50 asteroids:comets)Proterozoic Impact 0.542.6 Ga 3.8 ±1.9Structures in AustraliaFar Side Rayed Craters ≤ 0.8 ±0.2 Ga 5.3 ±1.8 (asteroidal velocities)(this study)4.3 ±1.4 (50:50 asteroids:comets)U.S. Mississippi Lowland ≤ 0.5 Ga 6.3 ±3.2Young Craters on North ≤ 0.12 Ga 5.6 ±2.8American & European CratonsAstronomical Surveys Present 5.9 ±3.51From McEwen et al. (1997). Rates are given accompanied by an uncertaintycorresponding to one standard deviation.km according to Hildebrand et al. (1991). The area of the Earth is alittle over thirteen times the surface area of the Moon. Since almostnothing is known about craters on the ocean floor, one is left toexamine craters on the land surface, which is slightly more than fourtimes the area of the Moon. On the basis of the lunar impact craterdensity studied by McEwen et al. (1997), the Chicxulub crater is thelargest crater produced in the past 3.2 billion years, which meansthat, within the uncertainties of small number statistics, one craterwith the dimensions of Chicxulub is produced on a time scale ofslightly less a billion years on average. The Chicxulub crater is only65 million years old, however, which is a difference that is verymeaningful. When the statistics are examined in detail in order toobtain the average rate for forming 170-km diameter craters on Earth,it turns out that there is about an 11% chance that a crater the sizeof Chicxulub would have formed in the last 65 million years. That issignificant, but it is not the only statistic.Table I presents estimates of crater production rates on Earthfor various samples of craters. The statistics for crater densities andmean cratering rates are credible at least for craters down to 20 kmin diameter. For Eratosthenian-era craters created from about 3.2billion years ago to eight hundred million years ago — our bestestimate for the boundary between the Eratosthenian and Copernicaneras — the predicted cratering rate on Earth is (3.7 ±0.4) 10 –15km –2 yr –1 for craters larger than 20 km in diameter. The units mayseem a bit bizarre, but represent simply the number of craters of thatdiameter created on a surface area of a million square kilometresevery billion years. With the combined results for Eratosthenian-eraand Copernican-era craters, the predicted cratering rate on Earth isslightly higher, (4.1 ±0.2) 10 –15 km –2 yr –1 . Based on lunar far siderayed craters or Copernican-era craters alone, the predicted crateringrate increases to (5.3 ±1.8) 10 –15 km –2 yr –1 , with a much largeruncertainty. There is a suggestion of a difference in the two crateringrates since 5.3 is larger than 3.7, but, since the difference of 1.6 fallsjust within the cited uncertainties, it may be merely a counting error.Yet there is still a hint that the cratering rate may have changed.In order to convert cratering rates obtained for the Moon toequivalent ones for the Earth, it is necessary to factor in the velocitiesof the impacting objects. The top set of numbers in Table I werecalculated under the assumption that the impacting objects strikeat the typical asteroidal velocities observed for Earth-crossing asteroids.If the mix contains equal numbers of asteroids and comets, thecratering rates — indicated on the second line — are slightly smaller,but in either case the predicted rates increase when one examinesthe far side rayed craters (McEwen et al. 1997). That is the situationinferred from lunar craters.3. The Australian Cratering RecordLet us now consider the Earth itself by examining the cratering ratein Australia. The importance of Australia lies in the fact that it is oneof the most stable pieces of continental crust on Earth; it has a recordof impact that goes back into Precambrian time, more than 540million years ago. In 1995 there were exactly six recognized impactcraters in Australia of which we were certain: Teague Ring, Spider,Strangways, Kelly West, Lawn Hill, and Acraman. They are all cratersthat I studied with my wife Carolyn, except for Acraman, which hasFig. 2 — Landsat image of the Shoemaker Impact structure (Shoemaker& Shoemaker 1996).been studied by George Williams. Carolyn and I have also examinedthat crater a number of times, however.Figure 2 is an image of the Teague Ring structure 2 taken fromthe Landsat satellite. The Archaean terrain, which is older than 2.5billion years, consists mostly of granites. The dark ridge is called theFrere Range; it appears dark because of the iron formation in thesequence of beds that make lots of black rocks on its surface. Thebeds dip off or flank off to the northeast into the edge of the Nabberu2 The Teague Ring structure was renamed by the Geological Survey of Western Australia in 1998 to honour the author of this paper. It is now formally called“The Shoemaker Impact Structure.”December/décembre 1998 JRASC299
Basin, and are tilted about 10˚ or so to the northeast. The wholesequence is interrupted by a structure that can easily be seen fromspace. It is 30 km in diameter and the rocks are dropped down inpart of a ray-shaped depression; because they are buried under stillhigher strata, they do not appear dark in the illustration. The wholesequence is then turned on end in an inner collar of the structurewhich surrounds an uplift of Archaean rocks. The structure that wesee is therefore a ringed structural depression with a central uplift.That is the typical structural signature of a deeply eroded complexcrater; the crater itself has long since disappeared. The feature isabout 1.6 billion years old, whereas the whole region was tilted andflanked off perhaps 1.2 billion years ago. The structure has been ator near the surface of the crust in Australia since then. It is the oldestimpact feature yet recognized in Australia. The very complicatedstructure of the feature must be deciphered by finding the outcropsFig.3 — Oblique aerial view of the low-impact Spider structure showingbeds near the centre skidded successively and stacked in ridges along thrustfaults (Shoemaker & Shoemaker 1996).of older rocks. They are turned up more or less on end and are coveredwith folds, much like the folds created when one pulls a napkinthrough a napkin ring. They are also bifurcated by many faults. Allof these are diagnostic structural features.Figure 3 illustrates another kind of structure that Carolyn andI mapped in detail — the Spider structure in the Kimberley districtof Western Australia. In the centre there are ridges of quartzite rocks,three units of which have been duplicated along faults and acrossthe centre. Visible in the image is the central uplift, and it is alsopossible to see why it is called Spider since it looks much like a twentyleggedspider. On a geological map of the whole structure the spideris in the middle and is surrounded by a complex structural depression.It appears in this case that there was a weak impact from the north,so that the beds near the centre were skidded successively and stackedup as plates as they repeated along a whole series of thrust faults.The central uplift punched up through those plates. This was a lowimpactstructure.Shatter cones can be detected in the field for each of the structuresshown here. Shatter cones are beautiful structures visible only inimpacted rock. Figure 4 illustrates one found on the Spider structure,where they are located on the central uplift. Shatter cones have conicalsurfaces, or portions of conical surfaces, that are decorated withfantail or horsetail kinds of striations formed by shock. They can becreated by shock on a small scale in laboratory experiments; theyFig. 4 — Large shatter cones on the central uplift of the Spider structureare conical features with horsetail striations formed in nature only as a resultof the shock pressures generated by extraterrestial impact (Shoemaker &Shoemaker 1996).can also be found in craters formed by explosives, so we have a goodidea of the range of shock pressures needed to form them. Shattercones are diagnostic features that, when found in the field, providedirect evidence that the rock has been shocked. They are abundantin the central 2 km of the Spider structure, which measures about11 km 13 km across.Another crater that Carolyn and I have studied is the Lawn Hillstructure in northwestern Queensland. It has a central uplift surroundedby a structural moat that is concealed by limestone breccias. It wasa target that was already structurally complex and folded with middleProterozoic rocks when the crater was formed, after which materialeroded away. The structure was next covered by seawater for sometime, during which limestone rocks were laid down. The limestonesare Cambrian rocks about 500 million years in age; even today LawnHill is recognized as a crater-formed feature. There is a centraldepressed region with ranges surrounding it. At present, Lawn Hillis basically an exhumed crater about 20 km across.One of the larger structures in Australia is Lake Acraman — asalina. It is located on the Eyre Peninsula in South Australia. GeorgeWilliams, who discovered it (Williams 1994a,b), has described it asa very large crater; he believes that the outlying ring structures foundthere might define the original crater. The beds in the surroundingranges are basically flat lying and undeformed, with no shatter cones;Fig. 5 — Density of noble metals (iridium, gold, platinum, palladium) andchromium, another iron-loving metal, reveal elevated abundances in theLake Acraman fallout layer (Wallace et al.1990).300JRASC December/décembre 1998
they appear to be fairly normal-looking rocks that have not beensubject to shock. The actual crater is a topographic basin about 40km in diameter. The reason why the lake is present is that the rocksin the centre, which were crushed and broken by shock, eroded toform the low spot presently visible in the topography. The age of thecrater is estimated quite accurately on the basis of stratigraphy. VictorGostin of the University of Adelaide discovered a fallout deposit fromthe crater in the steeply inclined rock beds in the Flinders Rangeabout 250 km from Acraman. Within the Range there is a bed ofmaterial a couple of centimetres thick that was ejected from theAcraman crater. It is part of a 10-km-thick sequence of late Proterozoicsediments, a very specific tracer in that huge stack of sedimentarydeposits. The rock is of Precambrian age, about six hundred millionyears old; it is the first distant fallout deposit discovered from arelatively large crater.Close examination of a fallout deposit reveals shocked rocksthat have small shatter cones within them. Also detected are featurescontaining tiny spherules of material that was once molten, quartzgrains that have structural features formed by shock, and contaminatingfragments of the impacting body. The abundance of the so-callednoble metals — iridium, gold, platinum, and palladium — and otheriron-loving elements like chromium is about ten thousand timeshigher in the average meteorite than in the average rock in the Earth’scrust. Elevated abundances of such elements are therefore a nicetracer of the impacting body. Samples obtained for the beds in theAcraman structure, for example, provide evidence for the presenceof a distinct fallout layer (figure 5), where there is an increase in theabundance of iridium to a peak of close to one and a half parts perbillion. That is a lot of iridium, given that the average amount foundin sediments in crustal rocks is about ten parts per trillion. The goldabundance is also anomalous, as is platinum, which is about two toTable IISizes and Ages of Australian Proterozoic Impact StructuresCrater Diameter Probable Age MethodAcraman ~35 km 600 Ma StratigraphicLawn Hill 20 km 500–1000 Ma StratigraphicStrangways ~40 km ~1000 Ma (?)39Ar/ 40 Ar DatingKelly West ~8 km 500–1600 Ma StratigraphicSpider 12 km 700–1600 Ma StratigraphicTeague Ring 30 km ~1600 Ma Rb/Sr DatingLiverpool 1.7 km < 1500 Ma StratigraphicGlikson ~18 km < 1000 Ma (?) Stratigraphicthree times as abundant as iridium in impacting objects. In fact,platinum is the most abundant of the elements brought to Earththrough impacts.Table II lists all Australian structures of Precambrian or Proterozoicage, where the Proterozoic represents the last part of the Precambrianera. One of the structures may belong to the Cambrian era, and thereare a couple of newly studied structures that are probably in the sametime range, although their ages are not known accurately and theyare smaller than the others. Small structures are lost by erosion andare therefore more difficult to find, so their numbers are usuallyunrepresentative of the entire sample. There are four structures thatare 20 km or larger indiameter: Acraman,Lawn Hill, Strangways,and Teague Ring. In acumulative frequencydistribution they producethe results presented infigure 6, which plots thelogarithm of thecumulative number asa function of thelogarithm of thediameters. Rememberthat the grand statisticfor craters greater thanor equal to 20 km indiameter is just fourstructures in Australia.The best fit for the lunardata is given by thedotted line. Thediameters of the fourFig. 6 — Cumulative size-frequency distributionof Proterozoic impact structures in Australia(Shoemaker & Shoemaker 1996).features are reasonably well established, but of course the uncertaintiesin the cumulative number densities are very large for such a smallsample. The cratering rate for Australia is established from an areaof a little over a million square kilometres covered by the gentlydeformed Proterozoic rocks, where one can actually search for craterson an exposed surface, and from an exposure age equivalent to theduration of the Proterozoic era — slightly less than a billion years.The combination implies an average cratering rate for Australia of(3.8 ±1.9) 10 –15 km –2 yr –1 , as given in Table I, compared with anestimated cratering rate for lunar craters of (3.7 ±0.4) 10 –15 km –2yr –1 for the Eratosthenian era. Normally one would not expect toobtain such good agreement to within the statistical uncertainties,but the result is nevertheless intriguing.4. Young CratersLet us now examine young craters on the Earth. Australia is the onlyplace where one can examine the cratering rate for early Earth history,but one can also examine a larger area of the Earth by consideringthe global distribution of craters. Figure 7 is a map from Grieve &Shoemaker (1994) that is revised annually as more craters are discovered.Figure 7 represents the status, as of 1994, of craters that Grieve iswilling to consider as true impact structures. There are severalinteresting features of the distribution. There are no craters in theocean, of course, and for the continents the distribution is very nonuniform.There is also a large cluster of craters in North America,another one in Europe, and a fairly large one in Australia. Why isthat? Since impacting objects strike the Earth fairly randomly, thehistory of such impacts should be recorded as a relatively uniformdistribution of craters. However, three factors contribute to theobserved non-uniformity: one is geological and two are sociological.The geological factor concerns portions of the continents, calledcratons, which are relatively stable against the forces of erosion. Forexample, the Canadian Shield is a portion of a larger stable regioncalled the North American craton, parts of which are very thinlyDecember/décembre 1998 JRASC301
Fig. 7 — Location of currently known terrestrial impact craters (Grieve &Shoemaker 1994).veneered with younger sedimentary rocks and Phanerozoic rocks.Another recognized craton is the European, sometimes called theEoeuropean, craton. Australia is also a very stable region of the Earth.Because of their stability, cratons represent regions of continentswhere one can expect the cratering record to be preserved.There are also sociological reasons contributing to the nonuniformityof our knowledge of impact craters on Earth. Parts of theEarth, for example, are better mapped geologically than other regions,owing to the presence of a large population of active geologists. Thatis the case for North America, Europe, and Australia, although evenhere North America and Europe are better mapped than Australia.A second sociological reason relates to the fact that Australia inrecent years has been the target of a particular husband and wifeteam that has been interested in examining terrestrial craters. Themapping of impact structures in Australia is therefore reasonablywell established owing to the activities of a few individuals. In suchfashion were discovered exposed craters larger than 20 km in diameterand which are very ancient — the Proterozoic craters of Australia.One can do the same type of analysis for young craters in NorthAmerica and Europe, where the statistics are much better. Figure 8illustrates the cumulative number distribution for craters that arefairly accurately dated, all of which are 20 km in diameter or largerand located on the North American and European cratons. It is aFig. 8 — Cumulative number of craters of D > 20 km for North Americanand European cratons. The two apparent distributions of younger and oldercraters suggest a record of erosion for craters older than 120 Ma (Grieve &Shoemaker 1994).standard logarithmic plot from which one gets the impression thatthe logarithmic cratering rate increases fairly linearly with age up toabout 120 million years ago, and then something happened thatcaused the rate to change. Or it may be that craters are starting todisappear as we go farther back in time. The opinion of Grieve, withwhich I concur, is that we have an incomplete sample of craters atleast over part of the period, so the record is incomplete. The sampleis probably complete for the last 120 million years.On that basis let us examine the cratering rate over the last 120million years. According to Table I, the cratering rate for young cratersis (5.6 ±2.8) 10 –15 km –2 yr –1 , with a rather large uncertainty. Thenumber is based upon eight craters, so the uncertainty probablyrepresents one sigma scatter or smaller, but Grieve is always conservativein his estimates. Although the rate is larger than that for Proterozoicimpact structures, it is very close to the rate of (5.3 ±1.8) 10 –15 km –2yr –1 derived for lunar far side rayed craters. It is encouraging thatboth numbers are so similar despite their large uncertainties. Anindependent estimate can also be obtained for just those craters inthe Mississippi Valley lowlands of North America, a part of the NorthAmerican craton where one can sample 10 km diameter cratersreliably (Shoemaker 1977). The equivalent cratering rate for 20 kmdiameter craters, with our standard slope, is given in Table I as (6.3±3.2) 10 –15 km –2 yr –1 . The Mississippi Valley craters constitute acompletely different set from the previous sets we have discussed,although again with a large uncertainty. The statistics for the MississippiLowlands and for young North American and European craters arerather interesting, however, and both, as well as the cratering rate forlunar far side rayed craters, are larger than the results for eitherEratosthenian-era craters or the combined Copernican-era andEratosthenian-era craters.Any one estimate considered by itself would not be convincing,but combined they suggest that the cratering rate for 20 km diametercraters has actually increased. But what is the situation for very largecraters? That is where the account becomes interesting. All craterslarger than 50 km in diameter, at least ones that I have determinedare larger than 50 km in diameter, are plotted in figure 7 by largesymbols. Let me enumerate them. First there is Chicxulub. Thenthere is one that was not even on the map three years ago, theChesapeake Bay Crater. One can argue about the true size of thatcrater, but I will demonstrate later why I believe it should be there.Both craters just mentioned are subsurface craters. Next is Manicouagan,which is a large crater in Québec. In Asia there are four, entirelycovered by younger beds, which lie in the former Soviet Union. Thelargest is Popigai, which is a 100 km-diameter crater. Then there isKara, which is a 65–70 km-diameter crater, and then Puchezh-Katunki,a buried crater. Finally there is the Kara-Kul crater in Tajikistan, whichmay be very young. Next in rank is a buried crater in Australia, theTookoonooka crater, and finally there is a crater that has just recentlybeen reported (Corner et al. 1997), the Morokweng crater in SouthAfrica.Table III summarizes what we know about the sizes and agesof the structures just identified. The age for Chicxulub, 170 km indiameter, is known very accurately to be 65 million years. The nextlargest craters are Popigai and Manicouagan. Popigai is only about35 1 ⁄2 million years old, while Manicouagan is nominally 214 millionyears in age. Another crater very close in age to Popigai according toPoag (1997) is Chesapeake Bay, 85 km in diameter. The craterMorokweng is so eroded that it is difficult to determine its size exactly.302JRASC December/décembre 1998
Table IIIThe Largest Impact Craters on Earth with Ages 220 MaCrater Diameter AgeChicxulub, Mexico 170 km 64.98 ±0.05 MaPopigai, Russia 100 km 35.7 ±0.8 MaManicouagan, Canada 100 km 214 ±1 MaChesapeake Bay, U.S.A. 85 km 35.5 ±0.5 MaPuchezh-Katunki, Russia 80 km 220 ±10 MaMorokweng, South Africa >70 km 146.2 ±1.5Kara, Russia 65 km 73 ±3 MaTookoonooka, Australia 55 km 128 ±5 MaKara-Kul, Tajikistan 52 km
production rate. Although it is a statistic based upon only one crater,it is nevertheless interesting. In fact, the crater count reproducedhere is based upon only craters that are recognized on the continents,and one must convert those numbers to ones applying to the entireEarth. It seems certain that the distribution tails off for large craterdiameters, although it is certainly incomplete. Actually, the Morokwengcrater is not included here, because its diameter is uncertain. If it isincluded, the points describing the observed cratering frequencieson Earth will all be larger. It is therefore at the large crater diameterend of the distribution that we can be truly confident that the fluxof impacting objects is high. It also remains higher than expectedeven when one considers craters that are an order of magnitudesmaller than Chicxulub, but then becomes progressively smaller.6. The Role of CometsFig. 11 — Probability of collision for Earth-crossing asteroids (Shoemakeret al. 1990).According to our best estimates of the distribution of such objects,the number of about a thousand objects brighter than 17.7 correspondsto roughly 1500 objects larger than a kilometre in diameter. With thefactor of 410 –9 yr –1 included, it means that we should expectapproximately six such objects to hit Earth every million years. Thatis a significant geological figure.From that number one can derive the mean cratering rate asa function of crater diameter, a step that involves knowledge of typicalasteroid densities, for which there is considerable evidence. Figure12 illustrates the results; it is a plot of the currently best-calculatedcratering curve for asteroids, and corresponds to the curve shownin figure 1. Recall that for craters on the Moon there was a steep, verysteep, decline in number densities for the largest craters, and thatapplies also to the cratering rates for large impactors. Plotted separatelyis the estimate given by Grieve (1984) for the production rate of 20-km-diameter or larger craters in the last 120 million years, and aprevious estimate(Shoemaker 1977) for theproduction rate of 10-kmdiameteror larger craters.Within the largeuncertainties of bothpoints, the line betweenthe two points is not verydifferent from the craterproduction relationexpected from collisionswith asteroids. But nowwhen one considers verylarge craters like Chicxulub(figure 12, a plot forcontinental craters), theexistence of such a largecrater on Earth cannot bereconciled with therelationship describingthe asteroidal craterFig. 12 — Crater production on Earth duringthe last 220 Ma, based only on craters recognizedon the continents and converted to apply tothe entire Earth.What is it that causes the difference for the largest craters? Cometsprovide one straightforward answer. A well-known periodic cometis Comet Halley; it has a geometric mean diameter of 9 km, not quitelarge enough to create a crater like Chicxulub, but close. Anothercomet that is almost exactly the same size as Comet Halley wasdiscovered by IRAS, the infrared astronomical satellite, as it passedby in 1983. It was also discovered from the ground by Araki in Japanand by George Alcock in Britain, who found it by using binocularslooking out his front window. The comet missed the Earth by a littleover 4 1 ⁄2 million kilometres. How often do comets come that closeto Earth? Occasionally they appear to come that close, but actuallydo not, such as Comet Lexell in 1770. Two hundred years before thatit made another somewhat closer pass. The orbital characteristicsof early comets are somewhat uncertain, but it also appears thatabout two hundred years before that there was another close pass ofa comet to Earth. Comet Halley itself came almost as close a littleover a thousand years ago. For two of the comets we know theirdimensions reasonably well, but for others such as Comet Lexell wecan only make rough guesses. The accumulated evidence suggeststhat something about the size of Comet IRAS-Araki-Alcock passeswithin 4 1 ⁄2 million kilometres of Earth at least once every two hundredyears. That is probably a lower bound; the true flux of comets maybe higher. Indeed, we know there are larger comets, while the largestEarth-crossing asteroid, Ivar, is only 9 km across. Yet there are multiplecomets that are in the same size range, almost certainly. The mostrecent example is Comet Hale-Bopp, which is an exceptionally largecomet about 40 km in diameter and which is also Earth-crossing.It only takes a little mental calculation from such small statisticsto consider how often objects of this type will hit the Earth. Imaginethat the Earth is the bull’s eye on a target 4 1 ⁄2 million kilometres acrossstruck once every two hundred years. The probability that an objectof cometary size will hit the bull’s eye amounts to about one strikeevery 100 million years. That is a lower bound, but it is much higherthan the impact rate for asteroids. I therefore suggest that cometsare primarily responsible for the high rate of crater production.If true, then there is something else that can be examined. Wemust ask if it is reasonable that comets formed the large craters. Itis difficult to prove, but the abundance of the siderophile elementsplatinum, iridium, and gold is suggestive, particularly in the case ofplatinum. The abundance of such elements is known for the mostprimitive meteorites, which can be used for comparison, or one can304JRASC December/décembre 1998
make a comparison with other, differentiated, more evolved meteorites.In each case where there is information, as for example with theChicxulub crater, the pattern of the siderophile elements in the falloutwas examined. There was probably a certain amount of shiftingaround of the elements once they were deposited, but the abundancepattern is clearly primitive. That is at least what one should find fora comet impact, but it does not prove that was the case. For theChicxulub crater the best one can say is that there is a 90% probabilitythat the impactor was a comet.In similar fashion, a primitive abundance pattern is found forthe siderophile elements examined in rocks at the Popigai crater.That is to say, the abundance pattern matches the standard ratio oftwo platinum atoms to one iridium atom found in the most primitivemeteorites, and the results for other element ratios are similar. Thereis an 80% probability that the Popigai crater was created by a cometimpact.In the case of the Manicouagan and Chesapeake Bay cratersthere are very weak siderophile signatures, which may also be asignature of comets; at least the results in both cases are consistentwith a comet impact. In fact, the fallout deposit of the ChesapeakeBay crater, which is found in the ocean along with a striking impactspherule horizon, does not exhibit the presence of any siderophileelements. There is an 80% probability that the Manicouagan craterwas formed by comet impact, while for the Chesapeake Bay craterthe probability is 70%. Very little can be said about the Puchezh-Katunki crater — there is just not much there — but the probabilityof comet impact is 65%. Those are the five largest impact sites, andthey show consistency.7. Galactic Tidal Forces and Passing StarsOne further test can be made. An interesting feature of the longperiodcomets, those coming from the Oort cloud, is that their deliveryto Earth is influenced by two factors: galactic tidal forces and encounterswith other massive objects, namely stars in the solar neighborhoodthat comets pass on their way to Earth. The motion of the Sun in theGalaxy, though not known perfectly, has been the subject of somestudy. Figure 13 illustrates a solution for the solar motion perpendicularto the galactic plane as obtained by Matese et al. (1995). Over thepast hundred million years the Sun’s orbit in the Galaxy has carriedit first towards and then away from the galactic centre; in other words,Fig. 13 — The motion of the Sun perpendicular to the galactic planeaccording to Matese et al. (1995). Illustrated here without encounters, theSun exhibits a smooth orbital path above and below the galactic plane witha motion periodicity of about 30–35 million years.Fig. 14 — Predicted comet flux from the Oort cloud according to Mateseet al. (1995), as affected by galactic tidal variations and the random passageof stars.its orbit is not perfectly circular. The graph illustrates a smooth orbitalpath, that is, one without any encounters, although the Sun doesencounter other objects about once every quarter million years as itgoes around the Galaxy. The Sun’s motion also carries it above andbelow the galactic plane, which is an important point. The actualdistance it moves away from the plane is not well determined; itsvelocity is known, but its motion perpendicular to the plane dependsupon the mass and density of stars near the galactic plane. The Sunappears to be close to the galactic plane now and moving above it,in other words, toward galactic north, but we do not know for certainhow far above the plane it will go. The best estimates suggest that itsexcursions may be about ±75 pc away from the plane, and the bestestimate for the periodicity of such motion is about 30 to 35 millionyears. Matese et al. (1995) addressed the question of how that affectsthe delivery of comets into the inner part of the solar system, andfigure 14 illustrates their results. It depicts their best estimate for thedensity, for which one gets somewhat different models. It shows thatthe flux of objects passing Jupiter, namely comets delivered directlyout of the Oort cloud, varies temporally by about a factor of four.Those that become Earth-crossers are depicted by the dotted line.Their calculations indicate that the perihelia of such comets, thevery long-period comets, are becoming smaller as a result of galactictidal variations.Another important factor was considered by Matese et al.(1995), namely that, as the perihelia of comets become smaller, passingstars become more effective at delivering comets into the inner solarsystem. The effect can be pictured as a synergistic interplay betweengalactic tidal variations and the more or less random passage of stars.Because the perihelia have become smaller for some of the comets,it means that it is easier to deliver still more comets by an impulsefrom a passing star. As a result, the true delivery rate of comets willprobably appear similar to that depicted in figure 14, except that itwill not be nearly as uniform. The relation will probably appear muchspikier and at a different angle.The important point is that the mean period between majorcomet perturbations into the inner solar system is on the order of30 to 35 million years. That is what one expects if the conjectures arecorrect. The significant point is that the Sun is very close to a planecrossing now. Some 30 to 35 million years in the future it should benear a plane crossing again, some 35 million years in the past it shouldhave been near a plane crossing, and so on. Is there any observableevidence for that? I suggest there is.December/décembre 1998 JRASC305
Fig. 15 — Impact indicators from 70 Ma to the present (iridium, shockedquartz, impact glass, craters) imply that the ages of very large craters maybe periodic.If one examines the ages of very large craters, it is my guess thatthey should be periodic. Figure 15 depicts the distribution of iridiumin a stratigraphic section. There are two event horizons at or nearthe present time, a couple of event horizons 35 million years ago(Ma), and of course there is a well-known one at 65 Ma. The presenceof shocked quartz in the section is found near the present time, thereare a couple of event horizons at 35 Ma, and there is also the wellknownone at 65 Ma. For impact glass spherules there are actuallythree known event horizons near the present time, a couple in between— our impact glass is not entirely spherules — and three quite wellspaced event horizons at about 35 Ma, 35.5 Ma, and 65 Ma. For largecraters, there is Chicxulub at 65 Ma, and Popigai and ChesapeakeBay at 35 Ma. I will argue later that there is one that we have notfound yet, namely an unrecognized large crater. It must have an ageclose to the present, at the left of the chart. The periodicity is aboutwhat one would expect at roughly 30 to 35 million years.One other feature worthy of examination is the nature of thecraters themselves. Figure 16 is a map of the geology of the ChesapeakeBay crater, the source of the glassy spherules — tektites — associatedwith the North American strewnfield. It has now been very thoroughlyexplored by seismiclines. In particular, thereare lots of drill holes,which are depicted bylittle circles on the map.One can actually detectthe ejecta surroundingthe crater; in some casesthere are tidal depositsas well. There is an innercrater and a very curiousFig. 16 — The geology of the Chesapeake Baycrater (Poag 1997), source of the North Americanstrewnfield of tektites.disturbed bench on theoutside, 85 km indiameter.In lieu of a map forthe Popigai crater, figure 17 presents a cross-sectional view as publishedby Masaitis (1994). The crater is filled with impact melts, sheet impactmelts. The heavy black rings represent some solid melts, in contrastto the breccias marking the rubbish heap of melted material andnon-melted material that we call suevite (numbered 2 on the chart).There is also a zone of breccia or broken rock (numbered 4 on thechart) on both flanks of the crater, separated by a distance of 100km. For the impact craters formed 35 Ma ago we have examined boththe usual impact indicators and the craters themselves. We also havethe same type of evidence at 65 Ma for the Chicxulub crater.Fig. 17 — A cross-sectional view of the Popigai crater (Masaitis 1994) revealsthe nature of the crater with impact melts and breccia.8. Infall of 3 HeOne other line of evidence that can be examined relates to a veryexciting result published by Farley (1995), who is an isotope geochemistat the California Institute of Technology. He approached the problemin a very interesting way when it was suggested by Don Andersonthat the 3 He emitted by the Earth from volcanoes in minute traceamounts was actually interplanetary 3 He brought to the Earth byinterplanetary dust particles which were cycled into the Earth byconvection. Farley and other geochemists believed that they coulddemonstrate that this was incorrect. After considering where hecould get a sample of deep-sea sediments to measure the content of3 He, he decided that the easiest place to get it was from a giant pistoncore taken from the north side of the Pacific Ocean. It has beenexamined fairly carefully, and covers 70 million years in 20 m of coreat a very slow sedimentation rate. Farley took just one specimen fromthe core sample and placed a 2-g sample into a mass spectrometer.He expected to find very little 3 He, but more 3 He was detected by themass spectrometer than had ever been seen in a core before.Farley next went back and obtained from Frank Kyte at UCLAall of the samples from the core, and measured the content of 3 He.An important feature about 3 He in ocean sediments is that normallythere is only one significant source. The background level on Earthis minimal, essentially zero. The primary source is cosmic dust particlesin the size range of a few microns up to tens of microns. At sizesbelow a few microns the dust is blown out of the solar system byradiation pressure from the Sun. Very large dust particles, on theFig. 18 — Implied 3 He flux from 70 Ma to the present (Farley 1997). Thelarge peak at the left represents present time and the other peak is at 35 Ma.Dust particles with solar wind-implanted 3 He provide a tracer of the infallof cosmic dust onto the Earth.306JRASC December/décembre 1998
other hand, get too hot when they come into the Earth’s atmosphere.Only for a narrow size range can particles pass through the atmospherewithout becoming too hot. Such particles bring in solar wind-implanted3 He. It is a marvelous tracer of the infall of cosmic dust onto the Earth,totally independent of anything else mentioned previously.Figure 18 depicts Farley’s results for the implied flux of 3 He(Farley 1997). The spike at the left edge covers the last 2 million years— about a million years for the very high points — and then falls offby a factor of six. There is another spike 35 million years ago, beforethe rate declines again. There is an interesting peak around 50 millionyears ago and it looks like there is another peak at the Cretaceous-Tertiary boundary, but to calculate the flux requires knowledge ofthe sedimentation rate. There could be artifacts in the peaks after35 Ma, but the peak at 35 Ma is unquestionably real.When Carolyn and I returned from Australia in 1995, I promptlycontacted Farley. We talked about his results and entered into a jointeffort. The problem is that the results were based upon just onesample. It was argued by Karl Turekian, Farley’s old professor at Yale,that the peaks in figure 18 simply reflected some strange pattern ofocean currents affecting the rate of sedimentation, and that theymay not represent the true flux of 3 He.Two features of figure 18 stand out distinctly: the large peak atthe left that represents the present time and the other large peak at35 Ma. We examined the stratotype section for that time period (thelate Eocene into the Oligocene ages). It is located in a small quarry,the Massignano Quarry, by a littlevillage in the Apennine Mountainsnear Ancona, Italy. Figure 19 depictsthe results for metre levels 4–8,which cover that time period. Theyare limestone beds interspersedwith marley beds, some of whichhave more clay in between them.Figure 19 also reproduces the resultsof a previous study of the iridiumcontent, which exhibits a peakbetween metres 5 and 6 (= 35 Ma).The abundance is not large, but thebackground level is about fifty partsper trillion whereas the peakcorresponds to parts per billion.There is also shocked quartz presentat the same level, as well as anobvious peak in the variation inskeletal spinel crystals, which weare quite sure relates to the influxFig. 19 — Asimplifiedstratigraphic column from theMassignano Quarry section(Clymer et al. 1996).of large objects into the atmosphere. The peak between 5 and 6 metresis an impact horizon.In the summer of 1996 Carolyn and I decided to sample thesection, for which Farley ran the 3 He test. Figure 20 presents theresults. For standardization we normally start below the iridiumpeak. We therefore covered about 13 metres of the section, equivalentto a little bit more than 2 million years. The time period covered isknown very accurately on the basis of microfossils in the rock,measurements of magnetic reversals, argon-argon age dating results,and biotite crystals for chronostratigraphy. We began at the lowestexposed section (between 0 and 1 metres), and then went up 13metres. The lowest exposed section has background levels of 3 He asexpected, but there is asubstantial increase atmetres 4 and higher. Thereis a lot of scatter in theresults. Statistically we knowthat 3 He is carried in fewenough grains that one maybe sampling just the largegrains. That will producescatter, not analytical scatterbut true scatter.The theoreticalexpectations for thedistribution of 3 Hecorresponding to a cometshower are plotted in figure20 with a dotted line. Thedistribution of 3 He doesFig. 20 — The concentration of 3 He duringthe late Eocene era from the MassignanoQuarry section represents a comet shower.appear to match predictions reasonably well. It does not mean thatthe grains responsible for depositing 3 He on Earth are from comets,however. The grains may well have originated in a shower, but at thevelocity of icy cometary particles, it is possible to grind a lot of particlesoff asteroids that are then delivered to Earth. Such particles mustimpact Earth at low enough speed that the 3 He is retained. In fact, apeak appears exactly where it was expected, and the time interval isspecified exactly by means of stratigraphy. It is not a one-time effectarising from currents in the Pacific Ocean, since the rock section isin the Mediterranean.I maintain that the peak represents a comet shower. Withreference to figure 18, consider for a moment the other peakcorresponding to the present. There is a true peak at 35 Ma thatcoincides with two large craters and all sorts of impact signatures.What about the peak almost 1 million years ago, the largest one? Ihave some concerns about it because it may be that some of the 3 Heleaks out. We are not certain. We know that the implied 3 He fluxindicated at time zero is the present flux; that is well established inmany other studies. Yet it could be that the flux decreases further inthe past because of the loss of 3 He. I prefer to believe otherwise, thatwhat is seen in figure 18 is actually a peak. It means that we are in aFig. 21 — The Australasian strewnfield shown by the dashed line(Glass & Pizzuto 1994) is the youngest recognized impact glassstrewnfield and may have originated from an impact perhaps 770,000years ago in Indochina.December/décembre 1998 JRASC307
peak now. We are presently in a comet shower. We should thereforebe able to recognize some large craters here on Earth that wereproduced by the shower.Figure 21 depicts the region of Southeast Asia and Australiaand plots the distribution of the youngest recognized strewnfield ofimpact glass, known as the Australasian strewnfield. The places whereimpact glass has been found are indicated: Xs for those on land andblack dots for those on the sea floor. In the region marked by shortdashes one begins to find very young glass, and occasionally onefinds other shocked material as well. Particularly in Indochina thereare huge chunks of glass. Therefore, it is believed that the source isthe enormous region (marked by the long dashes) running from theextreme western edge of the Indian Ocean well out into the westernPacific, from southern China to well south of Tasmania into thesouthern ocean. The strewnfield, as best can be determined, isintermediate in size between the strewnfield of impact glass associatedwith the Chesapeake Bay crater and what is believed to be thestrewnfield originating from the Popigai crater, which occurs in deepsea cores usually about 30 cm below the Chesapeake Bay glass.I believe that the impact horizon detected in the Massignanosections is actually associated with the Popigai crater. Thus, if oneconsiders the Popigai and Chesapeake Bay craters as upper and lowerlimits in size for the crater associated with the Australasian strewnfield,we should be searching for a fairly large crater. It should be on land,or at worst in very shallow water in or near Indochina. So far no onehas recognized it. It is also very young, probably 770,000 years old,and we ought to be able to detect it. Given enough time to search,we should find it. But it shows just how incomplete our knowledgeof the impact record is. I believe that we have probably already hada large crater formed within less than a million years ago.9. ConclusionHow is it that the cratering rate could have increased in late geologictime? I suggest that if you examine the actual distribution of agesfor craters larger than 20 km in diameter on the Moon and on theEarth, there appears to be a substantial increase in the cratering rateroughly 200–300 million years ago. It might even represent an increaseof a factor of two in the cratering rate for 20 km diameter craters.For the largest craters the rate is clearly an order of magnitude higher.What could cause the average cratering rate to increase if it isdue to comets? Two things could happen. One possibility is that amassive star or a molecular cloud stripped the outer part of the Oortcomet cloud. Such a circumstance could have happened in theProterozoic era. It would have taken a long time after that for theouter part of the Oort cloud to be replenished from the inner cloud.There is also something very interesting about the motion of the Sunperpendicular to the galactic plane, its z-motion. For other stars inthe solar neighborhood of spectral type G, stars more or less like theSun and about the same age, their oscillation perpendicular to thegalactic plane is not 75 pc. It is typically more like 300 pc, in whichcase the Sun’s orbit is rather atypical. Could it be that somethinghappened to the Sun? It may have been an event, perhaps the event,which stripped the outer part of the Oort cloud, following which theSun’s oscillation about the galactic plane was reduced. Perhaps asuccession of such encounters decreased the extent of the Sun’s z-motion relative to the galactic plane. Since its galactic orbit has itspending much of its time in region of higher star density where tidalperturbations on the Oort cloud are stronger, the delivery of cometsto the Earth would be increased. The average long-term flux couldincrease at least by a factor of two, and perhaps by an order ofmagnitude. There is much yet to be worked out, but I will leave youwith the following consideration. The study of the impact history ofEarth is in reality a way to study the history of the motion of the Earthin the Galaxy.Acknowledgments. The production of this paper with the aid of avideo tape made by Rob Dick for the RASC, and its transcription byPaula M. Kempchinsky, who with love and patience worked to producethe essence of a lecture that she had never heard and that was in anunfamiliar field, has been an effort more difficult and time consumingthan expected. It might never have been possible to bring Gene’sNorthcott Lecture to a final conclusion after his death in mid-1997had it not been for Paula’s generous help and love for her father-inlaw.Permission to use illustrations from the work of a number ofother authors and journals in which they published has been mostgratefully received.Carolyn S. ShoemakerLowell ObservatoryFlagstaff, Arizona, 86001U.S.A.ReferencesBinzel, R. P. 1992, in The Spaceguard Survey, Report of the NASA InternationalNear-Earth-Object Detection Workshop, chair D. MorrisonCorner, B., Reimold, W. U., Brandt, D. & Koeberl, C. 1997, Earth and PlanetaryResearch Letters, 146, 351-364Clymer, A. K., Bice, D. M. and Montanari, A. 1996, Geology, 24, p. 484Farley, K A. 1995, Nature, 376, 153-156Farley, K A. 1997, personal communicationGlass, B. P. & Pizzuto, J. E. 1994 J. Geophysical Research, 99, 19077Grieve, R. A. F. & Shoemaker, E. M. 1995, in Hazards Due to Comets andAsteroids, ed. T. Gehrels (University of Arizona Press: Tucson), pp.417-462Hildebrand, A. R., Penfield, G. T., Kring D. A., Pilkington, M., Camargo, A. Z.,Jacobsen, S. B., and Boynton, W. V. 1991 Geology 19: 867-871Masaitis, V. L. 1994, in Large Meteorite Impacts and Planetary Evolution,ed. B. O. Dressler, R. A. F. Grieve & V. L. Sharpton, Geological Societyof America Special Paper No. 293, 153-162Matese, J. J., Whitman, P. G., Innanen, K. A. & Valtonen, M. J. 1995, Icarus116, 255-268McEwen, A. S., Moore, J. M. & Shoemaker, E. M. 1997, J. Geophysical Research,102, 9231-9242Poag, C. W. 1997, Sedimentary Geology, 108, 48Shoemaker, C. S. 1996, JRASC, 90, 18-41Shoemaker, E. M. 1977, in Impact and Explosion Cratering, ed. D. J. Roddy,R. O. Pepin & R. B. Merrill (Pergamon Press: New York), pp. 617-628Shoemaker, E. M. & Hackman, R. J. 1962, in The Moon, ed. Z. Kopal et al.(Academic Press: San Diego), pp. 289-300308JRASC December/décembre 1998
Shoemaker, E. M. & Shoemaker, C. S. 1996, AGSO J. Australian Geology &Geophysics, 16, 379-398Shoemaker, E. M., Wolfe, R. F. & Shoemaker, C. S. 1990, in Global Catastrophesin Earth History: An Interdisciplinary Conference on Impacts, Volcanism,and Mass Mortality, ed. V. L. Sharpton & P. D. Ward, Geological Societyof America Special Paper No. 247, 155-170Wallace, M. W., Gostin, V. A. & Keays, R. R. 1990, Geology, 18, 132-135Williams, G. E. 1994a, In Large Meteorite Impacts and Planetary Evolution,ed. B. O. Dressler, R. A. G. Grieve & V .I. Sharpton, Geological Societyof America Special Paper No. 293, 209\226224Williams, G. E. 1994b, In Proceedings of the Royal Society of Victoria, 106,105\226127EUGENE M. SHOEMAKER (1928-1997) was a native of Los Angeles, California, and a graduate of the California Institute of Technologyand Princeton University. First and foremost a geologist, Gene took part in regional investigations of the geochemistry, volcanology, andstructure of the Colorado Plateau and wrote his signature work on Meteor Crater, Arizona. He followed that with an investigation of thestructure and history of the Moon, and an ongoing investigation of the impact history of the Earth, impact processes in the solar system,and the effects of large body impacts on the evolution of life. He was involved with the Ranger, Surveyor, and Apollo missions to the Moonand an investigator on the Voyager and Clementine Missions. From 1984 until his untimely death in July 1997, Gene took part in a dualinvestigation with his wife Carolyn searching for comets and asteroids and studying Australian impact structures. A member of theNational Academy of Sciences and a fellow of the American Academy of Arts and Sciences, he received many awards, including theNational Medal of Science.December/décembre 1998 JRASC309
ABSTRACTS OF PAPERS PRESENTED AT THE 1998 CASCA ANNUAL MEETINGHELD IN QUÉBEC, MAY 19–22, 1998Carlyle S. Beals Award Lecture/Conférence du prix CarlyleS. BealsChallenges for the New Millennium: Some Persistent AstronomicalMysteries, Gordon Walker, University of British Columbia.Carl Beals identified the strongest of the diffuse interstellar featuressixty years ago and remained fascinated by them all his life. Theirorigin and significance still remain largely a mystery, but satellitessuch as the Far Ultraviolet Spectroscopic Explorer (FUSE) may providecrucial clues through better understanding of interstellar chemistry.Acquiring direct images and spectra of extra-solar planets has emergedas one of the greatest challenges for the new space and 8-m groundtelescopes. Here I discuss some of the efforts made together with myMontreal colleagues to meet the special problems of observing throughthe Earth’s atmosphere and to speculate on our chance of success.J. S. Plaskett Medal Lecture/Conférence de la médaille J. S.PlaskettStar Formation in Molecular Clouds and Globular Clusters, Dean E.McLaughlin, University of California at Berkeley.The process of star formation is investigated in two complementaryways. First, a new model is developed for the internal structure ofthe dense cores of gas inside giant molecular clouds (GMCs), whichare the main sites of star formation in the Galaxy today. This model,which posits that the total gas pressure in these cores varies logarithmicallywith density, allows for an explicit description of the significant nonthermalmotions that support them, for a time, against their selfgravity.It is in good agreement with a range of observational data.This “logotropic” equation of state is used to explore the implicationsof turbulent initial conditions for the gravitational collapse of GMCcores. Second, the collective properties of globular cluster systems(GCSs) in galaxy halos are used to gain some insight into the importantphenomenon of clustered star formation. In particular, a theory isconstructed for the globular cluster luminosity function (GCLF).The GCLF is considered as having been built up by collisions betweengaseous protocluster “cores” within much larger (but subgalactic)“supergiant molecular clouds” in the halos of protogalaxies. Observationsof the GCLFs in the Milky Way, M31, and M87 are used to constrainbasic ingredients of the model, and the implications for present-daycluster formation are discussed.CITA Lecture/Conférence CITAMigrating Planets, N. Murray and B. Hansen, Canadian Institute forTheoretical Astrophysics, M. Holman, CITA/Harvard Center forAstrophysics, and S. Tremaine, CITA/Princeton University.A planet orbiting in a disk of planetesimals can experience an instabilityin which it migrates to much smaller orbital radii. Resonant gravitationalinteractions between the planet and planetesimals remove angularmomentum from the planetesimals, thereby increasing theireccentricities. Subsequently, the planetesimals either collide withthe planet or are ejected by close encounters with it; ejecting aplanetesimal reduces the semi-major axis of the planet. If the surfacedensity of planetesimals exceeds a critical value, corresponding to~0.03 solar masses of gas inside the orbit of Jupiter, the planet willmigrate inward a large distance. Such an instability may explain thepresence of Jupiter-mass objects in small orbits around nearby solartypestars.Keynote Address/Conférence principalObservations of Extrasolar Planets, Geoff Marcy, San Francisco StateUniversity.Eight candidate extrasolar planets have been identified by KeplerianDoppler shifts in their host stars. The masses (m sin i) lie between0.5 and 7 Jupiter masses and the semi-major axes are less than 2.1A.U. For three of the companions (47 UMa, CrB, and 55 Cnc), theircircular orbits must be primordial rather than tidally induced, indicativeof formation in a disk. Eccentric orbits may be explained by gravitationalperturbations, either by companion stars, other planets, or diskresonances. The detections imply that 5% of solar-type stars havegiant planets within 2 A.U. Orbital migration during the T Tauri diskphase provides a likely mechanism to explain the small orbits. Newplanet searches of 400 stars are underway at Keck and elsewhere,with the latest findings reported here.Contributed Papers/Présentations oralesObservations Fabry-Perot de spirales tardives, Sébastien Blais-Ouelletteand Claude Carignan, Université de Montréal.Les galaxies spirales tardives semblent se situer à une transition quantà la relation entre les paramètres de la matière sombre et le typemorphologique. Dans ces galaxies, les contributions lumineuses etsombres sont d’importance comparable bien avant le diamètre optiqueR H0 . Pour déterminer cette relation comme pour bien contraindreles paramètres de la distribution de masse, nous ajoutons à la grandesensibilité des données H i existantes, la haute résolution spatiale etspectrale de données Fabry-Perot pour un échantillon de galaxiesspirales tardives.Isotopic Anomalies of Platinum in the HgMn Star HR 7775, DavidBohlender, Herzberg Institute of Astrophysics, and Michael Dworetskyand Chris Jomaron, University College London.310Journal of the Royal Astronomical Society of Canada, 92:310–321, 1998 DecemberDecember/décembre 1998
High resolution, high signal-to-noise ratio, Canada-France-HawaiiTelescope Gecko spectra have been obtained for the regions of thefive strongest optical lines of Pt ii in the spectrum of the cool HgMnstar HR 7775. Model line profiles have been constructed based onisotopic and hyperfine structure laboratory analyses, and abundancesfor the individual isotopes have been determined from spectrumsynthesis. The total abundance of platinum is 4.46 dex greater thanthe adopted solar abundance. The isotopic composition is clearlynon-terrestrial, with a pronounced relative enhancement of theheaviest isotope, 198 Pt, and deficiencies of the isotopes lighter than196 Pt. The pattern of isotopic composition does not follow the widelyassumed fractionation formalism; the lighter isotopes are far moredeficient than a single-parameter fractionation pattern would predict.The Mystery of Wolf-Rayet Emission-Line Variability: A ShockingBehaviour from a Clumpy Wind 1 , Sébastien Lépine and Anthony F. J.Moffat, Université de Montréal.We present the results of a study of line-profile variability (lpv) inemission-lines of Wolf-Rayet stars. High-resolution spectroscopicobservations from the Canada-France-Hawaii Telescope shed newlight on the behaviour of such stochastic lpv. We show that the lpvis broadly consistent with line emission from a clumpy wind. However,strange behaviour from the clumps suggests that the wind inhomogeneityarises in dramatic hydrodynamical events that may be related toradiative instabilities generated by the intense radiation field fromthe underlying star.HST Studies of Second-Parameter Globular Clusters in the Outer GalacticHalo, P. B. Stetson, J. E. Hesser, and S. van den Bergh, Herzberg Instituteof Astrophysics/NRC, M. Bolte and J. A. Johnson, University ofCalifornia Observatories/Lick Observatory, W. E. Harris, McMasterUniversity, D. A. VandenBerg, University of Victoria, R. A. Bell, Universityof Maryland, H. E. Bond and L. Fullton, Space Telescope ScienceInstitute, G. G. Fahlman and H. B. Richer, University of British Columbia.We have observed the globular clusters Palomar 3, Palomar 4 andEridanus with the Wide Field Planetary Camera 2 on the HubbleSpace Telescope. These three are classic examples of the “secondparameter” anomaly because of their red horizontal-branch morphologiesin combination with their low-to-intermediate metallicities. Our (V,I) colour-magnitude diagrams (CMDs) reach V (limit) ~ 27.8 andclearly delineate the subgiant and turnoff regions and about threemagnitudes of the unevolved main sequence. The slopes and dereddenedcolours of the giant branches are consistent with published [Fe/H]estimates that rank the clusters (Pal 3, Eri, Pal 4) in order of increasingmetallicity, with all three falling near or between the abundancevalues of the classic nearby halo clusters M3 and M5. From differentialfits of their CMDs, we find that the three outer-halo clusters differfrom those of the nearby ones in a way that is consistent with thedistant objects being younger by ~1.5–2 Gyr. Such an inferred agedifference could be smaller (< 1 Gyr) if either [Fe/H] or [/Fe] forthe outer-halo clusters is significantly lower than we have assumed.Possible age spreads of order 1 Gyr among both the nearby and outerhaloclusters may also be present.Liquid Mirror Telescopes: A Progress Report, Ermanno F. Borra,Université Laval.I briefly review the status of the Liquid Mirror Telescope (LMT)project. In a nutshell, liquid mirrors do work. Optical shop tests showthat the optical qualities are very high (diffraction limit). The largestLM built so far (in the Laval lab — see paper by Tremblay) has adiameter of 3.7-m. Several liquid mirror telescopes have been builtand operated for several years. The largest working LMT (operatedby NASA) has a diameter of 3.0 metres and has yielded so far over100 nights of deep sky images. Several articles dealing with astronomicalresults are currently being written (see paper by Cabanac). A 6-mLMT is presently being built at UBC. The future of the technologylooks bright, promising very large diameters and greater versatility.A novel corrector design indicates that fields of regard as large as 20degrees (with 20 arcminute corrected patches) should be feasible. Inthe laboratory, efforts to develop novel reflecting liquids are also veryencouraging. Heeding the calls by the national granting agencies, weare also successfully exploring industrial applications that exploitthe unique qualities of LMs (e.g. large diameters at low cost). A threedimensionalscanner using a LM as its main optical element has beendemonstrated.Cosmic Parameters from the Cosmic Microwave Background, J. RichardBond, Canadian Institute for Theoretical Astrophysics.A long-standing goal of theorists has been to constrain cosmologicalparameters that define the structure formation theory from cosmicmicrowave background (CMB) anisotropy experiments and largescalestructure (LSS) observations. The status of the enterprise isdescribed using full Bayesian analysis for high weight CMB experiments,such as those provided by the Cosmic Background Explorer (COBE)satellite’s Differential Microwave Radiometer (DMR) and Saskatoon1995, approximate band-power techniques from cluster abundances,and shape constraints from observations of galaxy clustering. Theinitial fluctuation spectrum is not far off the scale invariant form(slope near unity) that inflation models prefer — e.g. for tilted colddark matter (CDM) sequences of fixed 13 Gyr age, n s = 1.01 ±0.05for CMB experiments alone, as well as when LSS constraints areincluded. Open models are slightly preferred over models by theCMB data, but are much less likely than models when LSS informationis included. The values found are the same as those obtained usinghigh redshift Type I supernovae.Innovations in Altair, the Gemini Adaptive Optics System, Glen Herriotand Simon Morris, Herzberg Institute of Astrophysics/NRC.Altair includes some interesting new design ideas, because of theinfrastructure provided by the Gemini Observatory and because ofthe decision to put Altair’s deformable mirror at an image of theplane 6.5 kilometres in front of the telescope.Hélioséismologie de la tachocline solaire, Paul Charbonneau, HighAltitude Observatory, National Center for Atmospheric Research.1 Selected as the best student oral paper at the 1998 meeting.December/décembre 1998 JRASC311
La tachocline est une région de forte rotation différentielle situéedirectement sous la zone convective du soleil. Je décrirai quelquesinversions hélioséismiques récentes visant à determiner la structurede la tachocline, et discuterai brièvement des conséquences de cesrésultats pour les modèles de la dynamo solaire.Coherent Emission Mechanisms in Radio Pulsars, Maxim Lyutikov,Canadian Institute for Theoretical Astrophysics.A theory of pulsar radio emission generation, in which theobserved waves are produced directly by maser-type plasmainstabilities on the anomalous cyclotron-Cherenkov resonance – k || v || + B / res = 0 and the Cherenkov-drift resonance – k || v || – k u d =0, is capable of explaining the main observational characteristics ofpulsar radio emission. The instabilities result from the interactionof the fast particles of the primary beam and from the tail of thedistribution with the normal modes of a strongly magnetized onedimensionalelectron-positron plasma. The waves emitted at suchresonances are vacuum-like electromagnetic waves that may leavethe magnetosphere directly. The cyclotron-Cherenkov instability isresponsible for the core emission pattern, and the Cherenkov-driftinstability produces conal emission. The conditions for the developmentof the cyclotron-Cherenkov instability are satisfied for both typicaland millisecond pulsars provided that the streaming energy of thebulk plasma is not very high, p = 5 10. In a typical pulsar thecyclotron-Cherenkov and Cherenkov-drift resonances occur in theouter parts of the magnetosphere at r res 10 9 cm. The theory canaccount for various aspects of pulsar phenomenology including themorphology of the pulses, their polarization properties, and spectralbehaviour.The Discovery of an Open Cluster Associated with Two Wolf-RayetStars, Steve Shorlin, University of Western Ontario, and David G.Turner, Saint Mary’s University.CCD photometry reveals a very young open cluster, at a distance of12.6 kpc, associated with two Wolf-Rayet stars: WR 38 and WR 38a.WR 38 is the first Wolf-Rayet star of spectral subtype WC4 to befound in a galactic open cluster; its estimated absolute magnitudeis far brighter than has become accepted for WC4 stars in our Galaxy.The absolute magnitude estimated for WR 38a confirms what isknown about other stars of spectral subtype WN6.Searching the Galaxy for Wolf-Rayet Stars, A. F. J. Moffat, Universitéde Montréal, M. M. Shara, Space Telescope Science Institute, L. F.Smith, University of Sydney, V. S. Niemela, La Plata, M. Potter, SpaceTelescope Science Institute, and R. Lamontagne, Université deMontréal.We have just completed an optical Schmidt plate survey andspectroscopic confirmation of the Southern Milky Way for new Wolf-Rayet (WR) stars as faint as 19 th magnitude. The 31 newly detectedWR stars are amongst the reddest and/or most distant known in theGalaxy. They clearly demonstrate an increasing number ratio of WNto WC subtypes with increasing galactocentric distance. The totalnumber of known galactic WR stars now stands at over 200. We usea simple galactic model to predict the total number of galactic WRstars that should be discovered in future infrared surveys in the wholeGalaxy.Modeling the Diversity of Outer Planetary Systems, Martin JamesDuncan, Queen’s University.It has been made clear in the last few years that the dynamical structureof extra-solar planetary systems can vary significantly from systemto system. In order to understand the range of possible systems better,we present the results of a set of bottom-up numerical simulationsdesigned to generate plausible giant planet systems from a largenumber of planetary embryos. Our simulations produced systemsstable for at least a billion years with a wide range of characteristics,including some reminiscent of our own planetary system. The numberof planets ranged from one to seven. Many systems contained onlyUranus-mass objects. We constructed systems that were more compactthan our own and systems that were much less compact with planetson very eccentric orbits. Perhaps most surprisingly, we constructedsystems that were stable for at least a billion years despite undergoingmacroscopic orbital changes on much shorter time scales.Anchor’s Away, Jayanne English, Queen’s University, A. Russell Taylor,University of Calgary, and Judith A. Irwin, Queen’s University.We present preliminary results of a study of an anchor-shaped atomichydrogen structure whose base occurs south of the Milky Way’s midplaneand which extends to more negative latitudes ending in a “cap.”The data were acquired as part of the Canadian Galactic Plane Surveyproject using the Dominion Radio Astrophysical Observatory’s(DRAO) Synthesis Telescope (ST). After the incorporation of datafrom the 26-m DRAO single-dish telescope, the mosaic data cubehas full information on all spatial scales down to the resolution limitof 1 arcminute. The velocity resolution is 0.82 km s –1 . Although theprojected extent of the “anchor” is only a few hundred parsecs, it maybe fountain-like or may represent the initial stages of a kiloparsecscaleblowout structure. In either case it could illuminate the processesby which gas in the Galaxy’s halo is replenished and how the halo’senergy input is maintained.Helical Fields and Filamentary Molecular Clouds, Ralph Pudritz andJason Fiege, McMaster University.Molecular clouds are observed to be filamentary structures that aresupported by magnetic fields and non-thermal (magneto-hydrodynamic)turbulence of some sort. Most theoretical models for self-gravitatingfilaments have featured magnetic fields that are aligned with thelong axis of the filaments. However, observations suggest that someof these clouds could be wrapped by helical magnetic fields (Heiles1987). We present a new and more general model for filamentarymolecular clouds that incorporates the important possible role ofhelical fields.312JRASC December/décembre 1998
High Spatial Density of the Disk Population Contact Binaries, SlavekRucinski, Canada-France-Hawaii Telescope Corporation.Analysis of the OGLE micro-lensing survey data in terms of thepresence of contact binaries of the W UMa-type has permittedderivation of the luminosity function for these objects from a volumelimited(3 kpc) sample to absolute magnitude M V = 5.5. With (large)sampling-volume corrections, the function can be estimatedapproximately to fainter levels, down to the short-period end of thecontact binary sequence at M V = 7.5. Comparison of the luminosityfunction with that for main sequence stars gives a high apparentfrequency of occurrence of the W UMa-type binaries of one such asystem for about 100–120 main sequence stars. This frequency is theapparent one and does not take into account missed systems withlow orbital inclinations; the correction for those would increase thefrequency by 1.5–2 times. When compared with the frequency ofbinary stars in the galactic field, derived by Duquennoy & Mayor(1991) and extrapolated to the shortest orbital periods, the contactbinary stars show a large excess in the period range of 0.25–0.6 day,which suggests that many (or all) originated from close binary systemswith somewhat longer periods that lost large amounts of their angularmomenta.A roAp Star Survey in the Northern Hemisphere, François Chagnonand Jaymie Matthews, University of British Columbia, and PhilippeEenens, Universidad de Guanajato.The rapidly oscillating Ap stars represent powerful objects to testasteroseismology owing to their high-overtone p-mode pulsations.As only three of the stars are known in the northern hemisphere,where we can use very good spectroscopic sites, it is of vital importanceto find more roAp stars in order to apply the techniques ofasteroseismology. We conducted a photometric search for such roApstars in the northern hemisphere at the Observatório AstronómicoNacional, México. The results of the search are presented, along withsome new photometric data for a recently discovered roAp.Polarimetric Variability of Binary Young Stars, Nadine Manset andPierre Bastien, Université de Montréal.Young stars are surrounded by accretion disks in which dust grainsscatter and polarize stellar light. In binary systems, models predictsuch polarization will show phase-locked variations with a doublesine behaviour. About fifteen binary young stars have been observedat the Observatoire du Mont Mégantic to seek such polarimetricvariations. Preliminary results show that a majority of binary youngstars are polarimetric variables, and some show phase-locked variations.If the existing models can be successfully applied to such young stars,observations can be used to find their orbital inclinations. Since thesystems are also spectroscopic binaries, the known inclinations willthen specify the masses of the young stars, a very important parameterfor testing evolutionary models.Events in the Star Forming Region Cepheus A, Victor A. Hughes, Queen’sUniversity.A monitoring of the star forming region Cepheus A, over a period of13 years, using the Very Large Array has revealed a number of eventsthat are associated with the early stages of star formation. The eventsare unique in that no other region has been monitored for such along period, whether it is a star forming region or not. The eventsinclude the demonstration of a jet exhibiting both the Mach and jetshocks, a source that shows two diverging radio sources, two sourcesthat can appear and disappear in periods of 100 days and that havebrightness temperatures of 10 6 to 10 9 K, and an object that containsthree individual components which appear to be in orbit. An attemptis made to put these observations into perspective with regard toprotostar formation.Origin and Observables of the Cosmic Web, D. Pogosyan and J. R. Bond,Canadian Institute for Theoretical Astrophysics, and L. Kofman,University of Hawaii.Observations indicate galaxies are distributed in a filament-dominatedweb-like structure. Numerical experiments at high and low redshiftof viable structure formation theories also show filament-dominance.We have shown that the final state web is actually present in embryonicform in the overdensity pattern of the initial fluctuations, and islargely defined by the position and primordial tidal fields of rareevents in the medium, with the strongest filaments between nearbypeaks (clusters at low redshift, galaxies at high redshift) whose tidaltensors are nearly aligned. Here the web theory is used to craft N-body and hydrodynamical simulations that confront observationsprobing low redshift cluster-cluster bridges by weak gravitationallensing, X-rays, and the Sunyaev-Zel’dovich (SZ) effect. Our resultsindicate that lensing at moderate redshift can probe the filamentsbest among the three observational strategies, but also that the SZeffect will be useful for probing the outskirts of clusters.Variabilité cyclique d’étoiles Wolf-Rayet apparemment isolées, ThierryMorel and Nicole St-Louis, Université de Montréal.Nous discutons de récentes observations photométriques etspectroscopiques illustrant le caractère strictement périodique —bien que fortement dépendant de l’époque d’observation — desvariations dans les étoiles Wolf-Rayet apparemment isolées WR 6(3.77 jours) et WR 134 (2.3 jours). Nous présentons des argumentscontre l’éventuelle association de ces deux étoiles avec un compagnondégénéré (i.e. “invisible”) et proposons que, à l’instar de certainesétoiles OB, la périodicité observée serait plutôt induite par la modulationpar rotation d’un vent largement anisotropique. Les mécanismessusceptibles d’engendrer une telle situation seront également discutés.Dust Formation Episode in the Long-Period Binary WR137: DirectImaging with HST/NICMOS 2, Sergey Marchenko, A. F. J. Moffat andY. Grosdidier, Université de Montréal.We report preliminary results of medium-band (H´ and K´) directimaging of the dust-forming binary WR 137 with the NICMOS-2camera of Hubble Space Telescope. The images were obtained duringperiastron passage in this long-period (~13 yr) binary. We haveDecember/décembre 1998 JRASC313
esolved, for the first time, infrared-emitting dust in the closeenvironment of HD 192641. The dust emission occurs in a few strongclumps within about 0˝.5 of the star and likely arises in the shockconezone where the winds collide. We estimate the mass of theresolved dust features to be 5 +7-3 10 –8 M .Star Formation in Bar Environments, Pierre Martin, Télescope Canada-France-Hawaii, and Daniel Friedli, Université Laval.Galactic bars are the sites of highly diversified star formation activities.Along certain bars no star formation is present, while in othersnumerous giant H ii regions are seen. To better understand howmassive star formation is triggered or quenched in bar environments,we describe a general study of the morphological and physicalproperties (i.e. density, excitation, abundances) of H ii regions foundalong the bars of eleven spirals. The results were then used to investigatethe star formation process along bars by means of numerical simulations.In a wider context, the implications of star forming activity alongbars for the fueling of active galactic nuclei and the evolution ofbarred spiral galaxies in general are briefly discussed.The Far Ultraviolet Spectroscopic Explorer Mission, Alex Fullerton,University of Victoria/The Johns Hopkins University.The Far Ultraviolet Spectroscopic Explorer (FUSE) is a free-flyingsatellite that has been developed for NASA by a consortium ofinstitutions under the leadership of the Johns Hopkins University. Itis scheduled to be launched into low-Earth orbit in late 1998 or early1999. Over its lifetime of at least 3 years, it will obtain high-resolution(R ~ 30,000) spectra of many astronomical sources between 905 and1195 Angstroms. Although this spectral region is extraordinarily richin atomic and molecular resonance lines, it has not been routinelyaccessible for nearly 20 years. Thus, results from FUSE are expectedto have a significant impact on many current problems in interstellar,stellar, and extragalactic astrophysics. The present paper providesan brief overview of the FUSE mission, including instrumentation,operations, Science Team projects, and the Guest Investigator Program.As part of the co-operative agreement between NASA and the CanadianSpace Agency (who provided the fine error sensors for FUSE), Canadianinvestigators have access to at least 5% of the total observing time.Consequently, FUSE represents a particularly valuable resource forthe Canadian astronomical community.H i in Dwarf Spheroidal Galaxies, Claude Carignan, Université deMontréal.H i has now been detected in the field of three Local Group dwarfspheroidal galaxies: Tucana, Sculptor and Phoenix. While, as will bedescribed, the H i in the field of Tucana is probably not associatedwith the galaxy but is more likely a component of the MagellanicStream, the spatial and velocity coincidences of the gas mapped inthe field of Sculptor suggest that it is most likely associated with thedwarf galaxy. As for Phoenix, it is difficult to draw any conclusionsabout the origin of the gas since no optical velocity is yet availablefor the galaxy.MOST: Probing Stellar Interiors with Canada’s First Space Telescope,Jaymie Matthews, University of British Columbia.The MOST (Microvariability & Oscillations of STars) mission will bea microsatellite carrying a 15-cm optical telescope in a polar low-Earth orbit. MOST is designed to detect rapid oscillations at the levelof a few micromagnitudes in bright solar-type stars, as well asmicrovariability in a variety of stellar targets including Wolf-Rayetstars. One of the mission goals is to estimate the ages and globalproperties of some of the oldest metal-poor stars in the solarneighbourhood, setting independent lower limits on the age of theuniverse.Wide Field Imaging of Low Redshift Galaxy Clusters, W. A. Barkhouseand H. K. C. Yee, University of Toronto, and O. López-Cruz, InstitutoNacional de Astrofísica Optica y Eléctronica.The advent of large format mosaic CCD cameras has given us theunprecedented ability to sample efficiently the galaxy population inlow redshift galaxy clusters. We are presently conducting a photometricstudy of galaxy clusters in the redshift range of 0.02-0.04 with the 8kCCD mosaic camera on the KPNO 0.9-m telescope. Thistelescope/detector combination, with a pixel scale of 0˝.42 pixel –1 ,provides a one-square-degree field of view, giving an areal coverageof 1–2 h –1 Mpc 2 . The observations will allow us to determine theprojected spatial distribution and luminosity function (LF) of clustergalaxies. With such data we will test the cD formation scenario basedupon the disruption of dwarf galaxies (López-Cruz et al. 1996, ApJ,475, L97) by: a) measuring LFs as a function of cluster-centric radius;b) determining the spatial distribution of dwarf galaxies; and c)measuring the colour gradients for dwarf galaxies as well as the halosof cD and brightest cluster galaxies (BCGs). We report here on thecurrent progress of the project.Astronomy Education/Pédagogie d’astronomieLa Trousse d’exploration du système solaire: un outil pédagogique pourles écoles, Pierre Chastenay, Planétarium de Montréal.La Trousse d’exploration du système solaire est une valise pédagogiqueautonome destinée aux élèves du niveau préscolaire et des premieret deuxième cycles du primaire. Elle se compose de trois unitésindépendantes qui abordent chacune un thème précis. Le “Loto desplanètes” est un jeu de mémoire qui permet aux participants d’apprendreà reconnaître et à nommer les principaux objets qui composent lesystème solaire: le Soleil, les planètes et leurs principaux satellites,les astéroïdes et les comètes. L’activité “Le système solaire à l’échelle”permet aux enfants de construire un modèle à l’échelle du diamètredu Soleil et des planètes, puis un modèle des distances qui les séparentdans l’espace. Enfin, l’activité “Le cadran solaire” permet aux élèvesde construire un cadran solaire simple et d’apprendre à lire l’heureà l’aide du Soleil. La Trousse d’exploration du système solaire circuledans les écoles de la région de Montréal depuis janvier 1998 et devraitêtre disponible dans toutes les régions du Québec dès septembre1998.314JRASC December/décembre 1998
Poster Papers/Présentations “Posters”Classification of LMC, SMC and Milky Way Carbon Stars Between 7700Å and 8800 Å, Loïc Albert and Serge Demers, Université de Montréal,and Willam E. Kunkel, Carnegie Institution of Washington.We present a spectral classification of carbon (C) stars based on thered part of the continuum. It is inspired by Richer’s classification(1971, ApJ, 167, 521) of photographic spectra. Our effort is based on100 Milky Way C stars observed at the Observatoire du mont Méganticand 70 Magellanic Cloud C stars observed at Las Campanas. Mostof the stars selected were classified by Richer and, in the blue domain,by Barnbaum et al. (1996, ApJS, 105, 419). At 1 Å resolution we couldidentify two criteria to classify spectra of these AGB stars, namelythe strength of the CN molecular bands between 7800 Å and 8200Å, and the strength of the Ca ii triplet at 8498 Å, 8543 Å and 8662 Å.No atomic line was identified except the Ca ii triplet. Its strength isfound to correlate with T eff determined from JHK photometry andweakly with luminosity as determined from the LMC C stars. Thegoal of our project was to seek spectral criteria to differentiate SMCfrom LMC C stars. No obvious differences are seen in the spectra ofthe LMC, SMC and Milky Way families of C stars. Higher than acertain Ca ii strength threshold, however, all Milky Way C stars pertainto the hotter C-R, C-H families, which originate from carbon-richmass transfers in a binary system (McClure, 1997, PASP, 109, 256).We conclude that the 7700 Å – 8800 Å spectral range is not ideal forspectral classification.Structural and Evolutionary Models of Helium Core White Dwarfs,Josep M. Aparicio and Gilles Fontaine, Université de Montréal.We present the calculation of a series of evolutionary tracks of heliumcore white dwarfs, from the loss of the hydrogen-rich envelope onwards.NGC 7129: SVS 13 and Other Stars, Pierre Bastien, Roger Hajjar 1 andDaniel Nadeau, Université de Montréal. 1 also Notre Dame University,Lebanon.Polarimetric observations carried out at the Mont Mégantic Observatoryhave revealed SVS 13 to have the highest linear polarization in NGC7129. On polarization maps it also exhibits the largest disk, asdetermined by the angular distance between the two null points atthe edges of the parallel vector pattern. At the distance of NGC 7129,1.25 kpc, the disk has a size of approximately 5600 A.U. in the I band.The J band polarimetric map (from the Canada-France-HawaiiTelescope) also exhibits a large disk. The measured emissivity indexof = 0.22, deduced from millimetre and sub-millimetre continuumphotometric measurements at the James Clerk Maxwell Telescope,is compatible with what is found for young stellar objects. We havefound four new infrared sources around SVS 13, and a large numberof infrared sources are also present around LkH 234. They fall onor around a V-shaped ridge of enhanced emission in the infrared,also visible in H 2 , which provides insight into their star formationhistory. Based on such information, we confirm this scenario: theformation of BD+65° 1638 triggered the formation of the other starsthrough shocked molecular gas by the stellar wind. It is an ongoingprocess where presently SVS 13 and LkH 234 are triggering starformation. (This paper is part of the Ph.D. thesis of Roger Hajjar.)Observations of p-mode Pulsations in Hot B Subdwarfs, M. Billères, G.Fontaine, P. Brassard, and S. Charpinet, Université de Montréal, J.Liebert, University of Arizona, R. A. Saffer, Villanova University, andG. Vauclair, Observatoire Midi-Pyrénées.We present some results of our ongoing search for pulsating stars ofa new type in the field of asteroseismology — the EC14026 variablesor pulsating sdB stars, whose existence was predicted theoretically.Seven such objects are now known. All are multiperiodic pulsatorsshowing excited p-modes. We discuss some of our observations ofthe objects and also compare the class properties with furthertheoretical predictions described in a related paper.A New Generation of White Dwarf Evolutionary Models, P. Brassardand G. Fontaine, Université de Montréal.We present a new generation of white dwarf models that incorporatethe latest developments in the constituent physics. They are evolutionarymodels especially designed for studying the cooling, spectral evolution,and seismology of white dwarfs.A Search for Peculiar Objects with the NASA Orbital Debris Observatory3-m Liquid Mirror Telescope, Rémi Cabanac and Ermanno Borra,Université Laval, and Mario Beauchemin, Centre canadien detélédétection.The NASA Orbital Debris Observatory (NODO) survey uses a transit3-m liquid mirror telescope to observe a strip of sky in twenty narrowband filters. Here we analyze a subset of data from the 1996 season.The catalogue consists of 18,000 objects with V between 10 and 19in ten narrow-band filters from 500 nm to 950 nm. We first demonstratethe reliability of the data by fitting a Bahcall-Soneira model of theGalaxy to the NODO star counts. We then perform a hierarchicalclustering analysis in order to extract objects exhibiting peculiarenergy distributions. The present study marks the first instance inoptical astronomy of astronomical research completed with a newtype of optics.Theory of Pulsating Subdwarf B Stars: A Set of Testable Predictions, S.Charpinet, G. Fontaine, and P. Brassard, Université de Montréal, P.Chayer, University of California, Berkeley, F. J. Rogers and C. A. Iglesias,Lawrence Livermore National Laboratory, and B. Dorman, GoddardSpace Flight Center, NASA.Pulsating subdwarf B (sdB) stars, now called EC14026 stars after theclass prototype (Kilkenny et al. 1997, MNRAS 285, 640), were firstpredicted theoretically from stellar pulsation theory (Charpinet etal. 1996, ApJ, 471, L103). The identified mechanism that destabilizessuch stars, a k-mechanism associated with local accumulations ofiron resulting from heavy metal diffusion processes (Charpinet et al.1997, ApJ, 484, L123), also reveals several characteristics of excitedDecember/décembre 1998 JRASC315
acoustic modes that can be tested. In this paper we summarize ourtheoretical predictions to allow comparison with observed pulsators.The Mode Switch of the RR Lyrae Star V79 in M3, Christine M. Clement,University of Toronto.A recent investigation of variable stars in the globular cluster M3 byClement, Hilditch, Kaluzny & Rucinski (1997, ApJ, 489, L55) revealedthat the RR Lyrae variable V79 had switched modes. Their observations,obtained in 1996, showed that V79 was a double-mode (RRd) variablewith the first overtone mode dominating, but all previously publisheddata (1962 and earlier) had indicated that the star was a fundamentalmode (RRab) pulsator with an irregular light curve. They consideredthe mode switch to be observational evidence for blueward evolutionof horizontal branch stars in the Oosterhoff type I cluster M3.Subsequently, Corwin, Carney & Allen (1998, IBVS, No. 4548) confirmedthat V79 was an RRd star with the first overtone dominating, basedon observations that they made in 1992 and 1993. Meanwhile, in astudy of V79 on M3 photographs in the Sternberg Observatory platecollection, Goranskij (1980, Astronomical Circular, 1111, 6) showedthat the pulsation period of V79 decreased substantially and its amplitude varied between 1956 and 1976, although he was unableto detect any oscillations in the first overtone mode. An analysis ofapproximately 1000 observations of V79 made in the Soviet Unionbetween 1950 and 1991 is presented here. It appears that the modeswitch took place in late 1991 or early 1992. Prior to the switch,however, the star exhibited chaotic behaviour.Near-Infrared Observations of the Metal-Poor Inner Spheroid GlobularCluster NGC 6287, Tim Davidge, Canadian Gemini ProjectOffice/HIA/UBC.Deep JHK images are used to probe the stellar content of the metalpoor([Fe/H] ~ –2) globular cluster NGC 6287, which van den Bergh(1993, ApJ, 411, 173) suggests may be one of the oldest objects in theGalaxy. The data, which extend to the main sequence turn-off, areused to investigate the metallicity, distance, reddening, and age ofthe cluster.The Youngest Stars of the Sculptor Dwarf Spheroidal Galaxy, SergeDemers, Université de Montréal, and Paolo Battinelli, OsservatorioAstronomico di Roma.The discovery of neutral hydrogen in the periphery of Sculptor byCarignan et al. (1998) has inspired us to look for young stars associatedwith the region of largest H i velocity dispersion. This small area,located 15 arcminutes from the centre of Sculptor, was imaged inDecember 1997 with the Tek 2K CCD attached to the CTIO 1.5-mtelescope. The colour-magnitude diagram contains nearly 200 bluestars brighter than the populous turnoff seen at V = 23. Isochronefittings imply that the stars, if they are not blue stragglers, are 1 Gyrand older. Such blue stars are distributed, in the field observed, likethe bulk of the stars and do not appear to be associated with the gas.KIR: First Light, R. Doyon and N. St-Louis, Université de Montréal,C. Robert, D. Devost, J.-R. Roy, and L. Drissen, Université Laval.KIR is the 1024 1024 (K) high-resolution near-infrared (IR) cameraused with the adaptive optics bonnette on the Canada-France-HawaiiTelescope. First light on KIR was obtained on December 8, 1997, fora program devoted to starburst galaxies. The seeing conditions wereexcellent (0˝.6 to 0˝.7) with typical spatial resolution of 0˝.2 to 0˝.3.A preliminary analysis of the observations is presented.The Canadian Astronomical Data Centre Services/Les Services duCentre Canadien des Données Astronomiques, Daniel Durand, InstitutHerzberg d’Astrophysique, David Bohlender and David Shade, HerzbergInstitute of Astrophysics.After many years of existence, the Canadian Astronomical DataCentre (CADC) is now an important international service forastronomers. This paper presents an overview of the different servicesoffered by the CADC as well as a presentation of future services.A Study of the Gas and Dust Content of NGC 7129, Andreea Font andGeorge F. Mitchell, Saint Mary’s University, and Henry Matthews,Joint Astronomy Center.NGC 7129 is a molecular cloud containing photon heated gas (aphoto-dissociation region, PDR) and gas shocked by an outflow.Using the Sub-millimetre Common User Bolometer Array (SCUBA)on the James Clerk Maxwell Telescope, we have obtained 850 mand 450 m continuum maps of the two overlapping fields. In orderto compare gas and grain properties, we obtained C 18 O J = 3–2 spectraat nine positions in the same region. The line ratio 13 CO/C 18 O hasbeen used to find the optical depth, excitation temperature columndensities, and the mass of the clumps at each position. We foundexcitation temperatures in the range of 20–40 K along the ridge andmuch lower, ~12 K, in the outflow. The masses of the clumps are ofthe order of few solar masses. The frequency dependence of the dustextinction ( ~ ) is a clue to the dust properties. We investigatedthe spectral variation in the dust properties by calculating fromthe 850 m /450 m flux ratio. The values differed at each position,lying in the range of 1.50–2.75. In the assumption that the gas andthe dust are tightly coupled (T gas = T dust ), we calculated the dust massesat both wavelengths and compared them with the mass of the gas.Cosmological Hydrodynamic Simulations with Molecular HydrogenChemistry, Todd Fuller and Hugh Couchman, University of WesternOntario.The first objects in cold dark matter (CDM)-like cosmologies format a redshift of z ~ 10 – 30, have a baryonic mass of ~ 3 10 4 M , andhave virial temperatures of several hundred degrees. At such a lowtemperature fragmentation and cooling is possible only throughmolecular hydrogen cooling. Numerical simulations of first objectformation must therefore model H 2 chemistry. We have included thechemical reactions involving H, H + , H – , H 2 , H 2 + and e – in our N-bodygravitational + gas dynamic code. To test the code, we simulate a tophatcollapse and compare the results with an analytic model. We316JRASC December/décembre 1998
eport some preliminary results and discuss the effects H 2 coolinghas on object formation.H i Self-Absorption in the Canadian Galactic Plane Survey: First Results,Steven J. Gibson and A. R. Taylor, University of Calgary, and P. E.Dewdney, Herzberg Institute of Astrophysics.Neutral hydrogen 21-cm line emission is widely used to chart thewarm and cool diffuse components of the interstellar medium. Lessstudied is the colder constituent revealed by H i self-absorptionagainst background H i emission, though, where detected, it hasoften shown a significant correlation with dense clouds of moleculargas and dust. While there is some evidence that H i self-absorptionmay be a more sensitive tracer of cold gas than CO emission, detailedexamination of the exact relationships between them and otherconstituents of the interstellar medium (ISM) requires both highangular resolution and an unbiased sample. The ongoing CanadianGalactic Plane Survey (CGPS) meets such criteria to an unprecedenteddegree, permitting the comparison of H i, CO and dust features atarcminute scales over hundreds of square degrees of the Milky Way.We present the first results of an investigation of neutral hydrogenself-absorption features in the CGPS data set.WFPC2/H Imagery of the Nebula M1–67: A Clumpy Wolf-Rayet WindImprinting Itself on the Nebular Structure?, Yves Grosdidier and A. F.J. Moffat, Université de Montréal, G. Joncas, Université Laval, and A.Acker, Observatoire de Strasbourg.With the Wide Field Planetary Camera 2 on the Hubble Space Telescope,we have obtained a deep, net H image of the relatively young ejectiontypenebula M1–67 around the runaway population I Wolf-Rayet(WR) star WR124 (spectral type WN8). Our image shows a wealthof complex details, some of which have never been seen before insuch a nebula. In particular, besides large arcs of nebulosity extendingchaotically in many directions yet with no overall global shell structureto the nebula, we note the presence of numerous, bright, resolvedknots of emission, often surrounded by what appear to be their ownlocal “wind” bubbles. Is this the first direct evidence of spatiallyresolved clumps being ejected from the wind of a hot central star?IDEFIX, un imageur polarimétrique pour l’Observatoire du MontMégantic, Olivier Hernandez, Université de Montréal.L’Observatoire du Mont Mégantic se dote d’un imageur polarimétrique.Idefix est un instrument qui permettra d’obtenir deux images depolarisation perpendiculaire de façon simultanée sur le CCD Loral.Le champ de chaque image sera de plus de deux minutes d’arc etcela permettra l’étude d’étoiles très jeunes. Grâce à un choix de quatrefiltres BVRI, une étude en longueur d’onde pourra être effectuée.Enfin, autant les polarisations linéaire et circulaire pourront êtreétudiées grâce aux lames demi-ondes ou quart d’onde placée à l’entréed’Idefix. Les premières lumières sont prévues pour le mois de juin1998.Resolution of QSOs with the Adaptive Optics Bonnette on the Canada-France-Hawaii Telescope, John Hutching, David Crampton and SimonMorris, Herzberg Institute of Astrophysics/NRC.We have used the Adaptive Optics Bonnette to obtain high-resolutionimages of QSOs at redshift ~1 and higher. While signal levels are lowwith small pixels, we have resolved at least half the host galaxies inearly processing, and in many we detect faint tails or arms that implytidal interactions. In the higher redshift QSOs, the host galaxies havecompact or faint old stellar populations, and appear to be dominatedby young stellar populations.Orbital Motion in the Symbiotic Nova HM Sge, H. T. Kenny, RoyalMilitary College, and A. R. Taylor, University of Calgary.HM Sge is a D-type symbiotic star system that exhibited a symbioticnova eruption beginning in 1975. Very Large Array images at 5 and22.5 GHz are presented along with data extending from 1982 to 1998.The morphology and evolution of the radio emission is analyzed interms of a model that considers the effects of both colliding winds(Kwok, Purton & Fitzgerald 1978; Girard & Willson 1987; Kenny1995), and differential ionization (STB model: Seaquist, Taylor &Button 1984; Taylor & Seaquist 1984). The outer shell, of radius ~ 2˝,is characterized by a ratio of mass loss rate to velocity of M • c/v c = 5.1±0.3 10 –8 3/2D kpc [M • yr –1 ][km s –1 ] –1 . The inner shell, of radius ~ 0˝.3,is characterized by a value that is ~4 times larger, i.e. M • c/v c = 1.9 ±0.9 10 –7 3/2D kpc [M • yr –1 ][km s –1 ] –1 . At 22.5 GHz the radio morphologyincludes two features that evolve in separation and position angle.They are analyzed in terms of a model of orbital colliding winds. Thederived orbital elements imply a highly inclined orbit (i = 78˚ ±4˚)with a period of 80 +60 –20 years and a binary separation of 24 +10 –5 A.U. fora total system mass of 2 M . Spectral analysis (the STB model) suggests+130an angular binary separation of ~ 0˝.1, and yields a distance of 300 –65pc. A distance as great as 750 pc is permitted if the present mass losscharacteristics of the cool component have returned to their preoutburstvalues, as represented in the outer shell.The Dominion Radio Astrophysical Observatory, Tom L. Landecker,Herzberg Institute of Astrophysics/NRC.The Dominion Radio Astrophysical Observatory (DRAO) is part ofthe Herzberg Institute of Astrophysics, within the National ResearchCouncil. The principal fields of astronomical research at the DRAOare interstellar medium studies, all aspects of research with spacevery-long-baseline interferometry, and solar radio astronomy. Thethemes of DRAO engineering and technical expertise are: (a) thedesign and operation of aperture synthesis telescopes; (b) antennas;(c) digital signal processing systems, especially correlator systems;and (d) image processing. The major facilities at the DRAO are theSynthesis Telescope, the 26-m Telescope, and the telescopes of theSolar Radio Flux Monitoring Program. DRAO supports six majorprojects: (a) the Canadian Galactic Plane Survey; (b) the operationof the Canadian correlator for the Very Long Baseline InterferometrySpace Orbital Project (VSOP); (c) the Solar Flux Monitoring program;(d) ACSIS, the development of a correlator for the focal plane arrayson the James Clerk Maxwell Telescope; (e) the program to define thefuture of Canadian Radio Astronomy; and (f) work to protect theDecember/décembre 1998 JRASC317
adio astronomy spectrum allocations.Mise en évidence des régions de formation d’étoiles à la périphérie dela galaxie spirale NGC 628 2 , Mario Lelièvre, Université Laval.Discussion des résultats obtenus suite à la détection et à l’analysedes régions H ii au-delà de R25 pour la galaxie spirale tardive NGC628. Le but est d’étudier les processus de formation d’étoiles massivesdans les régions du disque non affectées par l’onde de densité spirale.Au terme de cette étude, nous mettrons à l’épreuve certaines théoriesdiscutant de conditions particulières en densité de gaz nécessaire àla formation d’étoiles massives.Évolution des abondances chimiques dans les atmosphères d’étoilesnaines blanches froides, Alain Malo and F. Wesemael, Université deMontréal, and P. Bergeron, Lockheed Martin Canada.Les étoiles naines blanches montrent des changements dramatiquesdans la composition chimique de leur enveloppe au cours de leurrefroidissement, en particulier à T eff ~ 6000 K où on observe que lesnaines blanches de type non-DA se transforment en naines blanchesde type DA. A ces températures, la majorité des étoiles froides peuventêtre modélisées à l’aide d’atmosphères composées soit d’hydrogènesoit d’hélium. Cependant, une demi-douzaine d’objets semblentcaractérisés par des distributions d’énergie typiques d’atmosphèresriches en hydrogène, alors que leurs spectres ne montrent pas la raied’absorption H. Nous passons en revue les mécanismes proposésdans le but d’expliquer les propriétés de ces objets, et démontronsqu’aucun de ceux-ci n’arrive à reproduire adéquatement les observations.Aberrations du miroir primaire du mont Mégantic: Avons-nous un bontélescope?, Christian Marois and René Racine, Université de Montréal.Dans le processus d’implantation d’un système d’optique adaptative,il est essentiel de connaître les limites intrinsèques du télescope. Lesaberrations ainsi détectées permettent de fixer les performancesfutures du système et d’envisager des mesures de correction si celas’avère nécessaire. Nous présentons donc les résultats de nos recherchesportant sur le miroir primaire du mont Mégantic.The Distribution of Mass in the Core of Virgo and Dynamics of theGlobular Cluster System around M87, Dean E. McLaughlin, Universityof California at Berkeley.Radial velocities for a sample of 205 globular clusters around M87,recently obtained by Cohen & Ryzhov (1997), are used to investigatethe dynamics of the globular cluster system (GCS) of this cD galaxy.Previous analyses of similar (but sparser) data have made a prioriassumptions on some property of the GCS (e.g. isotropic orbits) inorder to use the cluster velocities to constrain the dark matter densityprofile in the core of Virgo. Here, we instead refer to the distributionof stars and gas in M87 to construct a mass model for the Virgocluster independently of any data on the GCS. This is then used,along with the observed GCS density profile, to solve the Jeans equationfor the GCS velocity dispersion as a function of radius in M87. Theorbital anisotropy of the cluster system is a free parameter in suchan approach, and is constrained by comparing model line-of-sightvelocity dispersions with the data of Cohen & Ryzhov.Spectrophotométrie de la Croix d’Einstein dans le proche infrarouge,D. Nadeau, R. Racine, and R. Doyon, Université de Montréal.Nous présentons des images spectrophotométriques (/ = 60)du quadruple mirage par lentille gravitationnelle Q2237+0305 obtenuesavec MONICA au Télescope Canada-France-Hawaii en 1992, 1993et 1994 dans le domaine spectral 1.700 m < < 2.40 m. Ces donnéessont utilisées pour séparer l’emission continue de l’emission par laraie H, décalée à une longeur d’onde de 1.77 m, et étudier lesdifférences de microamplification reliées aux différentes dimensionsde la source d’émission continue et de la source d’émission H. Cesdonnées permettent aussi de détecter la cinquième image du quasar,quasi-coïncidente avec le noyau de la galaxie.A Thermal Mass-Transfer Model for Supersoft X-Ray Sources, LorneA. Nelson and M.-P. Portelance, Bishop’s University.We analyze a binary model for the recently identified class of objectsknown as Supersoft X-ray Sources. According to the model, a subgiantcompanion fills its Roche lobe and loses matter onto a C-O whitedwarf accretor. We show that the donor loses mass on its Kelvintimescale and that this rate of accretion onto the degenerate dwarfis sufficiently high to ensure that stable nuclear burning occurs onits surface (i.e. the mass of the degenerate companion can increase).Using population synthesis techniques, we compare the theoreticallyexpected number of supersoft sources with that which is actuallyobserved and investigate the possibility that these sources are theprogenitors of Type Ia supernovae.Calculating Re-Ionization: The Effect of Diffuse Population III Stars,Alexei Razoumov, University of British Columbia.Recombination of the universe at z ~ 1000 gave rise to the cosmicdark age which lasted until “moderate” redshifts. However, theobservable universe is almost entirely ionized and transparent toradiation. The details of re-ionization are closely related to the growthof structure between redshifts 30 and 10, with light coming from thefirst generation of stars and quasars. A numerical scheme for threedimensionaltime-dependent radiative transfer, to be merged withan existing cosmological hydrodynamical code, is being developed.Prior work in the field usually focused either on one-dimensionalproblems, or on using some local approximation (self-shielding, localoptical depth). We present here a method to solve the momentequations of the radiation field, allowing for a complex geometry ofray propagation. Hopefully, the technique will allow us to computethe growth of ionized bubbles from collapsed objects into a clumpymedium.2 Selected as the best student poster paper at the 1998 meeting318JRASC December/décembre 1998
SCUBA Observations of the Light Curves of Ceres, Vesta and Pallas,Russell O. Redman, Henry E. Matthews, and Paul Feldman, HerzbergInstitute of Astrophysics/NRC.Ceres and Vesta were observed on the night of 1997 October 14, andPallas on the night of 1998 April 25, using the Sub-millimetre CommonUser Bolometer Array (SCUBA) on the James Clerk Maxwell Telescope.Vesta exhibited single-peaked light curves at 450 and 2000 microns,with the same shape at both wavelengths. The data for Ceres suggesta double-peaked light curve at both wavelengths, with much largeramplitude than is observed at visible wavelengths. Both results arecompletely unexpected and cannot be tied simply to the opticallydetermined triaxial shapes of the asteroids. Pallas was too faint toexhibit light variations at 2000 microns.Atomic Hydrogen Near the Cygnus Loop, Robert S. Roger, HerzbergInstitute of Astrophysics/NRC, and Denis A. Leahy, University ofCalgary.H i 21-cm line observations of the Cygnus Loop have been made withthe Dominion Radio Astrophysical Observatory’s Synthesis Telescopeand 26-m Telescope. Spectral line maps for 128 channels with 1.65km s –1 velocity separation were constructed for a 6 degree squarefield encompassing the supernova remnant (SNR). A number offeatures are detected in and around the Cygnus Loop, but no featuresare clearly identified with the interior of the remnant. However, severalfeatures have interior edges closely matching the outer boundary ofthe SNR. They provide evidence for the wall of the cavity into whichthe Cygnus Loop is hypothesized to be expanding.La preuve de l’existence de vents stellaires en collision dans le systèmebinaire WR+O Velorum a été obtenue par l’entremise d’uneimportante série de spectres optiques. Les caractéristiques du chocdéduites de l’analyse de ces spectres sont présentées. Evidence forthe presence of colliding winds in the WR+O binary system Velorumhas been obtained through an extensive series of optical spectra. Thecharacteristics of the shock region deduced from the spectra arepresented.The Sun’s Energy Output and the 10.7-cm Flux, Kenneth Frank Tapping,Herzberg Institute of Astrophysics/NRC.The Sun’s energy output has been measured over more than a solaractivity cycle by orbiting radiometers. The National Research Councilof Canada has made accurate measurements of the 10.7-cm solarflux over the same period. The 10.7-cm flux is an effective measureof the total magnetic flux in the lower solar atmosphere. In addition,there are connections between the Sun’s total energy output andmagnetic activity: sunspots cause dips and faculae enhancements.In a comparison between measurements of the energy output andthe 10.7-cm flux, each averaged over solar rotations, we find a strong,positive correlation. The processes modulating the Sun’s energyoutput over time scales up to a solar cycle also modulate the densityand magnetic field strength in the lower corona, where the 10.7-cmemissions originate. There are signs of hysteresis between the energyoutput and the 10.7-cm flux between the rising and falling parts ofthe cycle. However, there are insufficient data to determine whetherthis is a systematic phenomenon.The Orbits of Two Giant Binary Stars, C. D. Scarfe, University of Victoria.HD 90512 and HD 121212 are both single-spectrum binary stars,whose primaries are giants. Their orbital elements have been determinedfrom radial velocities obtained with the Dominion AstrophysicalObservatory 1.2-m telescope and coudé radial velocity spectrometer.Their periods are near 100 days and their orbital eccentricities arelow. Thus they provide two new points near the boundary betweencircular and eccentric orbits in the period-eccentricity diagram forbinaries containing giants.H i in the Field of the Dwarf Spheroidal Galaxy Phoenix, Julie St-Germain and Claude Carignan, Université de Montréal.We present new results based on a mosaic of the H i emission in thefield of the dwarf spheroidal galaxy Phoenix done with the AustraliaTelescope Compact Array. H i emission is seen in four different velocitycomponents (–23, 0, 56, and 140 km s –1 ). While the component at 0km s –1 is of galactic origin and the one at 140 km s –1 is probably relatedto the Magellanic Stream, one of the two other components couldbe associated with Phoenix. However, optical velocities are neededto verify whether that is the case.Vents en collision dans Velorum/Colliding Winds in Velorum, NicoleSt-Louis, Université de Montréal.The Canadian Galactic Plane Survey, A. R. Taylor, S. Gibson, D. Leahy,M. Peracaula, and S. Dougherty, University of Calgary, C. Carignanand N. St-Louis, Université de Montréal, M. Fich, University of Waterloo,N. Ghazzali, G. Joncas, S. Pineault, and S. Mashchenko, UniversitéLaval, J. Irwin and J. English, Queen’s University, C. Heiles and M.Normandeau, University of California, P. Martin, D. Johnstone, andS. Basu, Canadian Insititute for Theoretical Astrophysics, W. McCutcheon,University of British Columbia, D. Routledge and F. Vaneldik, Universityof Alberta, P. Dewdney, J. Galt, A. Gray, L. Higgs, L. Knee, T. Landecker,C. Purton, R. S. Roger, K. Tapping, B. Wallace, and T. Willis, HerzbergInstitute of Astrophysics, C. Beichman, California Institute ofTechnology, N. Duric, University of New Mexico, D. Green, CambridgeUniversity, M. Heyer, University of Massachusetts, H. Wendker,Hamburger Sternwarte, and Z. Xi-Zhen, Beijing AstronomicalObservatory.In April 1995 the Dominion Radio Astrophysical Observatory (DRAO),in collaboration with a consortium of university astronomers, begana project to image the atomic hydrogen and radio continuum emissionfrom the interstellar medium of the Milky Way galaxy. By constructinga mosaic of almost 200 synthesis fields, the survey will cover theregion 75° < l < 145° and –3 < b < +5°, with angular resolution of 1arcminute. The atomic hydrogen cube will yield three-dimensionalimages with spatial resolution of order 1 parsec over regions severalkiloparsecs in extent. In the continuum, full Stokes I, Q, U and Vimages are produced at 1420 MHz and a Stokes I image at 408 MHz.Approximately 50% of the DRAO observations have now beenDecember/décembre 1998 JRASC319
completed, and the first complete mosaic images were created inDecember 1997. Here we present a description of the survey projectand highlights of the discoveries and results from the initial dataproducts.A Spectroscopic Study of Binary B-Type Subdwarf (sdB) Stars, PascalThériault, Robert Lamontagne, and F. Wesemael, Université deMontréal.The sdB stars are extended horizontal-branch members, havingsuffered important mass loss sometime on their evolutionary paths.It is worth asking what role binarity might have in this scenario.Earlier photometric studies estimated that about 60% of the B-typesubdwarfs are in binary systems, where the spectral type of thesecondary, which resides either on the main sequence or on thesubgiant branch, ranges from late-G to early-M. Here we presentoptical spectra of several suspected binary sdB stars that permit adeconvolution of the components of the system. Values for theparameters of each component are presented.A 3.7-m Liquid Mirror, Grégoire Tremblay and Ermanno Borra,Université Laval.We have constructed a 3.7-m liquid mirror in our laboratory and arecurrently testing it using a variety of optical shop tests. Presentedhere are some of the results we have obtained so far.Monitoring Cepheid Period Changes from Saint Mary’s University,David G. Turner, Andrew J. Horsford and Joseph D. MacMillan, SaintMary’s University.The 0.4-m telescope of the Burke-Gaffney Observatory at Saint Mary’swas used with a CCD camera during the summers of 1996 and 1997to image a selection of Cepheid variables in blue light. Seasonal lightcurves for each program star were constructed using the calculatedmagnitude differences of the Cepheids relative to reference stars inthe same fields of view, and the data were then matched to existinglight curve templates for each variable in order to establish O–Ccorrections to existing ephemerides. Examples of the results obtainedfor individual program stars are presented here. The long temporalbaselines of O–C data that now exist for the observational historiesof northern hemisphere Cepheids provide excellent material forstudying their period changes. Such changes in turn are relateddirectly to the rate at which the stars are evolving through the instabilitystrip in the H-R diagram. From the results of our photometricmonitoring it is possible to identify the probable crossing modes ofour program objects with a fair degree of confidence. Extensive studiesof a larger sample of Cepheids provide rather interesting revelationsabout the instability strip crossing modes of various objects. Someof the more controversial findings are described here.Magnetism in Molecular Clouds: Monstrous Mayhem and Mild Madness,J. P. Vallée, Herzberg Institute of Astrophysics/NRC, and P. Bastien,Université de Montréal.In young clouds the magnetic field is expected to be simple or atmost to show mild madness (because of clump collisions, Alfvenwaves, etc.). In old clouds the magnetic field is expected to be complexand to show monstrous mayhem (attributable to star-forming regions,bending magnetic lanes, etc). We present new linear polarizationobservations at a wavelength of 800 microns of nearby dusty molecularclouds made with the James Clerk Maxwell Telescope (JCMT) inHawaii. The JCMT observations show that the magnetic field is oftenobserved to be perpendicular to a cloud’s elongation, constrainingthe possible geometries and time evolution. For extended clouds thelength scale of the magnetic field is of the order of the cloud itself orlarger. We assume that the polarization comes from emission bynonspherical grains aligned by a magnetic field, and that the directionof the tangential component of the magnetic field is given byperpendiculars to the observed position angles of the linear polarization.A Detailed Investigation of the Environment of Active Galaxies, MarcelVandalfsen, McMaster University, and M. M. De Robertis, YorkUniversity.An analysis of some of the properties and environmental parametersof a sample of CfA Seyfert galaxies and a control sample of non-activegalaxies is presented. To reduce selection effects, the two samplesare well matched in redshift, luminosity and overall morphology. Inparticular, the distribution of host galaxy properties, including diskand bulge scale radii and surface brightnesses, are shown to be similar.The distribution of properties of the host galaxy “companions” —galaxies in the field of a Seyfert or control galaxy out to a commonprojected distance — are also illustrated. The distributions of relativecompanion frequency, projected separation (from the host), angulardistribution, apparent magnitude difference relative to the host, andmaximal tidal influence are found to be similar between both samples.Moreover, the frequency of “morphological disturbances” (bars, ringsand distortions) between the Seyfert and control galaxies is foundto be very similar. Though there is room for a more thorough investigation,nuclear activity does not appear to correlate with host-galaxy propertiesor the properties of the local environment.Radiative Transfer and SPH Simulation, Serge Viau and Pierre Bastien,Université de Montréal.We study in three dimensions the hydrodynamical collapse of interstellarclouds to form stars with a Smooth Particle Hydrodynamics (SPH)code. In the SPH simulation of a collapsing cloud, the main advantageis that the code does not require a grid to compute spatial derivatives.Instead, we use point particles. Each particle possesses its ownproperties (mass, density, temperature), and those properties aresmoothed out over an extended region by a given function called thekernel. The object of the research here is to add radiative transfer tothe energy conservation equation. The new version of the SPH codewill be very helpful in studying the behaviour of a molecular cloudduring its collapse once we include radiative transfer. For example,we are particularly interested in the accretion disk. We should beable to measure the distribution of the temperature along the disk.320JRASC December/décembre 1998
Analysis of Two-Colour Data for Seyfert and Normal Galaxies, S. Viraniand M. De Robertis, York University.A non-linear least-squares fitting algorithm was developed to determinethe surface brightness structural parameters from a data set consistingof 22 B and R images of Seyfert galaxies and 59 R images of nonactivegalaxies matched in redshift, luminosity and overall morphology.Rather than adopt a de Vaucouleurs law, a more general relationshipwas used. In particular, the exponent for the bulge component wasnot adopted a priori. Recent studies have shown that assuming anr (1/n) “law,” where n does not equal 4, may provide better fits than thestandard r (1/4) law. We present results obtained from fitting a generalSersic form to our data set. The best-fitting value for n is found tovary between 2 and 4. Comparisons of the B and R data for the Seyferts,as well as the R data for the Seyferts and non-active sample, areprovided.The Missing Interstellar Medium of NGC 147 and M32, G. Welch, SaintMary’s University, and L. J. Sage, Univ. of Maryland.We present the results of a search for CO (J = 1–0) emission fromNGC 147 and M32, two of the four dwarf elliptical companions ofM31. Return of gas from evolved stars to the interstellar medium ofthese galaxies should have resulted in detections, but we find insteadupper limits of 5500 and 6700 solar masses for NGC 147 and M32,respectively. Including an earlier H i limit, we find that the gaseousinterstellar medium of NGC 147 comprises less than 2% of what isexpected. The large published H i mass limit for M32 prevents usfrom reaching a similarly extreme conclusion for it. Our results standin stark contrast to what is seen in NGC 185 and NGC 205, wherethe observed gas is approximately what is expected from stellar massloss, though some of the gas in NGC 205 must have had an externalorigin. There are no obvious differences in masses or luminositiesthat would explain the results. The proposal that differences may berelated to the recent interaction histories of the galaxies with M31does not seem to be viable. The results may point to a fundamentalgap in our understanding of galaxy evolution.Les naines blanches variables de type V777 Her, F. Wesemael, Universitéde Montréal, A. Beauchamp, CAE Électronique Ltée, P. Bergeron,Lockheed Martin Canada, and G. Fontaine, Université de Montréal.Les naines blanches de type V777 Her forment un groupe homogèned’étoiles variables à atmosphères composées d’hélium (types DB etDBA). Ces objets, en pulsation non radiale, sont tous caractériséspar des températures effectives de l’ordre de 20,000 K. Nous présentonsune analyse spectroscopique détaillée des huit étoiles V777 Herconnues, ainsi que d’un échantillon de 21 autres étoiles de mêmetype spectral, toutes plus chaudes que 17,500 K. Les températureseffectives déterminées permettent d’identifier les bornes de la banded’instabilité des étoiles V777 Her, ainsi que de contraindre les analysesséismologiques de ces objets.Large-Scale Structure of Molecular Gas in M17, C. D. Wilson, McMasterUniversity, J. E. Howe, University of Massachusetts, and M. L. Balogh,University of Victoria.Large-area CO maps of the molecular cloud M17 obtained at theJames Clerk Maxwell Telescope have been used to study the CO lineratios and physical conditions in the cloud. The CO emission linesup to the J = 3 level do not appear to be sensitive to small amountsof very hot gas. The 12 CO/ 13 CO line ratios correlate with the 13 COintensity, primarily because of variations in the column density fromone position to another. Physical conditions (density, temperature)derived from globally averaged line ratios agree well with resultsobtained along individual lines-of-sight, which suggests that typicalphysical conditions can be measured successfully using global COline ratios. The 12 CO/ 13 CO J = 2–1 and J = 3–2 line ratios indicate asystematic increase in these line ratios as we move to larger physicalscales. These results suggest that emission from low column density“diffuse” molecular gas makes an important contribution to the COemission in galactic disks.December/décembre 1998 321JRASC
Education NotesRubriques PédagogiquesVARIABLE STARS IN YOUR CLASSROOMby John R. PercyErindale Campus, University of TorontoElectronic Mail: jpercy@erin.utoronto.caandJanet Akyüz MatteiAmerican Association of Variable Star ObserversElectronic Mail: jmattei@aavso.orgAbstract. The observation and analysis of variable stars can develop and integrate a wide range of science, mathematics, and computingskills, from junior high school to university level. The American Association of Variable Star Observers (AAVSO) has recently completeda major project Hands-On Astrophysics to use variable stars to enhance science and mathematics education. We describe the projectand other variable star activities for your classroom.Résumé. L’observation d’étoiles variables et l’analyse des données qui en découlent encouragent le développement et l’intégration deconnaissances de la science, des mathématiques et des ordinateurs, spécialement chez les étudiants, allant des débutants au secondairejusqu’à ceux au niveau universitaire. L’Association américaine des observateurs d’étoiles variables (AAVSO) a récemment complété unprogramme important intitulé Hands-On Astrophysics dont le but est d’utiliser l’étude d’étoiles variables pour améliorer l’instruction ensciences et en mathématiques. Nous décrivons le projet et d’autres activités concernant les étoiles variables qui conviennent à vos élèvesSEM1. IntroductionFor many years one of us (JRP) made visits each year to small collegesas part of the American Astronomical Society’s Harlow ShapleyVisiting Lecturer Program. He would often find astronomy instructorswho were looking for sky activities that involved real science and thatcould be done successfully with little or no equipment — even inclimatically-underprivileged locations. He realized that his ownfavourite research objects — variable stars — could be used for thatpurpose. Variable stars are stars that change in brightness; theyprovide astronomers with important information about stellarproperties and evolution. In some cases the variability can be measuredwith the unaided eye. Each student could make a few measurementsover the course of a month or two. Such measurements could bepooled with those of other students for analysis and interpretationin a daytime lab. Through variable stars, students could be given“eyes-on” exposure to both the process and the excitement of science.For equally many years the other of us (JAM), as Director of theAmerican Association of Variable Star Observers (AAVSO), had beenanswering requests from teachers for lab activities, and from studentsfor science fair projects. As a scientist and former teacher, sherecognized that variable star observing is simple but challenging,and therefore suitable for school settings. She also recognized thatvariable star observers can make a significant contribution to scientificresearch, and that such a prospect could provide motivation andexcitement for students.The AAVSO is the largest organization of variable star observersin the world, with members and observers in 46 countries. About575 observers submit over 300,000 measurements of thousands ofstars to the AAVSO each year. The AAVSO data base now containsover 8 1 ⁄2 million measurements, and is a unique and precious resourcefor science and education. The educational opportunities for theAAVSO and its data base were opened up by a small but influentialmeeting on “An Education Initiative in Astronomy” (Brown 1990),and by the availability of National Science Foundation funding forscience education projects.Together, we harnessed our long-standing interests in variablestars and in education, and developed a proposal for Hands-OnAstrophysics (HOA) — a project that would use variable star observationand analysis to develop and integrate a wide range of skills in science,mathematics, and computing. The project was generously fundedby the National Science Foundation, and, five years later, the projectis complete and available for your school or university classroom.As we developed ideas for simple activities and projects, weincluded them in our annual “Variable Star of the Year” column inthe Royal Astronomical Society of Canada’s Observer’s Handbook,because we recognized that they would be of interest to both newand experienced amateur astronomers as well as to teachers andstudents (MacRobert 1996). We described the observation of Cephei— a “core” activity in HOA — in the 1994 Handbook, Algol ( Persei)in 1995, photographing variable stars in 1997, the bright red giantvariable Herculis in 1998, and another bright red giant variable WCygni in 1999. See Levy (1989) for an introduction to variable starobserving.322Journal of the Royal Astronomical Society of Canada, 92: 322–324, 1998 DecemberDecember/décembre 1998
2. Variable Star Activities in the ClassroomVariable star astronomy is well suited for student activities andprojects. It is simple in process, but sophisticated and powerful inits applications to science and mathematics education. The 550-page HOA teachers’ and students’ manual, written primarily bycurriculum specialist Donna Young, links the activities to currentscience and mathematics education standards, as well as providinga wealth of information on the science, mathematics, history, andpeople of variable star astronomy. Astronomy is poised to play anenhanced role in science education in Canada (Percy 1998). Variablestar activities connect naturally to many of the topics proposed forthe grade 9 and 11/12 levels, and beyond.Ideally, students can identify and measure variable stars in thereal sky. Even in the most light-polluted environment, students canmeasure the brightness of the red supergiant variable star Betelgeuse,as it sets in the west, relative to Aldebaran (V = +0.85) on the right,and Procyon (V = +0.38) on the left. The data can then be used in theclassroom to discuss measurement, measurement uncertainties,mean, and standard deviation. Betelgeuse, because of its enormoussize, its potential to explode as a supernova, and its sometimescorruptedpronunciation, is always of special interest to students.Many other variable stars are 3 rd magnitude or brighter, and canbe seen and measured in most urban, suburban, and rural locations.There are bright eclipsing variables such as Lyrae and Persei(Algol). There are Cepheid variables such as Cephei, Geminorum,and Aquilae, conveniently spread around the sky. Each student inthe class can measure Cephei, for instance, a few times over thecourse of a month or two. The class data set can then be used foranalysis and interpretation in the classroom or lab to illustrate manymore concepts and skills — variability, periodicity, and graphicalanalysis (Carlson 1989; Percy 1993). HOA includes 45 charts for 15variable stars in five constellations, along with their comparison starsequences.During the development of HOA, we held two workshops forexpert teachers who could advise and assist us. For several weeksbefore the autumn 1994 workshop, 14 teachers, from many parts ofthe U.S., measured Cephei whenever they could, and submittedtheir measurements to AAVSO Headquarters. At the workshop, theteachers were able to work with the combined data set of 202measurements, including their own. For them it was the highlight ofthe workshop — doing real science with real measurements. Theycould compare the observed time of maximum brightness with thepredicted time, and even detect the effect of the star’s evolution. Theycould see how their own measurements compared with others, andhow the efforts of many people could be combined, for the benefitof all.What about the problem that “the stars come out at night, butthe students don’t?” One solution is to use photographs. HOA includesa set of 31 slides, and 14 prints, that students can use in the classroomor lab to learn the process of variable star measurement. Some teachersor students may wish to make their own set of slides, as Toronto highschool student Laura Syczak did. She succeeded in photographingthe variable star RT Aur (period 3.7 days) on eight consecutive nights,as described in our article in the 1997 Observer’s Handbook and inPercy et al. (1997). One of us (JRP) has used the images in variablestar observing workshops on several occasions.Students — especially those with a special interest in mathematicsand computer science — can also enjoy variable star analysis indoors,on the computer. HOA includes three PC software programs: acomputer-based tutorial HOAFUN, a data entry program HOAENTER,and a powerful data analysis program VSTAR. It also includes a database of over 600,000 measurements of 50 variable stars from theAAVSO International Database. Students can analyze “their own”star and report on their results. VSTAR gives students a hands-onintroduction to time series analysis — a technique that is now usedin almost every branch of science, engineering, and commerce.Or students may just want to watch videos! HOA includes a videocassette with three separate videos on Backyard Astronomy, VariableStars, and How to Observe Variable Stars. The first is inspirational,the second is informational, and the third is instructional. They wereproduced in co-operation with Sheridan College, Oakville, Ontario.HOA can be ordered from: AAVSO, 25 Birch Street, CambridgeMA 02138-1205, U.S.A.; Electronic-mail: aavso@aavso.org; WWW:www.aavso.org. The cost is US$200 (US$150 for AAVSO members).The software and the videos are available separately, for US$62 andUS$23, respectively; (US$52 and US$18 for AAVSO members). TheAAVSO web site includes a wealth of information about variablestars and variable star observing, as well as web pages that specificallysupport HOA.3. ExtensionsOnce students have mastered the techniques of variable star observationand analysis, the sky’s the limit! They can become regular variablestar observers and contribute to astronomical research. The bestway to do that is to become an AAVSO member and observer. Contactthe AAVSO at the addresses given above for more information.Students with an interest in the life sciences may want to findout more about the physiology of visual measurement of variablestars. How does the eye make such measurements? What are thesources of error? How do the brightness and colour of the star affectmeasurements? Are there systematic differences between measurementsfrom different observers?Variable stars make excellent science fair projects. One activevariable star observer — 16-year-old Mary Dombrowski of GlastonburyCT — was the 1998 winner of the National Young Astronomer Award.For such projects students can analyze their own data, or data fromHOA, or from the AAVSO web site, or even from the European SpaceAgency’s Hipparcos satellite. This satellite made photometricobservations of 120,000 stars for over three years and the observationsare now publicly available on the Hipparcos web site: either theresearch tools page (astro.estec.esa.nl/Hipparcos/research.html) orthe animations page (astro.estec.esa.nl/Hipparcos/animations.html),or via either link from the education page(astro.estec.esa.nl/Hipparcos/education.html), which we recommendhighly. The HOA software package VSTAR can be used on any variablestar data, including Hipparcos data. There are still many new resultsand discoveries waiting to be made in this gold mine of data, andsuch potential discoveries make wonderful incentives for scienceand mathemetics students from the senior high school to the senioruniversity level.For many years one of us (Percy 1990) has used variable starprojects for students in the University of Toronto Mentorship Program,which enables outstanding senior high school students to work onDecember/décembre 1998 JRASC323
esearch and education projects at the university. These studentshave already published a dozen research and education papers basedon their work. The program has been a “win-win” proposition — forthe university, for the high schools, and for faculty and students inmany academic disciplines from anthropology to zoology.4. EpilogueOne of our goals is to encourage more young people in North Americaand beyond to take up amateur astronomy — both for their ownbenefit and for the benefit of science and education. Amateurastronomy is hands-on science — observing, recording, analyzing,interpreting, understanding, and appreciating. Astronomy is one ofthe few areas of science that can become a lifelong hobby. We hopethat other branches of amateur astronomy — the Sun, the Moon andplanets, comets and asteroids, occultations, double stars, and deepskyastronomy — can be linked to science education, bringing realscience to students and bringing young people to amateur astronomy.In the words of the song (and the title of an eloquent book by variablestar astronomer Helen Sawyer Hogg), “The Stars Belong to Everyone.”So do the Sun, Moon, and planets. They can bring the excitement ofscience into classrooms and into the lives of millions of people of allages.Acknowledgements. Hands-On Astrophysics was partially funded byNSF grant ESI-9154091. We are deeply grateful to NSF and to ProgramDirector Dr. Gerhard Salinger for encouragement and support. Wethank the dozens of astronomers (both amateur and professional)and educators who have contributed to HOA, either directly or throughthe AAVSO, for their advice and assistance.John R. PercyErindale CampusUniversity of TorontoMississauga, Ontario, L5L 1C6CanadaJanet Akyüz MatteiAmerican Association of Variable Star Observers25 Birch StreetCambridge, MA 02138-1205U.S.A.ReferencesBrown, R. A. 1990, An Education Initiative in Astronomy, NASACarlson, G. A. 1989, Scientific American, November, p. 128Levy, D. H. 1989, Observing Variable Stars: A Guide for the Beginner (CambridgeUniversity Press: Cambridge)MacRobert, A. M. 1996, Sky & Telescope, 91, No. 3, March, p. 48Percy, J. R. 1990, JRASC, 84, 49Percy, J. R. 1993, The Physics Teacher, 31, 541Percy, J. R. 1998, JRASC, 92, 38Percy, J. R., Syczak, L. & Mattei, J. A. 1997, The Physics Teacher, 35, 349JOHN PERCY is a Professor of Astronomy at Erindale Campus, Universityof Toronto. He is President of the Astronomical Society of the Pacific andPast President of the IAU’s Commission on Teaching of Astronomy. Formore than thirty-five years he has worked to bring more and better astronomyto Canadian schools, as indicated by his previous Education Note on thePan-Canadian Science Project published in the February issue.JANET MATTEI is the Director of the American Association of VariableStar Observers.324JRASC December/décembre 1998
Across the RASCdu nouveau dans les CentresSociety News /Nouvelles de la sociétéTHE NEWLY-MODIFIEDSIMON NEWCOMB AWARDAt the request of National Council, the Awards Committee andthe Halifax Centre have completely revised the rules for theSimon Newcomb Award, the RASC’s national award for exemplarywriting on the topic of astronomy. It was felt by many that theold rules were overly restrictive, contributing to a low numberof eligible submissions. With the new rules in place, the RASCwill have a better opportunity to recognize good writing bySociety members, so members of the Awards Committee hopeto see an increase in nominations for the award.The new rules — printed below and soon to be updatedin the RASC Manual — are self-explanatory, but please note anumber of important changes in some of the key elements: thenew Simon Newcomb Award will be open to all RASC members,whether amateur or professional; proposed recipients must benominated by another member (or members); and the writtenwork must already be published in some form, either in a Societypublication or elsewhere. The last is the most significant change.In view of the announcement of the changes so late in thecalendar year, the deadline for 1998 year is being extended toMarch 31, 1999 (instead of December 31, 1998).Web-surfers may be interested in visiting the SimonNewcomb sites at:gsb-www.uchicago.edu/fac/owen.lamont/research/newcomb.htmlwww-groups.dcs.st and.ac.uk/~history/Mathematicians/Newcomb.htmlThe revised rules are given below. They were passed at the Junemeeting of National Council held in Victoria.The Simon Newcomb AwardThe Simon Newcomb Award is intended to encourage membersof the Royal Astronomical Society of Canada to write on thetopic of astronomy for the Society or the general public, andto recognize the best published works through an annual award.BackgroundThe award is named in honour of the astronomer SimonNewcomb (1835–1909), who was born in Nova Scotia and laterserved for twenty years as Superintendent of the AmericanEphemeris and Nautical Almanac Office at the United StatesNaval Observatory in Washington. The award was created in1978 by the National Council of the RASC on the initiative ofthe RASC Halifax Centre.Who is Eligible?Any member of the Society is eligible for the award. Nominationsmay be submitted by another member, a group of members, oran RASC centre.What Writing is Eligible?An eligible entry should be a recently published piece of writingwith an astronomical theme. This could be one of: a book or aportion of a book; an article in the Journal of the RASC, a centrenewsletter, or another RASC publication; an article in acommercially published magazine; and so on. A series of articlesor a history of exemplary writing would also be consideredeligible.JudgingThe Awards Committee will judge nominations according toseveral criteria, including: originality, literary merit, scientificaccuracy, educational value, and promotion of the Society’sobjectives. The Committee is not bound to make an award ina given year if the nominated works do not meet a suitablecombination of these criteria.Submission of NominationsSend nominations to the Awards Committee (c/o RASC NationalOffice, 136 Dupont Street, Toronto, Ontario, M5R 1V2). To beconsidered for an award in a given year, nominations mustarrive by December 31 st . Letters of nomination must include:(a) the name and address of the nominator; (b) the name, address,and RASC centre affiliation of the nominee (if attached to acentre); (c) the title(s) of the author’s work(s) to be consideredfor distinction; (d) full publication details; and (e) a statementestablishing the suitability of the author’s writing.For an article in a magazine or journal, the publicationdetails should include the journal or magazine name, the volumeand issue numbers, the page range, and the date of publication.For a book, the publication details should include the publisher’sname, the place of publication, and the year of publication.December/décembre 1998 JRASC325
The nominator may be requested to supply a good copyof the nominated work if it is not known to the members ofthe Awards Committee or not readily available.PresentationThe award is a trophy which will be presented at the GeneralAssembly and remains in the hands of the recipient until thefollowing April. A cash prize of $250 will be awarded to therecipient by the RASC.Promotion of the AwardThe Awards Committee will regularly promote the SimonNewcomb Award in the Society’s Journal along with the otherdistinctions of the Society, and will take further action toencourage nominations as necessary.STARFEST “BRING HOME THE BACON” AWARDAt Starfest ’98 on August 22, during the evening program, theNorth York Astronomical Association announced the Starfest“Bring Home The Bacon” Award. The award was inspired by acomment made by Brian Marsden several years ago at a jointmeeting of the Royal Canadian Institute and the Royal AstronomicalSociety of Canada, Toronto Centre. At that meeting, Brianindicated that Canadian Amateurs were not keeping pace withother amateurs around the world in the discovery of asteroidsand other things that go bump in the night. The intent of thenew award is therefore to stimulate observational activityamong Canadian amateur astronomers by providing a cashprize for the next person who makes an astronomical discovery.The Starfest “Bring Home the Bacon” Award will be awardedto the next Canadian amateur astronomer or group of Canadianamateur astronomers to make an astronomical discovery, suchas of a near-Earth asteroid, comet, nova, or supernova. Thediscovery must be announced and authenticated by a recognizedauthority such as the International Astronomical Union.In keeping with the spirit of Starfest, the award will consist of:500 Looniesa pound of back bacona toqueIf you require further information about the award, pleasecontact Andreas Gada at NYAA@interlog.com or write toAndreas Gada, 26 Chryessa Ave., Toronto, Ontario, M6N 4T5.HELP IMPROVE YOUR SOCIETYThe RASC Membership and Promotion (MAP) Committee islooking for input from all members of the Society regardingthe following topics:• What can be done to improve the services supplied tomembers at the national level?• New ideas for advertisements in SkyNews to better promotethe RASC,• The desirability of creating new membership categories (e.g.Family, Educator, Associate, etc.),• Ways to attract and retain more Youth members,• Any new RASC promotional items that would be of interest,• Other issues of concern.Now is the time for members to think about the above itemsto help determine if there is a desire to initiate major changesto the Society. Discuss the topics at Centre council meetingsand with other members, since membership input is crucial tothe process. Please share your thoughts and concerns with usbefore January 31, 1999.If you have ideas on how the RASC can become a better Society,send them to one of the MAP Committee members listed below:Kim HayRR #2Perth Rd Village, OntarioK0K 2L0Email: Kimhay@adan.kingston.netDon Hladiuk (chairman)28 Sunmount Rise SECalgary, AlbertaT2X 2C4Email: Hladiukd@cadvision.comFAX: (403) 256–8985Erich Keser405 Albert AvenueSaskatoon, SaskatchewanS7N 1G2Email: Keser@duke.usask.caCONGRATULATIONS TO…David Levy, who won an Emmy in the award category of“Individual Achievement in a Craft in News & DocumentaryProgramming — Writers.” David shared the award with cowritersMartyn Ives, David Taylor, and Benjamin Wooley forthe Discovery Channel show “Three Minutes to Impact.”Rajiv Gupta, whose RASC Observer’s Calendar 1998 was the“Best Calendar” winner for 1998 in the Ontario Printing andImaging Association’s annual competition.326JRASC December/décembre 1998
An Evaluation of Canon ImageStabilized Binocularsby Chris Baldock (cbaldoc@ibm.net)A Very Brief BackgroundOne of the local camera stores herein London recently loaned me a pairof the new Canon 10 30 ImageStabilization binoculars and I thought thatan independent critique might be of somevalue. Please note that the evaluation isbased strictly on my personal opinion and limited experience.I would be interested in hearing from others, especially regardingadditional tests that might be of interest.On my last two vacations I toted along a pair of Fujinon750 FMTR-SX binoculars. The binoculars were spectacularfor astronomy (or general viewing) when mounted on a tripod,but they were heavy and cumbersome while hiking. Tired armsand shaky images quickly relegated them to the bottom of theknapsack. I vowed that before I went on my next vacation Iwould buy a small, lightweight, high-quality pair of binocularsintended strictly for daytime viewing of wildlife and scenery.Lunchtime trips to a few of the dealers in town provideda good overview of the selection and prices of binoculars thatwould suite my purposes. It came down to a handful of Nikon,Fujinon, Canon, and Swift models in the 7–10 power, 25–40-mm, $200–$400 range. A few final comparisons of each of themodels while standing outside the front of the store and itwould be a done deal, right? Wrong! It was a tough decision.Each was of comparable optical quality (based upon cursorytests), size, weight and (within reason) price. Back inside thestore an off-hand comment about Canon Image Stabilization(IS) binoculars quickly produced a pair of 1030s from behindthe counter. My first reaction was that they were way beyondmy price range, but it would be fun to give them a try. Afterone look through them, all of the other binoculars screamedin unison, “No contest!” The overwhelming abundance ofadditional detail that could be seen in a stabilized image madeit impossible for the others to compete, regardless of the qualityof their optics.It should be said that with the image stabilization featureturned off, the Canon optics were comparable to those of otherbinoculars. Alternatively, they would provide similar imageswith the IS turned on if the other binoculars were mounted ona tripod. Keep in mind the use for which I intended them. Quickviews of scenery, furry critters scampering through the underbrush,or birds soaring overhead while hiking do not easily lendthemselves to use of a tripod. Since it was a bright, sunny daywith good prospects for a clear evening, I asked the proprietorif I could borrow them to run a few tests. Without any hesitationhe said, “Yes!”Image StabilizationDennis di Cicco does a good job of describing image stabilizationin the article titled “Revolutionary New Binoculars” that appearedin the February 1998 issue of Sky & Telescope. I will add a coupleof my own comments.Image stabilization effectively removes the small, rapidvibrations introduced by the hands and arms. Vibrations oflower frequency and larger amplitude are still present, butdampened to the point where they become non-intrusive inthe six-degree field of view. The damping effect introduces aslight delay, or “hesitation” when sweeping, as di Cicco put it.When you first use the binoculars, the feature imparts a visualoddity that the brain cannot quite “put a finger on,” but onceyou realize what it is you get used to it.After using the binoculars for a while, you become accustomedto the steady image and begin to notice slow back-and-forthmovements imparted by your body that the image stabilizationdoes not correct. That might lead you to question if the ISsystem is functioning. Simply take your finger off the buttonand your question will be answered quickly. Instantly the worldreturns to its former “California quake” appearance.There is one aspect of IS that I would like to clear up.Dennis di Cicco stated, “It takes a fraction of a second for thestabilization to kick in.” That is essentially correct, but I noticedthat it might take up to two seconds. I tested it with a secondpair in order to be sure that it was not a defect. It is importantto establish such expectations beforehand for a couple of reasons.First, my heart rate jumped the first time the system engaged,since I feared that I had broken the binoculars, but a brief pausesolidified the image stability completely. Second, when a friendtook a casual glance through the binoculars he said, “So, whatam I looking for?” He had not given the system enough timeto stabilize the image.Daytime TestsThe first set of tests was done during daytime. Pointing thebinoculars at distant, impossible-to-read signs and licenseDecember/décembre 1998 JRASC327
plates proved the true power of stabilization. Text that wasonce a blur became legible. Next, they were tested on sceneryand wildlife. The views were nothing less than spectacular. Iwill not ramble on about everything I looked at and all of thedetail IS brings out. I will ask you this: have you ever seen thereflection in a dove’s eye?One of the most irritating things I find about usingunmounted binoculars is trying to achieve an accurate focuswhile the image is jumping around. With the IS system, focusingbecomes a snap. Focus once as you normally would, then turnon IS and do the fine focusing.Even while fiddling with the dioptric adjustment ring forthe left eye or the centre focus ring, the image is steady. Thatfacilitates quick, precise focusing beyond what can normallybe achieved with regular hand-held binoculars. The value ofthat becomes even more apparent when the binoculars are usedfor astronomy. That last little bit of perfection allows you tosee stars that you would typically think were beyond the graspof a pair of binoculars of the same aperture. Speaking of which...Nighttime TestsA number of tests were done at night from my backyard in themoderately light-polluted skies of London. The limiting visualmagnitude of stars at the zenith was about four to five. Therewas a crescent Moon low in the southwest. A pair of Fujinon750 FMTR-SX’s was used for comparison. Admittedly, it wasnot an accurate or fair comparison for a number of reasons.First, the larger aperture of the Fuji gathered two-and-a-halftimes more light. Not only were the Fuji images brighter, butin the low light levels of dusk the Fuji binoculars blew awaythe Canons. Second, the higher magnification of the Canonsmade it easier to resolve things such as close binary stars. Italso darkened the sky’s background. I have no doubt that theFuji would blow away the Canon if mounted on a tripod, butthe comparison did have some merit as discussed below.The intent of the first star test was to determine the fainteststars that could be seen. Two areas near the zenith were usedas targets — one near Alpha Cygnii (Deneb) and the otherbetween Gamma and Beta Lyrae. With IS turned on there wasno problem seeing all of the stars in the Uranometria 2000.0down to ninth magnitude. While the Fuji presented a muchbrighter image, no additional stars could be seen with the largeraperture. There is one last comment about the stars — theywere sharp right to the edge of the field. The Canon IS binocularsuse a doublet field flattener to reduce field curvature anddistortion. It works. (Recall that the ones that I was using were1030s… can you imagine what the Canon 1545 IS must belike?)The Canon binoculars clearly outperformed the Fujibinoculars in a couple of respects. Close stars that were blurredtogether by vibrations in the Fuji were easily split in the Canon.Albireo was a prime example (and a pretty sight, I might add).Faint, extended objects, such as M57 (the Ring Nebula), werealso visible through the Canon binoculars but not through theFuji binoculars. Obviously the Canon’s views of faint objectscould not compete with a telescope, but it was fun doing aquick jaunt around the sky for some of the brighter Messierobjects — M11 (the Wild Duck Cluster), M31 (the AndromedaGalaxy), M13 (the great globular cluster in Hercules), M8 (theLagoon Nebula), M27 (the Dumbbell Nebula) — and being ableto hold them steady in one’s gaze.Next, both pairs of binoculars were turned on Jupiter,which was rising in the southeast. The Fujinon image was brightand crisp. Three of the moons stood out like jewels to the planet’swest. The Canon IS images were steadier, although somewhatsubdued. It was much easier to hold one’s gaze on the moons,but… what is that? There was a fourth moon just off the planet’swestern limb. Further attempts with the Fuji still did not revealthe fourth moon. Chalk another one up for steady images andhigher magnification!Now it was time to go on to the Moon. What can I say? Itwas the first time I have had a steady, clear view of mountainpeaks greeting the lunar sunrise in a pair of hand-held binoculars.The uncountable craters and deep shadows cast across theplains were as pretty a sight as I have ever seen of the Moonthrough binoculars.One favorite pastime is looking at satellites throughbinoculars as they drift through the star-splashed blacknessof space. It is wonderful way to discover the night sky serendipitously.The only problem is that most of the stars bob and weave zigzagsacross the field of view. With the Canon IS binoculars the stars“float” through the field of view, giving you the feeling that youare drifting through space with the satellites. It is an experiencethat you must see to believe!AFew CaveatsThere are a number of things that should be noted about suchbinoculars:1. There is an LED light on top of the binoculars that turns onwhenever the IS system is activated. Dennis di Cicco mentionsin his article that the light is red and only goes on for a coupleof seconds. On the 1030s the light is green and stays on foras long as you have your finger on the button. (That may be adifference between the three models.) It is important to notethat the light is bright enough to compromise one’s night visionshould one inadvertently look at it.2. The manufacturer warns that air bubbles “may” form in thevari-angle prism if the binoculars are taken to high altitudes,such as may be experienced when flying in a plane. They statethat they usually disappear after a week. Take note of that pointshould you be taking a pair of them to far-off lands to observean eclipse.328JRASC December/décembre 1998
3. There is no tripod thread on the binoculars, although mountingthem on a tripod does seem a little redundant.ConclusionWould I recommend such binoculars for astronomy? No… orshould I say, not strictly for astronomical purposes. Theiraperture is too small to satisfy the average experienced amateurastronomer, but they are fun for casual glances at the night skyif they are all that you have at your disposal. On the other hand,if the performance of the small 1030s is any indication ofwhat the 1545s can do, I know what will be on my Christmaswish list this year.Chris Baldock fell in love with astronomy twenty-nine years ago whenhe spied the rings of Saturn through his brother’s brand-new Tascorefractor on a crisp, clear winter evening. Since then humans havewalked on the Moon, interplanetary probes have visited all of themajor bodies in the solar system, and most of the celestial mysteriesof childhood have been explained with the aid of quantum leaps intechnology. He cannot wait to see what marvels the next Saturnianyear will bring.Choosing an Eyepieceby Gary Angers, Montreal Centre, reprinted from SkywardAt this time of year it seems quite appropriate to writeabout eyepiece selection, since it is getting too cold forfrequent and extended observing sessions and it justso happens that Christmas is around the comer or has justpassed. For some that may mean acquiring an additionaleyepiece, while others may be faced with the decision of whicheyepiece(s) to purchase for a brand new telescope. Selectingan eyepiece is easy, right? Nothing could be further from thetruth.Although most good quality commercially made instrumentsare supplied with one or two eyepieces, they are usually generalpurposeeyepieces that perform well in the medium–low tomedium–high range of magnification. To make better use ofyour instrument the range must be extended to include lowand high powers — especially if your interest lies in viewingrich star fields, splitting double stars, or doing planetary work.Table 1, although far from exhaustive, lists the data forseveral widely used telescopes available on the market today.It is intended as a guide for eyepiece selection and, as such,does not rule out other combinations. The abbreviations referto D = diameter of objective lens (or mirror), FL = distancefrom objective lens to prime focus, and FR ( focal ratio)= FL/D.Magnification values are based on 0.2 D and 2 D for lowand high powers, respectively (for D in inches use 5 D and50 D); the term Eyepiece = the theoretical value required foran eyepiece to achieve the associated magnification values; D p= the size (in mm) of the image of the objective lens formed atthe eyepiece.You may have noticed that the values of D p are constantthroughout. The reason for that is that the average pupil dilatesto 5 mm or 6 mm and contracts to 0.5 mm. A value of D p largerthan a fully dilated pupil results in light being wasted, but alsomakes it easier to line up the eye at the eyepiece. At the otherextreme, a value of D p smaller than 0.5 mm will seldom improvethe image under less than exceptional skies.Choosing an eyepiece is more a function of the telescope’sfocal ratio than of its aperture or focal length. While it is truethat an eyepiece will magnify differently on instruments ofdifferent apertures with similar focal ratios, it is equally truethat the eyepiece will project the exact same value of D p withthese instruments. In a comparison of a 125-mm f/10 and a200-mm f/10 telescope, the table shows that, in order to achievean appropriate value of D p , both must use a 50-mm eyepiecefor low magnifications and a 5-mm eyepiece for high-powerviews. The 200-mm telescope will yield higher magnificationssimply because of its longer focal length. In short, it is the focalratio of the instrument that will help determine the focal lengthof the eyepiece(s).Table 2 proposes a selection of eyepieces based essentiallyon focal ratios. It is important to point out that only small focalratios, or fast instruments, can truly benefit from extremelyshort focal length eyepieces. One of the common problems withdepartment store telescopes is that they usually have f-ratiosbetween f/12 and f/16 and are supplied with a 3-mm or 4-mmeyepiece for maximum magnification. With such a setup itbecomes impossible to see anything useful.A quick example should suffice. Imagine using a 50-mm(2.1-inch) refractor with a 3-mm eyepiece. It is an f/15, whichmeans that the focal length is (15 50 mm) = 750 mm. Themagnifying power is (750 ÷ 3) = 250. The size of the exit pupilwill then be (50 ÷ 250) = 0.2 mm — far too small for even thebest of eyes. With that type of instrument one would be welladvised to consider acquiring no less than an 8-mm eyepiece.The magnification would be reduced to about 90, but at leastDecember/décembre 1998 JRASC329
the telescope would become usable.After selecting the appropriate eyepiece, one more decisionmust be made — what type? There are a multitude of standardeyepiece types available and an even greater number of variationson them. For the time being, I will briefly focus on four types:Kellners, Orthoscopics, Plössls, and Erfles.Kellners are, in some circles, referred to as being the budgetmindedchoice. They are inexpensive and work well, especiallywith longer focal length telescopes. These eyepieces consist ofthree optical elements, and their apparent field of view canreach 40˚–45˚. They are frequently fuzzy around the edge ofthe field and suffer from some chromatic aberration.Orthoscopics are a step up from Kellners in both price andquality. Their four elements correct for chromatic aberrationand can yield a 45˚–50˚ field but with sharper definition aroundthe edges. Orthoscopics are a good choice for high power viewingon a budget.Plössls are increasingly popular with amateurs since theyoffer views that are quite precise at all levels of magnification.Their four-element design typically provides a field of view ofabout 50˚. Plössls are definitely worth considering.Erfles are excellent, especially for precise low-powerobserving. They consist of five optical elements and boast anapparent field of about 65˚, resulting in breathtaking low-powerviews. If that is any indication, Erfles would appear to be thechoice eyepiece for rich field observing.Gary Angers’ interest in astronomy dates from his childhood whenhe used to sneak out of bed to join his father, who loved observinglunar eclipses. He has been an active member of the Montreal Centrefor nine years, holding the positions of Librarian, Vice-President,and President — but not simultaneously! He is currently responsiblefor maintaining the Centre’s web site. His favourite astronomicalbook is Starlight Nights by Leslie Peltier.Table 1Aperture Focal Ratio Focal Length Magnification Eyepiece Exit Pupil(D) (FR) (FL in mm) Min/Max (mm) D p80-mm (3.1-inch) f/11 910 16/160 56/6 5/0.5125-mm (5-inch) f/10 1250 25/250 50/5 5/0.5150-mm (6-inch) f/7 1050 30/300 35/3.5 5/0.5150-mm (6-inch) f/8 1200 30/300 40/4 5/0.5200-mm (8-inch) f/10 2000 40/400 50/5 5/0.5200-mm (8-inch) f/6 1200 40/400 30/3 5/0.5250-mm (10-inch) f/6 1500 50/500 30/3 5/0.5Table 2Focal Ratio Ultra Low Low Medium Highf/6 36-mm 18-mm 9-mm 3-mmf/7 42-mm 20–24-mm 10-mm 4-mmf/8 50-mm 24–26-mm 12-mm 5-mmf/10 56-mm 30-mm 15-mm 6-mmf/11 56-mm 32-mm 16–18-mm 6-mm330JRASC December/décembre 1998
At the EyepieceNavigating the Perseus Archipelagoby Lucian J. Kemble 1 , OFM (luckem@sk.sympatico.ca)One often hears of the “Perseus Cluster” and most oftenthe term refers to the famous Perseus Double Cluster— two lovely open clusters visible to the unaided eyehalfway between Cas and Per. There is another wonderfulPerseus Cluster, however, Abell 426, a cluster of galaxies centredon its brightest member NGC 1275. Since Edwin Hubble’s workin the 1920s and the realization that the so-called “spiral nebulae”are in reality other galaxies — “island universes” — outsideour own system, there has been an explosion of informationabout (including spectacular detailed images of) the countlessexternal galaxies that fill our universe. They may often appearas single, isolated worlds, yet most often they are grouped intosmall-to-larger clusters, super clusters, etc.One such galaxy cluster, appearing like a celestial archipelago,is Abell 426, which lies about 12 m in right ascension (~2° 15´)east of Algol, Per. The brightest member of this tight cluster,about 350 million light years distant, is NGC 1275 located at 3 h19 m .8 and +41° 31´. The Webb Society’s Deep-Sky Observer’sHandbook, pp. 123–132, contains a very thorough explanationof the cluster with accompanying charts and data. (It must benoted, though, that the table of some of the cluster galaxieslisted on p. 127 wrongly lists their right ascension as 1 h instead3 h .) Burnham’s Celestial Handbook, vol. III, pp. 1448–1451, isalso an excellent source of information. Keep in mind that bothpublications are for the epoch 1950.0. One of the finest photosI have ever seen of the cluster is to be found in Timothy Ferris’sGalaxies, p. 150. It shows very well the condensed, inner portionand the long extension to the west, like some celestial chain ofAleutian Islands.From such sources, and from many more that have appearedsince the books were printed, it becomes clear that NGC 1275and its companions are indeed a most unusual collection ofgalaxies. NGC 1275 is at once a strong radio source as well asa powerful X-ray source. Images in red light show a rich systemof filaments extending away from it on all sides, and the galaxy,also known as the radio source Perseus A, may actually be anexample of a collision of two galaxies. Some studies indicatethat the whole inner portion of the Perseus cluster is a generalsource of diffuse radio emission. NGC 1275 itself is often describedin the literature as being a most unusual “irregular” type ofgalaxy. It was that feature and its accessible magnitude of 11.6,within range of my C11, that led me to observe the galaxy and,in subsequent observing sessions, many of its companions, asThe brighter members of galaxy cluster Abell 426 are shown in this 0.5degree field which shows stars to about 15 th magnitude (ECU Chartprepared by Dave Lane).part of an island-hopping journey. In all, I have made drawingsand notes for about 22 individual members of the cluster, manyof which are actually Herschel objects. Depending on whichchart(s), catalogue, or atlas one uses, there is richness enoughfor any size aperture above 8 inches.My notes for the first observation, made with my C11 atCochrane, Alberta, on March 11, 1983, read as follows: “Lookingspecifically for NGC 1275 and noting many galaxies listed inthe NGC 2000.0 Catalogue, I was surprised to find seven galaxiesin the same low power eyepiece field; I had accidentally stumbledon part of the Perseus Cluster without realizing it. One of mygreatest observing thrills. As is occasionally the case, windyconditions actually helped by slight jiggling of the scope.Identification of other galaxies in the field was made with theWebb Society’s Deep-Sky Observer’s Handbook, volume 5.”In the table (see next page), are the data for the clustergalaxies including 22 out of a total of 27 that I have observedsince that memorable night in 1983. Data are taken from theNGC 2000.0 Catalogue and MegaStar. Only the NGC and ICCatalogues were used — there are far more, and fainter, galaxies1 Father Lucian Kemble’s article is a replacement for Alan Whitman’s column this issue.December/décembre 1998 JRASC331
listed in other catalogues, e.g. MGC, UGC, CGCG, etc.As can be noted, all members of Abell 426 listed here arewithin the range of observation — i.e. ~11.5 to 15.5 magnitude— of moderate aperture telescopes. I have located them quiteeasily with my C11, most of them appearing as rather featureless,faint, small, diffuse blobs.An interesting feature of this area of sky, crossing theborder of Perseus and Andromeda, is that the Perseus clusterdiminishes into a long, thinning streak, followed by a fewstragglers, then passes Algol. Before reaching the Andromedaborder, one passes the rich open cluster M34, then moves intoanother wonderful archipelago of clustered islands — thosearound the beautiful, edge-on, giant galaxy NGC 891. I havetraveled the latter chains of island universes, but that is anotherstory. One night soon I shall resume my island voyage and pickup the ones I have missed in the Perseus Archipelago.Meantime, I encourage you to sail among these enchantedisles and to go exploring. Good luck.Like as the waves make towards the pebbled shore,So do our minutes hasten to their end;Each changing place with that which goes before,In sequent toil all forwards do contend.– William Shakespeare, Sonnet LXFather Lucian was born in 1922 on a small farm in southern Alberta.After spending four years during World War II as a radio operator,he entered the Order of Friars Minor — the Franciscans — in 1946.Ordained in 1953 after seven years’ study in philosophy and theology,he has spent almost all of his priestly life in teaching and preaching.A longtime member of the RASC, he works with a C11 on a ByersMount in a shelter at St. Michael’s Retreat, Lumsden, Saskatchewan.His main interest in astronomy is searching out deep-sky objects, ofwhich he has well over five thousand observed, drawn and noted onfile.Galaxy RA (1950) Dec (1950) Mag. Size CommentsNGC 1250 3:15.4 +41:21 14p 2´.7NGC 1257 3:16.4 +41:32 14.6p 1´.6IC 310 3:16.7 +41:20 12.7p 1´.4NGC 1259 3:17.0 +41:21 15.7p 0´.7 (not observed)NGC 1260 3:17.5 +41:24 14.3p 1´.1NGC 1264 3:17.9 +41:31 15.4p 0´.8IC 312 3:18.1 +41:45 14.4p 1´.4 (not observed)NGC 1265 3:18.3 +41:52 12.1p 1´.7NGC 1267 3:18.7 +41:28 14.1p 0´.8NGC 1268 3:18.8 +41:29 14.2p 1´.0NGC 1270 3:19.0 +41:28 13.1p 1´.0NGC 1272 3:19.3 +41:29 11.7p 1´.8NGC 1273 3:19.4 +41:33 13.2p 1´.8IC 1907 3:19.6 +41:35 14.2p 0´.9NGC 1274 3:19.7 +41:33 14.0p 0´.8NGC 1275 3:19.8 +41:31 11.6p 2´.2NGC 1276 3:19.9 +41:33 — 0´.5 (not observed)NGC 1277 3:19.9 +41:34 13.4p 0´.8NGC 1278 3:19.9 +41:34 12.4p 1´.4NGC 1281 3:20.1 +41:38 13.3p 0´.9NGC 1282 3:20.2 +41:22 13.9p 1´.2NGC 1283 3:20.3 +41:24 13.5p 0´.9IC 313 3:21.0 +41:53 15.1p 0´.8 (not observed)IC 316 3:21.3 +41:56 14.9p 1´.2NGC 1293 3:21.6 +41:24 14.5p 0´.8NGC 1294 3:21.7 +41:22 14.3p 1´.0IC 319 3:23.4 +41:24 — 0´.5 (not observed)332JRASC December/décembre 1998
The Light Side of ResearchHome Researchby Orla Aaquist, Keyano College, Fort McMurray (Orla.Aaquist@keyanoc.ab.ca)My VLA observing run last March was a success, andnow I am going to reduce the data at home. We havehome care, home making, home schooling, homebusiness, and now we have home research. I retrieved my datavia FTP the week following my March observing run and storedit safely away on a hard drive at the Space Astronomy Laboratoryat the University of Calgary. Eight hours of data awaited myanalysis, which I planned to tackle during my summer vacation.Summer, however, never lasts as long as I anticipate. In fact,as I write this, summer is over and data reduction has yet tooccur. Another project distracted me.The other project began from an innocent remark madeby Dr. Sun Kwok while I was preparing my observing run. Hementioned that someone had managed to install AIPS on a PC.AIPS is the Astronomical Image Processing System, the softwaregenerally used to process VLA data. Sun thought I might wishto install it on my home computer. After I purchased a newcomputer in May, the seed took root and I discovered Linux(Unix for PCs). After installing Linux seven times, installingAIPS just as many, replacing my video card, reading a very thickbook on Linux, and reading the latest AIPS Cookbook, I wasfinally ready to start my data reduction… and the fall term.Now, every other weekend I boot up my Linux partition,start AIPS, sift through my data, examine my old images, andthink strange thoughts. Then, suddenly I realize, “God! I haven’tprepared any lessons for Monday morning!” Weekends are justnot long enough to start my research motor.Before I became too imbedded in the term, I did manageto scan the data for major problems. They looked good, so Iwas inspired to plunge in and edit out data that were obviouslybad. My plan was to do a trial run through the data and hopethat the unused knowledge and techniques would re-emergefrom the recesses of my brain. After all, it had been ten yearssince I last used the software.Reading through the Cookbook, I read the warning, “Oftenwhen switching source position, the initial scans have slightlyhigh or low flux levels and should be edited out.” While imagingmy fields, I noticed many narrow high and low peaks just beforeand after each source observation. So, of course, I began to editout the offending peaks. After two days of clipping, I discovereda program that would do it automatically. “I’ll use it next time,”I thought calmly.Then began the calibration process. That involved checkingthe phases and amplitudes of the so-called “phase calibrators.”The phase calibrators are point sources near the target object,Often when switching source position, the initial scans have slightly highor low flux levels and should be edited out.and their purpose is to make sure that you know what a pointsource looks like through the instrument. Because of atmosphericturbulence, sources become distorted; but if you know what apoint source looks like, you can correct for the distortion. Neat,eh? The strange thing was, though, I could not find any of myphase calibrators. Do you know how it feels when you suddenlyremember that you were supposed to be at an important meetingtwo days ago? There is no recovery. You cannot get there fromyour current space-time co-ordinates. The event lies outsideyour light cone. You quickly look around for a rotating wormhole,but find none.A sinking feeling washed over me. Had I forgotten toobserve the phase calibrators? The feeling of pure desperationlasted for almost five seconds before I realized that I had justspent the last two days painstakingly flagging the calibratorsas bad data. As quickly as it arrived, the feeling of desperationwas replaced by a wave of pure relief. I unflagged the calibratorsand went to bed. My sleep was surprisingly sound that night.It does not bother me to start over. As a graduate studentI must have started my thesis at least ten times. Now, as ateacher, I start over every year. Why do I tinker with researchwhen I have a full-time job that I love and that does not requireme to do research? Some people spend their entire life doingit. I do it in my basement office late at night with a cat on mylap. I find it exhilarating and satisfying and I do not care whatthe neighbours think. My friends think it strange that I wouldconsider it a vacation to work on data reduction. They couldbe right.Orla Aaquist is the physics instructor at Keyano College in FortMcMurray. His rather varied career has included periods as anundergraduate at the University of Alberta (B.Sc.) and Queen’sUniversity (B.Ed.), a graduate student at the University of Calgary(M.Sc., Ph.D.), a high school teacher of physics and mathematics inToronto, and “telescope instructor” at the Calgary CentennialPlanetarium.December/décembre 1998 JRASC333
Scenic Vistas: Anchor Starby Mark Bratton, Montreal Centre (mbratton@generation.net)As I am an observer, one of my greatest aids has alwaysbeen the anchor star. Such a star is a moderately bright,naked eye object that acts as a guidepost to regions ofthe sky of particular interest. As an example, each of the “corner”stars of the constellation Pegasus are excellent anchor stars.The skies around the stars are rich in deep-sky objects that arefaint and not-so-faint. It is easy to sight on one of the stars andthen push off into the depths in search of hidden treasure. Withan anchor star handy, one can sit down and take a few momentsto do a detailed job on one’s notes, make a sketch, or even havea cup of coffee and consult one’s charts. If the target drifts outof the field of view, it is easy to go back to the anchor star toquickly retrace the star hop that led you to the object of interest.The early winter sky has a fine “anchor star” located justwest of Rigel in Orion. The star is fourth magnitude Nu Eridani( Eri), and pointing your telescope at the star leads you intoa field populated by almost fifty NGC galaxies, many of whichare visible in telescopes with apertures less than 25-cm. Thepayoff begins immediately, for in a low power field one will seethree galaxies immediately north and east of the bright fieldstar. The galaxies, NGC 1618, 1622 and 1625, are remarkablysimilar in size and brightness and they all huddle aroundmagnitude 12.5. NGC 1618 is marginally fainter than the othertwo, but visually quite similar to the galaxy that follows it, NGC1622, in that both display bright cores and are extended inalmost identical position angles. NGC 1625 appeared cigarshapedin my 38-cm reflector with a magnitude 14 star visibleat its northwest tip.Sweeping 1˚.75 southwest from Nu brings us to a tight,though difficult, group of four galaxies. NGC 1600 should beeasy with a small telescope as it shines at magnitude 10.9. Inmy reflector it was a round, patchy glow, growing graduallybrighter to the centre with an irregular, mottled disk. Two othergalaxies, both magnitude 13.8, were visible in the field as smallround objects. NGC 1601 was immediately north of NGC 1600,and NGC 1603 was visible to the east-southeast. A fourth galaxyat magnitude 15.1, NGC 1606, was invisible.Returning to Nu and now moving east-northeast about1˚.5 will bring you to NGC 1637, one of the largest, brightestgalaxies visible in the region. The galaxy appeared as a fat ovalof light with extremities fading gradually into the sky background.The central region appeared bright and oriented NNE-SSW.High magnification revealed a mottled core and two separatecondensations near the centre. One degree immediately northis NGC 1638, a fairly bright, small and condensed galaxy witha bright core. The galaxy is gradually elongated east-west.A little over a degree to the northeast the observer willcome to NGC 1653. At magnitude 12 the galaxy should be visibleThe three galaxies, NGC 1618, 1622 and 1625 are just north of the “anchorstar” Nu Eridani in this 0.5 degree field (ECU Chart prepared by Dave Lane).in a 20-cm reflector. Visually it is quite similar in appearanceto NGC 1638, though the outer regions appear slightly morediffuse. Sweeping 2˚.5 SSE will bring you to magnitude 12.5NGC 1659, an oval, well-defined patch of light oriented ENE-WSW with a bright, elongated core.Less than one degree to the southeast is the fainter NGC1665, an oval patch of light oriented SW-NE and just a littlebrighter to the middle. About 2˚.5 to the northeast is a loosegrouping of a half dozen galaxies, four of which I viewed withmy reflector. NGC 1670 is a small galaxy with diffuse extremitiesand a well-condensed, small and bright core. NGC 1678, whichfollows it, is preceded by a magnitude 10 field star. It is brighterand more conspicuous than NGC 1670. Although it is orientedENE-WSW in photographs, the extremities are rather faint andall that I saw was the bright core that appeared quite round.NGC 1682 and 1684 appear together in a high power field.Although they are nominally the same brightness, NGC 1684is by far the more conspicuous of the two. It is very graduallyextended east-west, and both galaxies have moderately condensedcores. NGC 1682 appears stellar at low magnifications. NGC1700 is a bright galaxy, so bright in fact that I was able to pickit up with my old 20-cm SCT from my light-polluted back yardlocation many years ago. In my telescope the galaxy appearedas a subtle object, though well seen with direct vision. At thecentre was a sharp, stellar nucleus surrounded by a very smooth,well-defined outer envelope. The galaxy appeared very slightlyoval in shape and gradually extended east-west. NGC 1729 liesjust west of a magnitude 10 field star and immediately south334JRASC December/décembre 1998
of one of magnitude 12. It is a diffuse, uncertain patch of light,poorly defined and a little brighter to the middle. It appears tobe very slightly extended almost due north-south.These are but a small sample of the galaxies visible in thefields that surround Nu Eridani. They can be returned to againand again by the patient amateur willing to hitch his telescopeto a starMark Bratton has had a life-long interest in astronomy and firstbecame acquainted with the RASC in November 1966 at the age ofeleven. He did not become a member until twenty-five years later.He is currently the editor of the Montreal Centre’s newsletter Skywardand entering his second term as president of the Centre. He is thesingle parent of a twelve year old boy, Kristopher, and his greatestjoy, besides his son of course, is slowly exploring the skies with a 375-mm reflector from the deck of his small country cottage near Sutton,Québec.TEACHING ASTRONOMY TO NON-SCIENCE MAJORSAt the end of June, 1998, the Astronomical Society of the Pacific (ASP) held a national symposium on teaching astronomy to collegenon-science majors during the Society’s 110 th Annual Meeting. About 150 instructors from a wide range of colleges and universitiesparticipated and all were asked to bring a concise summary of their presentations in handout format. The handouts included coursesyllabi, innovative ways to handle large lecture classes, clever lab exercises, research results on teaching and learning, new usesof the World Wide Web, student project ideas, teaching resource guides, and much more.As a result of strong interest by instructors from around the world who were not able to attend, the ASP has agreed to make availablea package of the 300 pages of symposium handouts. The package is collated, but not bound, with a table of <strong>contents</strong> and anintroduction to the main themes of the symposium.To obtain a set of copies, send a cheque or money order (payable to “ASP”) for US$24.95 if you live in the United States or US$32.95if you live elsewhere. (The price includes postage and handling.) Please note that purchase orders cannot be accepted for this item.Be sure to include your full name and the address to which you wish the order to be shipped. Send payments to:Astronomical Society of the PacificSymposium Handouts Department390 Ashton AvenueSan Francisco, CA 94112U.S.A.December/décembre 1998 JRASC335
Reviews of PublicationsCritiques d’ouvragesAfter the First Three Minutes: The Story of Our Universe,by T. Padmanabhan, pages xiv + 215, 19 cm 25 cm, CambridgeUniversity Press, 1998. Price US$19.95 soft cover. (ISBN 0-521-62972-1)“And now we come to the end of the first three minutes, andnothing else of interest will happen in the history of the universe.”So, reportedly, said physicist and Nobel laureate StevenWeinberg while wrapping up a Harvard lecture on the originsof matter in the Big Bang. The lecture later formed the basisof Weinberg’s 1977 best-selling account of modern cosmology,and his droll remark inspired the book’s catchy title: The FirstThree Minutes.Two decades later The First Three Minutes remains aclassic of popular science literature. Few authors have sincematched Weinberg’s success at elucidating the connectionbetween the macro-world of astronomy and the micro-worldof particle physics, and their convergence at the beginning oftime. So ubiquitous was the book that in 1980 Alan Guth, thena young physicist at Stanford, recalls cramming from it beforea debut of his own inflationary universe theory, for fear “thatI would reveal my status as a greenhorn cosmologist.” Theepisode is recounted in Guth’s 1997 book The InflationaryUniverse.Yet, as acclaimed as The First Three Minutes is by scientistsand non-scientists alike, at its core lies a conceit that shouldbe treated with caution, namely that the entire history of theuniverse is little more than an afterthought in the wake of theprimordial inferno. While the laws of nature were certainly laiddown in the initial moments following the Big Bang — if notsooner — the ways in which those laws have played out overthe last 13 billion years are far from obvious. As the HubbleSpace Telescope and other great observatories are currentlyshowing us, the universe is a dizzyingly rich and complicatedplace. Its history also contains a troublesome gap, revealed asa wall of darkness by telescopes that look ever farther awayinto space in order to see farther back in time. This so-called“dark age” is what separates the smooth, hot plasma universeof the distant past from the slightly more recent, and definitelymore lumpy, universe of the earliest stars and galaxies. Howthe former universe came to be the latter remains one ofcosmology’s outstanding mysteries.In After the First Three Minutes, cosmologist T. Padmanabhanattempts to illuminate the universe’s shadowy depths with anon-mathematical treatment of recent developments in thefield. The book follows a “just the facts” format, in stark contrastto the storytelling style favoured by most writers in this arena.“Ideas and discoveries are more important than people,”Padmanabhan writes in the preface, explaining the book’sdearth of anecdotes and photos. “I hope the clarity of the contentcompensates for the lack of colour.”Regrettably for the reader, it does not. Padmanabhan’scontent is, at times, far from clear, and the arrangement ofmaterial in the book is perplexing. After a brief reconnoiteringof the universe as we now find it, the book launches into areview of subatomic physics that seems unnecessarily dense.The third chapter is a rather detailed history of astronomicalobservation across various wavelengths which, although scatteredwith interesting details, brings the reader no nearer to the book’spurported subject matter. Indeed, in the absence of a morelogical structure, the background knowledge required by thereader to follow the first half of the book is essentially what thetext itself is trying to provide.In a fourth chapter on stellar astrophysics, Padmanabhanmakes at least two factual errors. He lists Polaris as an exampleof a main sequence star, which it is not. And — far moreworrisome — he several times incorrectly defines theChandrasekhar mass of 1.4 solar masses as the limit beyondwhich a neutron star will collapse into a black hole. In fact, itis the upper mass limit for white dwarf stars. Such a fundamentalerror would be unforgivable in a first-year course on astronomy,and it is equally intolerable here.For those who persist, the payoff in After the First ThreeMinutes comes in the second half of the book, particularly inthe lengthy sixth chapter on the formation of structure in theearly universe, clearly the author’s forte. Here the progressionof ideas becomes intelligible and the writing lucid. Padmanabhandoes a good job of explaining the role of hot and cold darkmatter in the formation of “density fluctuations,” the cosmicwatering holes around which ordinary matter gathered in theearly universe. Neither forms of dark matter adequately satisfythe observed distribution of galaxies in space, and Padmanabhandemonstrates why. He then offers a timely discussion on thepotential of a “cosmological constant,” Einstein’s infamousfudge factor, as a way out of the dilemma.Although the book improves dramatically when the authoris in familiar territory, it nowhere approaches the best writingon cosmology available to a general audience. Perhaps it isunfair to hold After the First Three Minutes up to the standardof Weinberg’s popular classic, but the comparison is invited bythe book’s title and more explicitly in Padmanabhan’s suggestionsfor further reading. There, at the very top of his list, is noneother than Weinberg’s The First Three Minutes, which Padmanabhan336JRASC December/décembre 1998
considers “a model for popular science writing.”In cosmology a good model is everything. In science writingit apparently is not enough.Ivan SemeniukIvan Semeniuk is the book review editor of the Journal.Our Evolving Universe, by Malcolm S. Longair, pages xii +185, 23.5cm27cm,Cambridge UniversityPress, 1996. PriceUS$34.95 hard cover(ISBN 0-521-55091-2),US$19.95 soft cover(ISBN 0-521-62975-6).It has been more thantwenty years since Iattended a class inintroductory astronomyas a first year education student at the University of Windsor.My professor at the time was charged with the rather dauntingtask of making exciting and understandable the mysteries ofthe universe to a lecture hall largely filled with non-physicsmajors. Since I was a keen amateur astronomer at the time, itwas not hard to hold my attention. My professor likewise hada personal interest in astronomy and it helped make the coursemuch more engaging than it might otherwise have been. Thebook used for the course was a thick paperback called DynamicAstronomy, by Robert T. Dixon. It was a sweeping survey ofastronomy as it stood in the 1970s, and it served to round outand strengthen my basic astronomical knowledge.In the intervening years I have read many astronomybooks, but most of them have leaned in their content towardsthe more practical aspects of backyard observation and telescopemaking. So it was a definite change of pace to sit down with athoroughly modern treatment like Our Evolving Universe.Reading Malcolm Longair’s work has left me with the feelingthat I now have a well-rounded appreciation of the major issuesconfronting modern astronomy and cosmology.With five chapters totaling 159 pages (not including theglossary, index and picture acknowledgments at the end of thebook), Our Evolving Universe is not a particularly lengthy work.But it is information-dense, and deals crisply with a successionof topics that summarize the state of astronomy and cosmologyat the end of our century.In Chapter One, “The grand design,” Longair delivers abrief summary of some of the major historical events that mademodern astronomy possible. The key nineteenth centurydiscoveries of spectroscopy and astronomical photography, forinstance, enabled the eventual rise of astrophysics as a scientificdiscipline. Longair stresses how our present understanding ofthe universe is possible only though an examination of what isrevealed across the entire electromagnetic spectrum. He alsouses a type of comparative method to portray the size of theuniverse in this chapter, which avoids the need for exceedinglylarge numbers. That is a nice change of pace. However, Longair’srepeated referral to M31 as the “Andromeda Nebula,” seemsquaint and out-of-place.In Chapter Two, “The birth of the stars and the greatcosmic cycle,” Longair deals with the nature of stars and howthey shine. Spectroscopy, combined with the relatively newscience of helioseismology as well as the issue of neutrinos andthe “solar neutrino problem” are discussed in terms of theircontributions to our understanding of stars like the Sun. TheHertzsprung-Russell (H-R) diagram is introduced, and a fairlyextensive treatment of the Orion Complex, including M42 —the Great Nebula in Orion — is given in order to illustratequestions related to star formation. His use of the expression“great cosmic cycle” to describe the life of a star from birth todeath seems a bit overblown, especially when considering whatissues are to come as the book progresses.In “The origin of quasars” the discussion turns to radiogalaxies and the discovery of quasi-stellar radio sources, pulsars,and neutron stars. Einstein’s Special and General Theories ofRelativity are introduced, which lead to an extensive discussionof black holes and the very probable existence of supermassiveblack holes within active galactic nuclei.The mystery of dark matter rears its head in the fourthchapter, “The origin of galaxies”. With no more than ten percent of the universe accounted for as matter visible to us,possible theories as to the nature of dark matter and itsrelationship to “ordinary” matter, are explored.In Chapter Five Longair grapples with the truly big question— the origin of the universe. Here he summarizes ninecosmologically important facts about the universe, the “fourgreat problems” of current Big Bang cosmology, and the needfor a quantum theory of gravity if we are to have any hope ofadvancing our knowledge of the very early universe.Longair ends his final chapter by providing cautiouscommentary on such questions as multiple universes and theultimate fate of the universe. He approaches the issues strictlyas a scientist, and is careful not to cross boundaries into issuesmore appropriately addressed, he insists, by philosophers andtheologians.One is reminded while reading Our Evolving Universe ofhow rapidly advancing technology during this century hasallowed the development of the tools necessary for astronomersto make such significant strides in our knowledge of the universe.The increasingly sophisticated instrumentation and techniquesbeing used in ground-based research, combined with theindispensable capabilities of Earth-orbiting astronomicalsatellites, have helped to define the scope of current astronomy.Moreover, the challenges facing astronomers today will influencethe design of the next generation of astronomical tools.December/décembre 1998 JRASC337
To which audience is Our Evolving Universe aimed? Bookstorebrowsers will perhaps be influenced by the advertising hypeon the back cover that proclaims the work as a non-technicaltreatment for the general reader, student, or professional wantingto understand the key questions of modern astronomy andcosmology. But is it realistic to expect that such a wide-rangingaudience could be satisfied by just this one source?In his book A Brief History of Time, Stephen Hawkingremarked that someone told him that for each equation heintroduced, sales would be cut by one half. He therefore chosenot to have any, other than Albert Einstein’s famous equationE = mc 2 .A Brief History of Timebecame a runaway best seller,and is currently enjoying a tenth anniversary printing. From apurely marketing standpoint, it would seem that Hawking’sdecision was astute.Had he intended Our Evolving Universe to reach a trulygeneral audience, Longair would not have introduced so manytechnical charts, diagrams, and equations that appear throughoutthe book in quite generous supply. Even so, there is nothing inthat regard that should discourage any astronomy enthusiastwith a good grounding in at least high school-level physics ormathematics. Undergraduate physics students will be right athome within its pages. But, for all the so-called “naturalists ofthe night” in search of a good introductory astronomy book,it is probably safe to say that most will look elsewhere for theirreading.The book itself is gorgeously produced and is otherwiseprofusely illustrated with beautiful photos and artwork, mostof which are in colour. Typos are few and far between, and minorin nature. Combined with Longair’s obvious passion for hissubject as revealed in a very enthusiastic style of writing, OurEvolving Universe is all the while written with a discipline andbrevity that keeps the reader moving. It is definitely worth alook.Randy GroundwaterRandy Groundwater has been an active amateur astronomerfor thirty years, and has been a member of the RASC’s WindsorCentre since 1977. He may be reached by Email at ragroun@ibm.net.Carl Sagan’s Universe, edited by YervantTerzian and Elizabeth Bilson, pages xiii +282, 17.7 cm25.3 cm, Cambridge UniversityPress, 1997. Price US$59.95 hard cover(ISBN 0-521-57286 X), US$22.95 soft cover(0-521-57603-2).Nowhere on the cover of Carl Sagan’s Universedoes it mention that it is a collection ofspeeches taken from a symposium in October 1994. It wouldhave been fair warning.The symposium was organized by Cornell University tocelebrate Carl Sagan’s sixtieth birthday. Of the twenty-fivespeakers, twenty-two have been included in the book. It isrounded out with a lecture delivered by Sagan himself at thesymposium, and an address given by Frank Rhodes, the presidentemeritus of Cornell, at a banquet afterwards.The speeches have all been lightly edited. Sometimes itseems the only changes made were to replace “next slide” with“Figure 9-3.” The light editing allows the colours of the originaltalks to shine though. The enthusiasm and knowledge of thebetter speakers come out clearly; those who were stiff or confusingon the stage remain so on paper. Luckily, the former far outnumberthe latter.The book, like the symposium, is divided into four sections:Planetary Exploration; Life in the Cosmos; Science Education;and Science, Environment, and Public Policy. Planetary Explorationcomes off as the most dated, because of the spectacular progressin the planetary sciences that the last four years have brought.But that is not entirely a bad thing. The reader is left with asnapshot of scientific thinking at the time and a strong urgeto find out what happened next. There is a strange impetus toknowing that you can immediately discover just how the hopesso vividly described by the speakers turned out. The speakersof the Life in the Cosmos section take a more historical approach,and the debates of the other two sections remain evergreen sothey suffer less from the four-year lag.The individual chapters in each section range over thebreadth of Sagan’s interests. Rather than simply lauding Sagan,for which he probably would not have sat still, they each discussa field he affected during his life. Unless the reader is as greata polymath as Sagan, there will be many chapters revealinginteresting new topics and new points of view.While the level of quality in the book is generally high,several outstanding chapters deserve mention. Bruce Murraygives a clear and well-illustrated talk on the search for life onMars. Paul Horowitz takes us inside SETI for a fun and enthusiasticlook at its history. Kip Thorne discusses the possibilities andimpossibilities of using wormholes for time travel. Jon Lomberglavishly illustrates the past and future of science art. GeorgiArbatov’s engaging chapter on nuclear proliferation anddisarmament is given new resonance by the recent demonstrationsin India and Pakistan. Joan Campbell gives us the view fromthe other side of the divide between science and religion. Finally,Sagan’s own chapter is a vivid illustration of just why he deservesa two-day symposium in his honour.While the chapters comprising Carl Sagan’s Universe standon their own strengths, together they are synergistic. AlthoughSagan appears rarely as a main character in the talks, his influenceis always felt. As a whole, the book presents a portrait of one ofthe last of the great generalists, a man who cared about peopleas much as he did about ideas. It serves as a call to try one’s bestto live up to Sagan’s standard: to learn more about a field outsideone’s own, to speak out when one’s knowledge may be of help,to build bridges between cultures and disciplines, or to simplybring more heart to one’s research, teaching and service.William Jacobs338JRASC December/décembre 1998
William Jacobs is a science journalist and graduate student atBoston University.Einstein’s Mirror, by Tony Hey andPatrick Walters, pages xii + 291, 19cm24.6 cm, Cambridge UniversityPress, 1997. Price US$69.95 hard cover(ISBN 0-521-43504-8), US$27.95 softcover (ISBN 0-521-43532-3).My first thoughts when I first satdown to read Einstein’s Mirror weresomething like, “Okay, anotherpopularization of relativity that isbound to leave the reader disappointed in the end.” I thoughtthat because it is pretty much impossible, in my opinion, tounderstand relativity without doing some math.I was wrong. Hey and Walters’s book did not disappointme because they include a bit of math in the Appendix andtheir physical explanations of the principles of relativity, especiallyspecial relativity, are very well done. I was particularly impressedby their explanation that E = mc 2 arises from a considerationof conservation of momentum. The explanation was muchclearer than some that I have seen in college texts.Hey and Walters use stories about the starship Enterpriseof Star Trek fame to illustrate many of the principles of specialrelativity as they might appear in the day-to-day life of starshippeople. In chapter one there is a story about trying to outrunphoton torpedoes (which happen to travel at the speed of light)to illustrate the relativistic velocity addition formula. However,when it comes time to work out the details (the math!) in chapterfour, the authors resort to more traditional stories about trainsin a world where the speed of light is very slow. A train is alsoemployed in chapter five to explain relativistic mass increase.But the explanation of E = mc 2 that I like so much is donecompletely on the Enterprise. As is to be expected, the Enterpriseis also used in the famous story about the astronaut and hertwin sister who stays behind on Earth. They explain that thetraveling twin feels forces when she turns around so that sheis not physically equivalent to her sister back on Earth. In otherwords, although Hey and Walters do not introduce the conceptof inertial frames, the Earthbound sister is confined to aninertial frame while the traveling sister is not.The explanation of the ideas behind general relativity isdone well also, in chapter nine. I am especially impressed withthe inclusion of Einstein’s field equations for general relativity,in a box on page 189. Novices, beware of the terminology here.The field equations are written as E 8 GT , which looksc 4like a single equation but is a shorthand for sixteen equations,ten of them independent, that are obtained by substituting thenumbers 0, 1, 2, and 3 into the double subscripts and . Ofcourse, you cannot understand general relativity just by lookingat the field equations. You have to know that E is a functionof the metric tensor g via combinations of contractions ofthe Riemann-Christoffel curvature tensor, etc., etc. Hey andWalters discuss the “metric” of space time and say that it isrelated to E , but that is as far as they go. It is better than mostpopularizations of relativity, but does not go as far as one ofmy favourite childhood books called The Nature of the Universeby Clive Kilmister, published by Thames and Hudson, London,1971. However, Kilmister writes in a harsher style than do Heyand Walters, and I must admit that I did not fully understandeverything in Kilmister’s book when I was 12.The authors claim that their book is aimed at final-yearstudents at high school, general readers with an interest inscience, and undergraduates in science subjects. I think thatyounger people would also find the book accessible, especiallythose comfortable with their algebra. In other words, the bookshould be accessible to a large number of RASC members.Hey and Walters present their ideas in an historical narrativethat is liberally spiced with small facts about the personal livesof the scientists involved. For example, we learn that GeorgeFitzgerald flew experimental gliders while wearing his top hatand that Hermann Minkowski died of appendicitis. The historicalnarrative covers a lot of ground, including the history of electricity,thermodynamics, and, extensively, atomic physics. As withmost historical accounts of science, this one might be subtitled“A brief look at the lives of some geniuses in physics.” There iseven a famous person index on pages 288 and 289. The biographiesof the people listed are very interesting, and I must say that Iam in awe of the likes of Richard Feynman, who at the age of22 was a group leader for the Manhattan Project. Historicalaccounts that focus on big names in science are pretty standard,and, given a short amount of space, are perhaps the best wayof presenting the history. Of course, true life history happensthrough contributions from everyone, not just the most famous.The historical narrative in Einstein’s Mirror takes a fairlysubstantial sidetrack first in chapter six, with an account ofthe history of atomic physics, and then in chapter seven, whichrecounts the development of the atomic bomb. Chapter sevenis actually a substantial sidetrack because, while E = mc 2 explainswhere atomic energy ultimately comes from, the discovery ofatomic energy was made in the laboratory and is not the resultof a theoretical prediction of relativity. Nevertheless, theoryand-experimentare always a chicken-and-egg proposition, andI enjoyed reading the story.In the end, that is what Hey and Walters have — a story.A story about what relativity is and how it is relevant to ourlives. They have told a story about how a modern theory ofspace and time has been added to the foundation of science.It is a story worth reading, especially if you want a not-so-dryintroduction to the ideas of relativity theory that borrows fromhistory and science fiction to explain ideas in science.Gordon E. SartyDecember/décembre 1998 JRASC339
Gordon E. Sarty is a medical imaging researcher in Saskatoon.He would like everyone to remember that straight lines in spacetimediagrams represent inertial frames and that straight linescannot be changed into crooked ones.An Introduction to RadioAstronomy, by Bernard F. Burkeand Francis Graham-Smith, pagesix + 294; 17.5cm25cm, CambridgeUniversity Press, Cambridge, 1997.Price US$32.95 soft cover. (ISBN 0-521-55604-X)The authors of An Introduction toRadio Astronomy state their intentionclearly. “The plan of the book istwofold,” they write. “We hope thatthe scope and impact of radio astronomy observations will beshown in the astrophysical discussion, and at the same timewe intend to give a brief but comprehensive treatment of theelegant methods that have developed.” Their double-barreledobjective is an ambitious one, and hard to accomplish in 294pages.Where this book succeeds best is in its wide coverage ofradio astronomical observational phenomena. It introducesand explains in some detail a broad range of radio-observablephenomena, including: the galactic synchrotron and thermalradiation, supernova remnants, the Galaxy’s spiral structure,interstellar and circumstellar masers, radio stars, pulsars, radiogalaxies and quasars, jets, superluminal motion, gravitationallensing, and the cosmic microwave background. The book alsointroduces and explains many technical aspects of radioastronomy, such as the principles of aperture synthesis anddigital autocorrelation spectrometers, but because of the brevityof the treatment it is somewhat less successful in these areas.Five of the sixteen chapters deal with the techniques ofradio astronomy, from the principles of radiometry andinterferometry (including Very Long Baseline Interferometry,or VLBI) to aperture synthesis and image improvement usingself-calibration, CLEAN, and the Maximum Entropy Method.It is this reviewer’s opinion that those chapters do not communicateto the non-radio-astronomer as well as, for example, RadioAstronomy by Kraus, or Interferometry and Synthesis in RadioAstronomy by Thompson, Moran, and Swenson.The book is explicitly intended for advanced readers.According to the authors, “In addition to the astronomy graduatestudent and those professionally committed to radio astronomy,there is a wider audience for whom this book is intended: theinterested astronomers from outside the field who want to beinformed of the principle ideas current in radio astronomy, andmay even be thinking of carrying out radio observations thatwould complement other work in progress.”In keeping with the stated objectives, some “practical”concerns of radio observers are highlighted. One example is adiscussion on the choice of calibration sources for phase, flux,and polarization in the section entitled “Calibration ofinterferometer data.” A very practical concern is the fact thataperture synthesis telescopes, which are widely used for highresolution imaging, are generally blind to much of the structureof extended objects. Thus, it becomes important for the observerto augment aperture synthesis telescope data with data froma large single-dish telescope before analyzing his or her images.The coarser Fourier structural components of the object arenot obtained from the interferometers comprising synthesistelescopes, and must be obtained elsewhere. In fact, the imageof the supernova remnant IC 443 shown as figure 9.11 is anunintentional example, since the large-scale structure of IC443 is mostly absent in the image. The authors mention theproblem in a single sentence in chapter ten, but they do notgive such a practical concern any emphasis.There are few production errors in the book. A minor flawis that Appendices 1, 2, and 3 are referred to throughout thetext as Appendices A, B, and C. Most illustrations are excellent,but there are exceptions. Figure 15.4 is referred to frequentlyin the algebra-heavy section on gravitational lensing, yet noneof the quantities used in the equations are indicated in thediagram. Figure 9.8 is too small to be legible, and two diagrams,figure 10.10(c) and a 5 GHz map of the jet in 3C 390.3, aremissing.The authors are both highly respected radio astronomersof great experience. For example, it was Graham-Smith’smeasurement of the position of Cygnus A in 1951 by radiointerferometry that permitted its optical identification. Hislater work on pulsars, including two books, is highly regarded.Similarly, Burke was co-discoverer in 1955 of the decametricradio bursts emanating from Jupiter, and has contributed manyyears’ work in VLBI, including VLBI from space.The authors raise an interesting point in the preface,connected with the steady advance of radio astronomy towardhigher frequencies, when they write: “…it is no longer clearwhere radio astronomy stops and infrared astronomy begins.”They propose the definition that “radio astronomy is the studyof the universe by observing electromagnetic radiation after ithas been coherently amplified” and suggest that preservationof the phase information is the mark of radio astronomy.Interestingly, true separated-element aperture synthesis at the830 nm wavelength has now been achieved by the radio astronomygroup at Cambridge University (J. E. Baldwin et al., Astron.Astrophys., 306, L13, 1996). The spectroscopic binary Capellawas imaged with 0.02 arcsecond resolution, clearly showingthe binary components and their orbital motion. Aperturesynthesis was achieved without coherent amplification, butthe phase information was preserved by phase-closure techniquesdeveloped for synthesis radio telescopes. Radio astronomytechniques are indeed being employed at the edge of the visualband.For both astrophysical and technical topics, the book gives340JRASC December/décembre 1998
excellent bibliographical references. The authors have tried toprovide “recent, comprehensive references to the extent thatthey are available.” In that they have succeeded very well. Insummary, the book is a valuable addition to the literature, andit is definitely a bargain at the price.David Routledge is a professor of electrical engineering at theUniversity of Alberta. He is an avid user of the synthesis radiotelescope at the Dominion Radio Astrophysical Observatory,and his graduate students have contributed to its technicalenhancement for several years.David RoutledgeAstrocrypticby Curt Nason, Halifax CentreHERE ARE THE ANSWERS TO LAST ISSUE’S ASTROCRYPTIC PUZZLEM E S S I E R D I R A CI O R O I A AN I M B I B R A N D O NU M D E L I CT H E M I C R O S C O P EEU TRG A M M A B U R S T SPU IAL I M B D A R K E N I N GO A R N M S OS K Y H I G H A T A U RS O V A N A AL Y R A E M O N O C L EDecember/décembre 1998 JRASC341
Index to Volume 92, 1998TitlesAbstracts of Papers Presented at the 1997 CASCA AnnualMeeting Held in Edmonton, June 14-18, 1997, Feb., 22Abstracts of Papers Presented at the 1998 CASCA AnnualMeeting Held in Québec, May 19-22, 1998, Dec., 310Abstracts of Papers Presented at the 1998 RASC General AssemblyHeld at Pearson College in Victoria, June 19-21, 1998, Oct., 258A Perseid Meteor Spectrum, Jirí Borovicka and Edward P. Majden,Jun., 153A Possible Increase in Mid-Latitude Sightings of NoctilucentClouds, Mark S. Zalcik, Aug., 197A Search for Helium Spectrum Variables, Paul Wiegert and R.F. Garrison, Jun., 134A Search for the Parent Cluster of the Cepheid SU Cygni, DavidG. Turner, Mansur A. Ibrahimov, Georgi I. Mandushev,Leonid N. Berdnikov and Andrew J. Horsford, Jun., 145Cosmic Magnetism in Fifteen Easy Steps, Jacques P. Vallée, Apr., 83Impact Cratering Through Geological Time, Eugene M. Shoemaker,Dec., 297L’atmosphère riche en hélium des naines blanches de type DB,Alain Beauchamp, Jun., 126Looking Down and Looking Up: Common Viewpoints ofArchaeology and Astronomy, Michael Attas, Oct., 244Meteor Spectroscopy with Inexpensive Holographic Gratings,Edward P. Majden, Apr., 91Observations of Mars During its 1996-97 Opposition, RichardW. Schmude, Jr., Aug., 190On Mithraic Tauroctony, F. Graham Millar, Feb., 34Tracking a Fireball from Eyewitness Accounts with Referenceto the West Coast Event of 1995 December 22, Jeremy B.Tatum, Apr., 78Sudbury Impact Structure Modeling With High ResolutionSeismic Refraction Survey Results, W. M. Moon and L. X.Jiao, Oct., 250AuthorsAaquist, Orla, The Light Side of Research: The Mystery of K 3-35, Feb., 52The Light Side of Research: The Ecstasy and Agony ofResearch, Jun., 160The Light Side of Research: Terminal Astronomy, Aug., 211The Light Side of Research: Home Research, Dec., 333Almond, Bill and the Planning Committee, Book Your Space for‘98: An Invitation to the 1998 Victoria General Assembly,Feb., 41Angers, Gary, Choosing an Eyepiece, Dec., 329Attas, Michael, Looking Down and Looking Up: CommonViewpoints Of Archeology and Astronomy, Oct., 244Attwood, Randy, President’s Corner, Aug., 171President’s Corner, Oct., 223Auclair, Raymond, Solar Eclipse 1999 in France, Oct., 263Baldock, Chris, An Evaluation of Canon Image StabilizedBinoculars, Dec., 327Batten, Alan H., Our Changing Views of the Solar Neighbourhood,Oct., 231Beauchamp, Alain, L’atmosphère riche en hélium des nainesblanches de type DB, Jun., 126Borovicka, Jirí and Edward P. Majden, A Perseid Meteor Spectrum,Jun., 153Bratton, Mark, Scenic Vistas: Trompe l’oeil, Feb., 46Scenic Vistas: The NGC 5353 Group, Apr., 102Scenic Vistas: How Low Can You Go?, Jun., 157Scenic Vistas: Clusters on a String, Aug., 203Scenic Vistas: The Pisces Group, Oct., 270Scenic Vistas: Anchor Star, Dec., 334Broderick, Bill, Lightwaves: Ten Things a Light PollutionCommittee Can Do, Feb., 44Cameron, Tom, The Night Sky for Dummies, Jun., 162Chapman, David M. F., Reflections: Chinese New Year andGroundhog Day - Ancient Calendar Days, Feb., 20Reflections: Sundials: Tempus Fugit and Caveat Emptor,Apr., 75Reflections: Chicken Little, Big Time, Jun., 122Reflections: 140 Years of Comet Photography, Aug., 186Reflections: Lazy Nature, Oct., 241Reflections: Dark Mornings, Dec., 293Clark, R. A., The Wilkinson Memorial Observatory, Dec., 288Conselice, Christopher J., Sketches of Jupiter During its CollisionWith Comet Shoemaker-Levy 9, Oct., 238Foot, David K, Eclipse Philately: Aruba 1998, Oct., 228George, Doug, President’s Corner, Feb., 2President’s Corner, Apr., 59President’s Corner, Jun., 106Gibbons, Clive, Test Report: The Questar 3.5 Inch, Jun., 120Gupta, Rajiv, Astrophotography in the Digital Age, Aug., 176Hall, Cathy, How to Have Fun at Astronomy Day, Oct., 265Hawley, Glenn, Carnival Eclipse, Jun., 116Hill, Roger, Capturing the Surface of the Moon on Video, Aug., 184Howell, John, A Lifetime of Stargazing, Apr., 66Hube, Douglas P., Astrophysics at the University of Alberta,Feb., 12Huziak, Richard, Saskatoon’s New Sleaford Observatory, Feb., 10Jeffrey, Dale, Robert Burnham Jr. - Gone But Not Forgotten,Feb., 18Kelly, Patrick, From the Associate Editor, Feb., 3From the Associate Editor, Aug., 170Kemble, Fr. Lucian J., Focal Plane: Reflections on Fog Reflections,Apr., 62At The Eyepiece: Navigating the Perseus Archipelago, Dec., 331Keser, Erich and Sandy Ferguson, Saskatchewan Summer Star342JRASC December/décembre 1998
Party 1998, Apr., 103Lee, David and Dave Lane, Photo Gallery from the Victoria GA,Aug., 207Locke, Jack, The Beginning of the Dominion Radio AstrophysicalObservatory, Jun., 112Majden, Edward P., Meteor Spectroscopy with InexpensiveHolographic Gratings, Apr., 91McCausland, Phil., Starfest for the First Time, Dec., 290Millar, F. Graham, On the Mithraic Tauroctony, Feb., 34Moon, W. M. and L. X. Jiao, Sudbury Impact Structure ModelingWith High Resolution Seismic Refraction Survey Results,Oct., 250O’Neil, Joseph, Focal Plane: Digital Imaging has Gone Too Far,Feb., 4An Insider’s Look at the Binocular Industry, Aug., 213Percy, John R., Astronomy in the Pan-Canadian Science Project,Feb., 38Percy, John R. and Janet A. Mattei, Variable Stars in YourClassroom, Dec., 322Reid, B. Cameron, The Composite Observational - TheoreticalHR Diagram, Feb., 36Sage, Leslie J., Second Light: Looking Halfway Back to the BigBang., Feb., 19Second Light: Fuzzy Young Galaxies, Apr., 73Second Light: The Baseball Model of Neutron Star Spins.,Jun., 124Second Light: Breaking Up Asteroids, Aug., 188Second Light: Searching for Other Planets, Oct., 242Second Light: Counting Molecules in Galaxies, Dec., 295Sarty, Gordon E., The Twin Paradox, Apr., 93Schmude, Richard W., Jr., Observations of Mars During its 1996-97 Opposition, Aug., 190Shoemaker, Eugene M., Impact Cratering Through GeologicTime, Dec., 297Smith, Walter George, Poetry About the Planets, Apr., 71Stairs, Winston, A “Class” Experience in Astronomy Education,Aug., 201Tatum, Jeremy B., Tracking a Fireball from Eyewitness Accountswith Reference to the West Coast Event of 1995 December22, Apr., 78Turner, David G., Mansur A. Ibrahimov, Georgi I. Manduschev,Leonid N. Berdnikov and Andrew Horsford, A Search forthe Parent Cluster of the Cepheid SU Cygni, Jun., 145Turner, David, From the Editor, Apr., 58From the Editor, Jun., 107From the Editor, Oct., 222From the Editor, Dec., 278Vallée, Jacques P., Cosmic Magnetism in Fifteen Easy Steps,Apr., 83Wallace, Tony, How To Stay Warm at a Cold Eyepiece, Dec., 284Whitehorne, Mary Lou, Starlab Update from Nova Scotia, Apr., 100Whitman, Alan, At The Eyepiece: March Challenges, Feb., 48At The Eyepiece: Capturing the Heart of Virgo, Apr., 99At The Eyepiece: Eclipse-Chasing Perfection - The Caribbean,Jun., 158At The Eyepiece: Five Planetaries, from Small-scope-easyto Alberta-tough, Aug., 205At The Eyepiece: Galaxies - A Matter of Subtle Contrast,Oct., 268Wiegert, Paul and R. F. Garrison, A Search for Helium SpectrumVariables, Jun., 134Zalcik, Mark S., A Possible Increase in Mid-Latitude Sightingsof Noctilucent Clouds?, Aug., 197DepartmentsAcross The RASC:An Evaluation of Canon Image Stabilized Binoculars, Dec., 327An Insider’s Look at the Binocular Industry, Aug., 213Book Your Space for ‘98: An Invitation to the 1998 VictoriaGeneral Assembly, Feb., 41Choosing an Eyepiece, Dec., 329How to Have Fun at Astronomy Day, Oct., 265Lightwaves: Ten Things a Light Pollution Committee Can Do,Feb., 44Night Skies for Dummies, The, Jun., 162Photo Gallery from the Victoria GA, Aug., 207Saskatchewan Summer Star Party 1998, Apr., 103Scenic Vistas: Trompe l’oeil, Feb., 46Scenic Vistas: The NGC 5353 Group, Apr., 102Scenic Vistas: How Long Can You Go?, Jun., 157Scenic Vistas: Clusters on a String, Aug., 203Scenic Vistas: The Pisces Group, Oct., 270Scenic Vistas: Anchor Star, Dec., 334Society News, Apr., 96, Oct., 260, Dec., 325Solar Eclipse 1999 in France, Oct., 263Starlab Update from Nova Scotia, Apr., 100Columns:Ask Gazer, Feb., 47At The Eyepiece: March Challenges, Feb., 48At The Eyepiece: Capturing the Heart of Virgo, Apr., 99At The Eyepiece: Eclipse-Chasing Perfection - The Caribbean,Jun., 158At The Eyepiece: Five Planetaries, from Small-scope-easy toAlberta-tough, Aug., 205At The Eyepiece: Galaxies - A Matter of Subtle Contrast, Oct., 268At The Eyepiece: Navigating the Perseus Archipelago, Dec., 331Light Side of Research: The Mystery of K 3-35, The, Feb., 52Light Side of Research: The Ecstasy and Agony of Research,The, Jun., 160Light Side of Research: Terminal Astronomy, The, Aug., 211Light Side of Research: Home Research, The, Dec., 333Reflections: Chinese New Year and Groundhog Day - AncientCalendar Days, Feb., 20Reflections: Sundials: Tempus Fugit and Caveat Emptor, Apr., 75Reflections: Chicken Little, Big Time, Jun., 122December/décembre 1998 JRASC343
Reflections: 140 Years of Comet Photography, Aug., 186Reflections: Lazy Nature, Oct., 241Reflections: Dark Mornings, Dec., 293Second Light: Looking Halfway Back to the Big Bang, Feb., 19Second Light: Fuzzy Young Galaxies, Apr., 73Second Light: The Baseball Model of Neutron Star Spins, Jun., 124Second Light: Breaking Up Asteroids, Aug., 188Second Light: Searching for Other Planets, Oct., 242Second Light: Counting Molecules in Galaxies, Dec., 295Correspondence: Apr., 60, Jun., 111, Aug., 172, Oct., 224Education Notes:A “Class” Experience in Astronomy Education, Aug., 201Astronomy in the Pan-Canadian Science Project, Feb., 38Composite Observational-Theoretical HR Diagram, The, Feb., 36Twin Paradox, The, Apr., 93Variable Stars in Your Classroom, Dec., 322Feature Articles:A Lifetime of Stargazing, Apr., 66Astrophysics at the University of Alberta, Feb., 12Astrophotography in the Digital Age, Aug., 176Beginning of the Dominion Radio Astrophysical Observatory,The, Jun., 112Capturing the Surface of the Moon on Video, Jun., 184Carnival Eclipse, Jun., 116Eclipse Philately: Aruba 1998, Oct., 228How To Stay Warm at a Cold Eyepiece, Dec., 284Our Changing View of the Solar Neighbourhood, Oct., 231Poetry About the Planets, Apr., 71Robert Burnham Jr., - Gone But Not Forgotten, Feb., 18Saskatoon’s New Sleaford Observatory, Feb., 10Sketches of Jupiter During its Collision With Comet Shoemaker-Levy 9, Oct., 238Starfest for the First Time, Dec., 290Test Report: The Questar 3.5 Inch, 120Wilkinson Memorial Observatory, The, Dec., 288Focal Plane:Digital Imaging Has Gone Too Far, Feb., 4Reflections on Fog Reflections, Apr., 62From the Associate Editor: Feb., 3, Aug., 170From the Editor: Apr., 58, Jun., 107, Oct., 222, Dec., 278From the Past: Feb., 17, Apr., 76, Jun., 114, Aug., 183, Oct., 237,Dec., 281News Notes: Feb., 6, Apr., 63, Jun., 108, Aug., 173, Oct., 225,Dec., 279Obituaries: B. Franklin Shinn (1911-1997), Feb., 56President’s Corner: Feb., 2, Apr., 59, Jun., 106, Aug., 171, Oct., 223Questions and Answers: Feb., 40, Apr., 64, Dec., 282Research Papers: see TitlesReviews of Publications:After the First Three Minutes: The Story of Our Universe, by T.Padnamabhan, Dec., 336An Introduction to Radio Astronomy, by Bernard F. Burke andFrancis Graham-Smith, Dec., 340Atlas of Galactic Neutral Hydrogen, by Dap Hartmann and W.B. Burton, Oct., 274Atlas of Venus, by Peter Cattermole and Patrick Moore, Jun., 167Calendrical Calculations, by Nachum Dershowitz and EdwardM. Reingold, Aug., 216Cambridge Illustrated History of Astronomy, The, edited byMichael Hoskin, Jun., 166Carl Sagan’s Universe, edited by Yervant Terzian and ElizabethBilson, Dec., 338Eight Easy Observing Projects, by David Cortner and Nancy L.Hendrickson, Aug., 219Einstein’s Mirror, by Tony Hey and Patrick Walters, Dec., 339Explorers of the Southern Sky: A History of Australian Astronomy,by Raymond Haynes, Roslynn Haynes, David Malin andRichard McGee, Oct., 272Galileo: Decisive Innovator, by Michael Sharrat, Jun., 165Historical Eclipses and Earth’s Rotation, by F. Richard Stephenson,Aug., 219Instrumentation for Large Telescopes, edited by J. M. RodriguezEspinosa, A. Herre, and F. Sanchez, Oct., 273Measurement of Starlight: Two Centuries of AstronomicalPhotometry, The, by J. B. Hearnshaw, Oct., 271Observing For The Fun Of It, by Melanie Melton, Aug., 219Our Evolving Universe, by Malcolm S. Longair, Dec., 337Prisons of Light: Black Holes, by Kitty Ferguson, Aug., 215Radio Astronomy Projects, by William P. Lonc, Oct., 273Star that Astonished the World, The, by Ernest L. Martin, Feb., 54Stars and Their Spectra: an Introduction to the Spectral Sequence,by James B. Kaler, Jun., 164Victorian Telescope Makers: The Lives and Letters of Thomasand Howard Grubb, by I. S. Glass, Aug., 218Yerkes Observatory, 1892-1950: The Birth, Near Death, andResurrection of a Scientific Research Institution, by DonaldE. Osterbrock, Aug., 217344JRASC December/décembre 1998
THE ROYAL ASTRONOMICAL SOCIETY OF CANADANATIONAL OFFICERS AND COUNCIL FOR 1998-99/CONSEIL ET ADMINISTRATEURS NATIONAUXHonorary PresidentPresident1st Vice-President2nd Vice-PresidentSecretaryTreasurerRecorderLibrarianPast PresidentsEditor of JournalAssociate Editor of JournalEditor of Observer’s HandbookEditor of Beginner’s Observing GuideJack Locke, Ph.D., OttawaRandy Attwood, TorontoRobert Garrison, Ph.D., TorontoRajiv Gupta, Ph.D., VancouverRaymond Auclair, Unattached MemberMichael S. F. Watson, Unattached memberPeter Jedicke, LondonAndrew Oakes, B.A., M.A., Unattached MemberDouglas P. George, M. Eng. B.A.Sc., Ottawa and Douglas P. Hube, Ph.D., EdmontonDavid G. Turner, Ph.D., HalifaxPat Kelly, M.Sc., HalifaxRoy L. Bishop, Ph.D., HalifaxLeo Enright, KingstonExecutive Secretary Bonnie Bird, M.L.Sc., 136 Dupont Street, Toronto, ON, M5R 1V2 (Telephone: 416-924-7973)Calgaryc/o Calgary Science Centre, P. O. Box 2100, Station “M”, Loc #73,Calgary, AB, T2P 2M5Edmontonc/o Edmonton Space & Sciences Centre, 11211 - 142 St.,Edmonton, AB, T5M 4A1HalifaxP. O. Box 31011, Halifax, NS, B3K 5T9HamiltonP. O. Box 1223, Waterdown, ON, LOR 2HOKingstonP. O. Box 1793, Kingston, ON, K7L 5J6Kitchener-Waterlooc/o J. Brunton, 123 Grand River Street N., Paris, ON, N3L 2M4LondonP. O. Box 842, Station B, London, ON, N6A 4Z3MontréalP. O. Box 1752, Station B, Montréal, QC, H3B 3L3CENTRE ADDRESSES/ADRESSES DES CENTRESQuébec2000, boul. Montmorency, Québec, QC, G1J 5E7ReginaP. O. Box 20014, Cornwall Centre, Regina, SK, S4P 4J7St. John’sc/o 206 Frecker Drive, St. John’s, NF, A1E 5H9Sarniac/o Alice Lester, P.O. Box 394, Wyoming, ON, NON 1T0SaskatoonP. O. Box 317, RPO University, Saskatoon, SK, S7N 4J8Thunder Bayc/o 135 Hogarth Street, Thunder Bay, ON, P7A 7H1Torontoc/o Ontario Science Centre, 770 Don Mills Road, Don Mills, ON,M3C 1T3Vancouverc/o Gordon Southam Observatory, 1100 Chesnut Street, Vancouver, BC,V6J 3J9Centre Francophone de MontréalC. P. 206, Station St-Michel, Montréal, QC, H2A 3L9NiagaraP. O. Box 4040, St. Catherines, ON, L2R 7S3OkanaganP. O. Box 20119 TCM, Kelowna, BC, V1Y 9H2OttawaP. O. Box 33012, 1974 Baseline Road, Nepean, ON, K2C OEOVictoriac/o Bill Almond, 354 Benhomer Drive, Victoria, BC, V9C 2C6Windsorc/o Frank J. Shepley, 344 South Middle Road, R.R. # 2, Maidstone, ON,NOR 1K0WinnipegP.O. Box 2694, Winnipeg, MB R3C 4B3
Publications fromThe Royal Astronomical Society of CanadaObserver’s Calendar — 1999NEW LARGER SIZE!This calendar was created by members of the RASC. All photographs weretaken by amateur astronomers using ordinary camera lenses and smalltelescopes and represent a wide spectrum of objects. An informative captionaccompanies every photograph. This year all of the photos are in full colour.It is designed with the observer in mind and contains comprehensiveastronomical data such as daily Moon rise and set times, significant lunar andplanetary conjunctions, eclipses, and meteor showers. (designed andproduced by Rajiv Gupta)Price: $14 (includes taxes, postage and handling)The Beginner’s Observing GuideThis guide is for anyone with little or no experience in observing the night sky. Large, easy to readstar maps are provided to acquaint the reader with the constellations and bright stars. Basicinformation on observing the moon, planets and eclipses through the year 2000 is provided. Thereis also a special section to help Scouts, Cubs, Guides and Brownies achieve their respectiveastronomy badges.Written by Leo Enright (160 pages of information in a soft-cover book with a spiral binding whichallows the book to lie flat).Price: $12 (includes taxes, postage and handling)Looking Up:A History of the Royal Astronomical Society of CanadaPublished to commemorate the 125th anniversary of the first meeting of theToronto Astronomical Club, “Looking Up — A History of the RASC” is anexcellent overall history of Canada’s national astronomy organization. Thebook was written by R. Peter Broughton, a Past President and expert on thehistory of astronomy in Canada. Histories on each of the centres across thecountry are included as well as dozens of biographical sketches of the manypeople who have volunteered their time and skills to the Society. (hardcover with cloth binding, 300 pages with 150 b&w illustrations)Price: $43 (includes taxes, postage and handling)*** Special Discount — Looking Up and the BOG — $50 — All three publications — $60 ***Send cheque or money order to: RASC, 136 Dupont St., Toronto, ON, M5R 1V2 CanadaPlease allow 6-8 weeks for delivery. Orders outside Canada please remit in U.S. Funds.Major credit cards accepted. Call the National Office toll-free at 1-888-924-7272 to place your order.(copies of these publications may also be available directly from your local Centre)