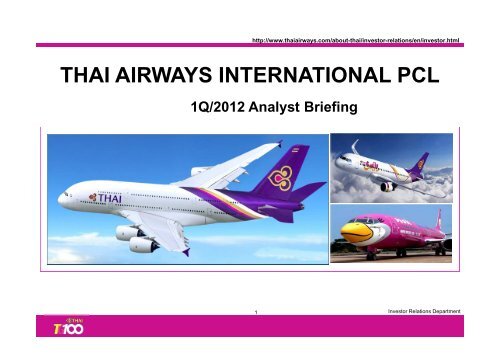
THAI AIRWAYS INTERNATIONAL PCL
1Q12 Analyst briefing Presentation (May 17, 2012) - Thai Airways
1Q12 Analyst briefing Presentation (May 17, 2012) - Thai Airways
Create successful ePaper yourself
Turn your PDF publications into a flip-book with our unique Google optimized e-Paper software.
http://www.thaiairways.com/about-thai/investor-relations/en/investor.html<strong>THAI</strong> <strong>AIRWAYS</strong> <strong>INTERNATIONAL</strong> <strong>PCL</strong>1Q/2012 Analyst Briefing1 Investor Relations Department
DISCLAIMERThe information contained herein is intended to represent the Company’s operating andfinancial position at a given point in time and may also contain forward looking informationwhich only reflects expectations based on the prevailing geo-political, economic andnon-controllable factors. Such information has been obtained from sources believed to bemost reliable and the means in analyzing and preparation of such information for disclosureare based on approved practices and principles in the investment industry. The views arebased on assumptions subject to various risks and uncertainties and no assurance is madeas to whether such future events will occur, that projections will be achieved, or that theassumptions here-in are correct. Consequently no assurance is made as to the accuracy orcompleteness of information presented in this document.This document should not be construed as an investment guide or as an offer orsolicitation of an offer to buy or sell the Company’s equity shares.2 Investor Relations Department
2012 Snapshot3 Investor Relations Department
Snap ShotJan-Mar 2012MTHBUSD mn.Equivalent% Change (YoY)Assets 281,397 9,080 -3.5%Total Revenue 54,505 1,759 + 5.1%Net Profit (Include FX) 3,645 118 489.8%2012 MAR.%ChangeYoYJAN.– MAR.%ChangeYoYPassenger carried (Million) 1.76 +7.3% 5.1 +4.1%Million Revenue Passenger Kilometers(MRPK)5,256 +7.5% 15,605 +4.9%Freight carried (tons) 60,380 -5.2% 170,625 -1.2%Million Revenue Freight Ton Kilometers(MRFTK)233 -10.7% 652 -6.6%2012 March*Excluding 6 B 737-400 leased to Nok Air# of Aircraft 88*Destinations Served 69Countries Served 354 Investor Relations Department
Operation SummaryMARCHUnits 2012 2011 %ChangeJANUARY-MARCH2012 2011 %ChangePassenger ProductionMASK 6,703 6,710 -0.1% 19,953 19,571 +1.9%Passenger TrafficMRPK 5,256 4,890 +7.5% 15,605 14,881 +4.9%Cabin Factor% 78.4 72.9 +7.6% 78.2 76.0 +2.9%Passenger carriedMillion 1.7 1.6 +7.1% 5.1 4.9 +4.4%Passenger Yield*THB/km 2.67 2.70 -1.1% 2.75 2.77 -0.7%Freight ProductionMADTK 389 439 -11.4% 1,195 1,233 -3.1%Freight TrafficMRFTK 233 261 -10.7% 652 698 -6.6%Freight Factor% 59.9 59.5 0.7% 54.6 56.6 -3.6%Freight carriedTons 60,380 63,694 -5.2% 170,625 172,749 -1.2%Freight Yield*THB/km 9.95 9.85 +1.0% 10.02 9.71 +3.2%Avg. Fuel Price**USD/BBL 140.6 129.0 +9.0% 137.2 120.5 +13.8%Note : * Yield includes fuel surcharge** Price into plane5 Investor Relations Department
Financial Performance(Consolidated)6 Investor Relations Department
Q1 2012 Financial Results – Other AirlinesKingfisher plans to pay January salaries from May 9 2012Worried over the possibility of its employees dragging the airline management to the Labour court over non-payment ofsalaries, Kingfisher Airline Chairman Vijya Mallya has "assured" the staff of paying their January salaries from Wednesdayonwards, airline sources said today."Mallya said in his May 5 communication to the employees that the airline will start remitting January salaries from May 9onwards," sources told PTI quoting from the e-mail message.American Airline to Look for MergerMay 12, 2012AMR, parent of American Airlines, bowed to pressure on Friday from its unsecured creditors, including its largest unions,and said it would explore merger options while it is still in bankruptcy.Jet Airways Q1 2012 Financial ResultsLoss before Tax of INR 1,568 Million (USD 35.1 Million) vs Profit of INR 35 Million (USD 0.8 Million) for Q1 FY11Taiwan’s Three Leading Airline Firms Suffer Losses in Q1May 14, 2012Taipei, May 14, 2012 (CENS)--Impacted by soaring oil prices, Taiwan’s three leading airline companies, namely, China Airlines,EVA Airways, and TransAsia Airways, all suffered losses in the first quarter of this year.7
Q1 2012 Financial Results – Other AirlinesKorean Air reported a net loss of W81B in 1Q12Korean Air reported a net loss of W81B in 1Q12 vs W125B/W190B net profit in 4Q11/1Q11. The results were boosted byW405B F/X gains. Excluding these and other one-offs, recurring loss was much higher at W444B, 326% higher y/y and 7%higher q/q. Consolidated net loss (IFRS) was W67B in 1Q12 vs net profit of W146B in 4Q11 and W271B in 1Q11. Consolidatedrecurring loss was W192B (excl. F/X gains and asset disposal loss) vs W81B recurring profit in 1Q11.Lufthansa reported net loss of 397 Million Euro in 1Q12Lufthansa reported net loss of 397 Million Euro and-0.87 Euro of Earning per Share in 1Q12.Air France reported net loss of 368 Million Euro in 1Q12Air France reported net loss of 368 Million Euro and-1.25 Euro of Earning per Share in 1Q12.Singapore Airlines Report Net Loss for 4QSIA reported a net loss of $38.2 million ($30.5 million) in January-March versus a net profit of S$171 million a year earlier.8
Financial PerformancePerformance Summary (Q1’2011 & Q1’2012)<strong>THAI</strong> and its subsidiary(Units : MTHB) Q1'2011 Q1'2012Total Revenue 51,851 54,505Total Expense (51,097) (50,637)Foreign currency exchange (Loss) (3,358) 527Financial Cost (1,309) (1,481)Profit before income tax expense 754 3,868Net tax expense (income) (121) (200)Net profits (loss) 618 3,6459 Investor Relations Department
Financial PerformanceEBIT, EBITDA and Net Profit (Q1’2011 & Q1’2012)Units : MTHBFactors Impacting Q1’2012 Results• Recovery in travel demand• Relatively healthy contribution fromBU’s & related businesses• Slightly higher ASK but greater RPKgrowth• Fuel cost 16% higher than last year• Greater production capacityEBIT EBITDA NET PROFIT NET PROFIT(Exclude FX& tax impact)• US & European economic slowdown• Low ticket price from last yearpromotions10 Investor Relations Department
Financial PerformanceOperating / Total Revenue (Q1’2011 & Q1’2012)Operating RevenueTotal RevenueUnits : MTHB60,00040,0001207062,1356,7512043876,5001192,319223RevenuePassengerFreightMail% Change % to Tot. Rev.7.21 82.48- 3.7211.938.91 0.4120,00041,93544,957Other activitiesInterest income8.63 4.250.22 0.22Other income0.71 0.710Q1'2011Q1'2012Total Income5.12 100.00Passenger Freight Mail Other activities Interest income Other income*Excludes Interest & Other income- Operating revenue Q1’2011 = 51,025 MTHB- Operating revenue Q1’2012 = 53,999 MTHBTotal revenue Q1’2011 = 51,851 MTHBTotal revenue Q1’2012 = 54,505 MTHB11 Investor Relations Department
Operating / Total Expense (Q1’2011 & Q1’2012)Financial PerformanceUnits : MTHB60,000Operating ExpenseTotal Expense% Change % ofExpense YoY Tot. Exp.45,00030,0001,4364,7952,4941,3472,2205,091343137061,1855,1472,9771,4662,3525,111Personnel expense - 8.33 14.01Fuel and oil 16.08 40.14Flight service expense 0.40 10.09Inventories and supplies 5.93 4.6515,00017,51020,326Crew expense 8.80 2.8907,739 7,094Q1'2011Q1'2012Maintenance/overhual 19.35 5.88Depreciation/amortisation 7.33 10.16Personnel Fuel and Oil Flight Service ExpenseInventory&Supply Crew Expense Aircraft MaintenanceDepreciation Lease of a/c Other** Excludes FX, Impairment losses andShare of profit of investments by the equity method- Operating expense Q1’2011 = 46,065 MTHB- Operating expense Q1’2012 = 49,365 MTHBAircraft lease/spare parts - 17.462.34Other expense - 41.189.84Total Expense - 0.90 100.00Total expense Q1’2011 = 51,097 MTHBTotal expense Q1’2012 = 50,637 MTHB12 Investor Relations Department
Financial PerformanceRatios – Q1’2011 & Q1/2012Ratios units Q1’2011 Q1’2012Earnings Per Share (THB) 0.28 1.67Book Value per Share (THB) 28.94 30.64Price / Book Value (Times) 1.3 0.84P/E Ratio (Times) 133.2 16.0Return on Total Assets (%) 0.2 1.3Return on Total Equity (%) 0.8 5.6EBIT (MTHB) 4,960 4,633EBITDA (MTHB) 9,755 9,780EBITDAR (MTHB) 11,191 10,966IBD to Equity (Times) 1.9 2.1Net IBD to Equity* (Times) 1.88 1.86Debt Service Coverage** (Times) 1.5 1.8Interest Coverage (Times) 7.5 6.6EBITDA Margin (%) 19.1 18.1Operating Profit Margin (%) 9.7 8.6Net Profit Margin (%) 1.2 6.7Cash to Total Revenue (%) - 16.7* (Interest Bearing Debt – Cash and Cash Equivalent) / Equity** EBITDAR – TAX / Interest + Rent + Long Term Debt Repayment - Refinance13 Investor Relations Department
Financial Performance<strong>THAI</strong> and Nok Air14 Investor Relations Department
<strong>THAI</strong>Jan-Mar %Nok AirJan-Mar %2011 2012 ChangeRevenue (MTHB) 1,446 1,877 29.79Expense (MTHB) 1,364 1,868 36.89Passenger Production (MASK) 513 679 32.47Passenger Traffic (MRPK) 429 561 30.77Cabin Factor (%) 83.7 82.6 (1.29)No. of Passenger (Million persons) 0.74 0.99 33.60Flight Hours (Hours) 6,739 8,931 32.53Average of Aircraft Utilization (Hour/Aircraft/Day) 6.9 6.9 -Financial Performance2011 2012 ChangeRevenue (MTHB) 50,405 52,628 4.41Expense (MTHB) 49,733 48,769 (1.94)Passenger Production (MASK) 19,571 19,953 1.95Passenger Traffic (MRPK) 15,881 15,605 (1.74)Cabin Factor (%) 76 78 2.89Freight Production (MADTK) 1,233 1,196 (3.00)Freight Traffic (MRFTK) 698 651 (6.73)Freight Load Factor (%) 56.6 54.4 (3.89)No. of Passenger (Million persons) 4.92 5.16 4.88Flight Hours (Hours) 86,722 89,175 2.83Average of Aircraft Utilization (Hours/Aircraft/Day) 11.7 12.4 5.9815 Investor Relations Department
Updated Strategies16 Investor Relations Department
Current FleetCurrent Fleet: 88 Aircraft42% of O 15% of OL 43% of FLO=Owned OL=Operating lease FL=Financial lease(Note: Approximately)Aircraft TypeA300-600Exc. 2 of ATR-724 of 737-400leased to NokFirst Business Premium Economy Economy Total36R1 4 N.A. 46 N.A. 201 2473452 5 N.A. 28 N.A. 232 260A340-500 3452 4 N.A. 60 42 113 215 1 O, 3 FLA340-600 3461 6 8 60 N.A. 199 267 6 FLA330-3003302 12 N.A. 42 N.A. 263 3053303 11 N.A. 36 N.A. 263 299B737-400 7341 5 N.A. 12 N.A. 137 149 2 FL, 3 OLB747-4007442 6 14 50 N.A. 325 3897443 10 10 40 N.A. 325 375B777-200 7723 8 N.A. 30 N.A. 279 309 6 O, 2 OLB777-200ER 77E1 6 N.A. 30 N.A. 262 292 6 FLB777-300Version# ofAircraft# of Seat7732 5 N.A. 34 N.A. 330 3647732 TKE 1 N.A. 34 N.A. 325 359Financial MethodB777-300ER 7739 5 8 30 N.A. 274 312 5 OLTotal 88 40 532 42 3,528 4,142 37 O, 38 FL, 13 OL6 FL(Note: N.A.. = Not available)17 Investor Relations Department9 O10 O, 10 FL ,3 OL11 O, 5 FL
Aircraft UtilizationAircraft UtilizationHours / Day / Aircraft13.012.012.011.711.611.010.0Jan Feb Mar Apr May Jun Jul Aug Sep Oct Nov Dec2009 2010 2011 201218 Investor Relations Department
Aircraft Delivery PlanNEW A/CDELIVERY2012 2013 2014 2015 2016 2017 TOTALA380-8003 (FL)(SEP/NOV/DEC)3 (FL)(JAN/SEP/OCT)- - - - 6B777-300ER2 (OL)(AUG/OCT)6 (OL)(MAR/APR/JUN/JUL/AUG/OCT)3 (FL) 3 (FL) - - 14A330-3003 (FL)(FEB/SEP/OCT)2 (FL)(JAN/APR)- - - - 5A350-900 - - - -2 (FL) I2 (OL) R2 (FL) I6 (OL) R12B787-9 - - - - - 2 (OL) 2B787-8 - - 4 (OL) 2 (OL) - - 6A320 (Thai Smile)4 (OL)(JUN/AUG(2)/SEP)2 (OL)(JAN/MAR)2 (FL) 3 (FL) - - 11TOTAL 12 13 9 8 4 10 56Note : OL = Operating leas / FL = Financial leaseI = Intercontinental / R = Regional19 Investor Relations Department
Phase Out PlanPHASE-OUT PLAN 2012 2013 2014 2015 2016 2017 TOTALB747-400 2 2 - - 2 2 8B777-300ER(Jet Airways)- 5 - - - - 5A340-500 4 - - - - - 4B777-200 - - - - - 4 4A330-300 - - 2 4 - 2 8A300-600 2 4 5 - - - 11B737-400 3* 1*+2 2 1 - - 9ATR-72 - 2* - - - - 2TOTAL 11 16 9 5 2 8 51Note : *Return from Nok Air20 Investor Relations Department
Fleet Strategy Through 20172011 2012 2013 2014 2015 2016 2017 TOTAL# of Aircraft 89 93 97 102 105 107 109Total Seats in operation 26,691 28,313 29,272 29,784 30,525 31,119 31,859Seat Growth 5.8% 6.1% 3.4% 5.0% 2.5% 1.9% 2.4% 3.9%AgeFleet Age*12.011.010.310.09.38.9 9.18.68.48.06.04.02.00.02011 2012 2013 2014 2015 2016 2017*Note: Count at end of each yearExclude aircraft leased to NOK AIR21 Investor Relations Department
B747-400 to be Converted to Freighter1 st Freighter has launched on April 12, 2012 between 3 continents9 Cities100 tons / flightAsia: Bangkok: Taipei: Tokyo: Hyderabad: Shennai: DelhiEurope: Frankfurt: AmsterdamAustralia: Sydney22 Investor Relations Department
Upgrades and Retrofit Schedule# of Aircraft First Business EconomyTentative CompletionB747-400No. 7-126 All have been completedB747-400No. 13-186 DEC. 2011 - OCT. 2012B777-200No. 1-88 FEB. – DEC. 2012 One has been completed23 Investor Relations Department
World Route Network<strong>THAI</strong>’s Route NetworkRoute(as MAR. 12)TotalInternationalCountries 35Cities 59Freq./Week ~ 58024 Investor Relations Department
Domestic Route Network<strong>THAI</strong>’s Route NetworkMAE HONG SONCHIANG RAICHIANG MAIUDON THANIPHITSANULOKKHON KAENNAKHON PHANOMRoute(as MAR. 12)DomesticBURIRAMUBON RATCHATHANICities 10Freq./Week ~ 280BANGKOK<strong>THAI</strong>Nok Air (Code Share)SAMUISURAT THANIPHUKETKRABIHAT YAI25 Investor Relations Department
Statistic on e-ServiceTicket Sales Via InternetCheck-in via Internet%14.0012.0010.008.006.004.0011.4411.028.778.898.698.588.768.207.78 7.778.037.637.327.266.767.795.8 5.97 6.015.696.035.16 5.315.344.8 4.98 5.004.684.514.26 4.154.153.55 3.34 3.813.253.633.28%8.007.006.005.004.003.002.007.025.473.751.786.985.353.651.875.463.661.975.934.102.155.664.092.316.154.632.676.234.862.86.54.902.866.575.083.266.55.163.366.715.363.457.495.954.012.000.00Year 2009 Year 2010 Year 2011 Year 20121.00Year 2009 Year 2010 Year 2011 Year 20120.00Jan Feb Mar Apr May Jun Jul Aug Sep Oct Nov Dec Jan Feb Mar Apr May Jun Jul Aug Sep Oct Nov Dec26 Investor Relations Department
Statistic on e-ServiceCheck-in via Mobile(http://m.thaiairways.com)# of PAX7,0006,3616,0005,0004,0003,3103,0883,812 3,8115,4375,1693,353 3,4723,0002,309 2,321 2,3682,0001,136 1,300 1,8131,00057 201 373 294499 4070Jul-10Aug-10Sep-10Oct-10Nov-10Dec-10Jan-11Feb-11Mar-11Apr-11May-11Jun-11Jul-11Aug-11Sep-11Oct-11Nov-11Dec-11Jan-12Feb-12Mar-1227 Investor Relations Department
20016012080400Rising Fuel CostPrice of Jet Fuel (USD/BBL)(Singapore Spot Price)Iran still a hot potato140 USD/BBL(MAR. 12)7% Higher YoYJan-07Mar-07May-07Jul-07Sep-07Nov-07Jan-08Mar-08May-08Jul-08Sep-08Nov-08Jan-09Mar-09May-09Jul-09Sep-09Nov-09Jan-10Mar-10May-10Jul-10Sep-10Nov-10Jan-11Mar-11May-11Jul-11Sep-11Nov-11Jan-12Mar-1228 Investor Relations DepartmentJul-06Sep-06Nov-06Jan-06Mar-06May-06
Proactive Fuel Hedging Benefit29 Investor Relations Department29
Fuel ManagementHedging combined with fuel surcharge greatly mitigates fuel price fluctuation riskMonthly fuel hedging 2008-2011 - % of consumption by monthJan-08Feb-08Mar-08Apr-08May-08Jun-08Jul-08Aug-08Sep-08Oct-08Nov-08Dec-08Jan-09Feb-09Mar-09Apr-09May-09Jun-09Jul-09Aug-09Sep-09Oct-09Nov-09Dec-09Jan-10Feb-10Mar-10Apr-10May-10Jun-10Jul-10Aug-10Sep-10Oct-10Nov-10Dec-10Jan-11Feb-11Mar-11Apr-11May-11Jun-11Jul-11Aug-11Sep-11Oct-11Nov-11Dec-11Jan-12Feb-12Mar-12Apr-12May-12Jun-12Jul-12Aug-12Sep-12Oct-12Nov-12Dec-12Jan-13Feb-13Mar-130%0%0%0%3% 17%38%41%44%44%49%35%27%20%23%3%3%7%13%3%3%3%13%17%20%27%30%44%44%44%47%47%47%69%69%69%69%69%69%51%51%51%50%50%56%80%80%80%80%80%80%73%76%79%83%83%83%86%86%86%80%80%80%30 Investor Relations Department
Estimated Cost ReductionThe company is rigorously controlling and reducing expenses to achievefull efficiency and sustainabilityCost Reduction Approach1. Implemented personnel cost reduction(EMM resolution)Estimated Cost Reduction(MTHB)2,026.352. Estimated personnel cost reduction under negotiation 189.963. Estimated cost reduction from strategic initiatives 2,076.204. Estimated cost reduction from DO’s additional measures 400.00Total estimated cost reduction 4,692.51Note: Excluded estimated cost reduction from some projects that are specified as percentage31 Investor Relations Department
Strategic Opportunities and Key ChallengesThe AEC is likely to drive increased demand for air transport as a result oftrade liberalization and greater mobility of skilled laborChanges in regulatory framework as a result ofASEAN Economic Community (AEC)Implications for <strong>THAI</strong>Liberalization of trade in products & services,investment, labour mobility, and greaterharmonization of rules and regulationsTariff reduction to 0% for AEC member countriesIncreased foreign ownership limits to 70% forASEAN investors- four priority sectors earmarked for suchliberalization in 2010 include ICT, tourism,healthcare, and air transport, with logisticsin 2013 and the rest to follow in 2015Greater mobility of the professional workforce tosupport the liberalization of trade in servicesOpportunities+ Growth potential for airline operators+ Higher air passenger demand and traffic asa result of greater labor mobility+ Increase in air freight demand due to tradeliberalization and tariff reductionsThreats-Greater competitive intensity due toincrease in foreign ownership limits andASEAN open skies policy-Potentially skilled labor shortage andincrease in personnel costsSource: ASEAN; Company data and analysis32 Investor Relations Department
<strong>THAI</strong> Smile – A New Chapter<strong>THAI</strong> Smile’s first flight will commence on July 7, 2012Fly SMART withTicket Sale: April 27, 2012Light PremiumBRANDPositioning Differentiation Character ValueAffordableLightPremiumGood PriceHigh ValueTrendyFriendlyWorthyReliableEnjoyableValuable33 Investor Relations Department
<strong>THAI</strong> Smile Fleet Plan & Routes Network# of aircraftBrand new narrow body aircraft2012201346Fleet Plan(2012F-2018F)20148<strong>THAI</strong> Smile base at BKK,operates in domestic and regional secondaryroutes and synchronize with TG network.Macau201520162017201811111111TPI Summer 2012*EFFECTIVE FREQUENCY DestinationChiang MaiJUL 2012 14 Flights/ week Bangkok- Macau V.V.AUG 2012 28 Flights / week Bangkok - Krabi V.V.AUG 2012 7 Flights / week Bangkok- Phuket V.V.BangkokAUG 2012 7 Flights / week Bangkok -Chiang Mai V.V.PhuketSuratthaniKrabiAUG 2012 7 Flights / week Chiang Mai - Phuket V.VSEP 2012 14 Flights / week Bangkok - Suratthani V.V.SEP 2012 14 Flights / week Bangkok - Chiang Mai V.V.* Effective : March 25-October 27 ,201234 Investor Relations Department
Nok Air Routes NetworkNok Air base at DMK,operates only domestic point-to-pointMae Hong SonChiangmaiTG’s Proportion of Shareholdingincreased from 39% to 49%Mae SotNanLoeiPhitsanulokUdon ThaniSakon NakhonNakon PhanomBuri RamRoi EtUbon RatchathaniBangkokDMKSurat ThaniPhuketNakon Si ThammaratTrangHat YaiNarathiwat35 Investor Relations Department
Updated Strategies36 Investor Relations Department
Foreign Currency Exposure (As of Mar 2012)RevenueExpense SurplusOutstanding Borrowingsor Deficit Before Swap After SwapAmount % Amount % Amount Amount % Amount %USD BASED 19,201 37 29,135 66 - 9,934 1,240 1 1,240 1USD 4,951 27,328Others (1) 14,250 1,807EUR BASED 15,883 30 3,369 8 12,514 47,460 33 47,460 33EUR 4,658 1,715Others (2) 11,225 1,654Financial PerformanceUnit : MTHBJPY 5,202 10 1,259 3 3,943 9,499 7 14,310 10THB 11,918 23 8,541 23 3,377 86,993 60 81,852 56TOTAL 52,204 100.00 42,304 100.00 9,900 145,192 100 144,862 100Revenue Expense OutstandingUSD BASED EUR BASED JPY THB37 Investor Relations Department
TG continued to be net long Euro & Yen(MTHB)Financial Performance15,000USD EUR JPY THB12,282 12,51410,0005,0003,5333,9433,3771,55202010 2011-5,000-10,000-7,448-9,934-15,000Jan – Mar 2011Jan – Mar 201238 Investor Relations Department
Financial PerformanceProportion of Fixed and Float(As of MAR. 2012)Before SwapAfter SwapPercentage of TOTAL(TOTAL = 145,191 MTHB)Percentage of TOTAL(TOTAL = 144,861 MTHB)Cost of funding = 3.68% Cost of funding = 3.83%39 Investor Relations Department
Financial PerformanceProportion of Total BorrowingBefore Swap(As of MAR. 2012)After SwapMedium Term Note0.9%Debenture22.2%Medium Term Note0.9%Debenture19.5%Financial Lease39.2%Term Loan37.8%Financial Lease40.6%Term Loan38.9%Percentage of Total(Total of on Balance Sheet = 145,191 MTHB)Percentage of Total(Total of on Balance Sheet = 144,861 MTHB)40 Investor Relations Department
Operating Statistics(’000)Passengers CarriedQ1/12 = 5.2 million (Increased 4.8% YoY)7,000Year 2010Year 2011Year 20125,0005,1673,6624,4144,833 4,9234,2014,7714,5025,1613,0001,000Q1'10 Q2'10 Q3'10 Q4'10 Q1'11 Q2'11 Q3'11 Q4'11 Q1'12Freight CarriedQ1/12 = 170,625 tons (Decreased 1.2% YoY)(Tons)190,000160,000166,155Year 2010 Year 2011 Year 2012179,329 180,341188,109172,749 174,570175,708168,199 170,625130,000100,000Q1'10 Q2'10 Q3'10 Q4'10 Q1'11 Q2'11 Q3'11 Q4'11 Q1'1241 Investor Relations Department
PassengerASKRPKC/F42 Investor Relations DepartmentJan-1082.0Feb-10Mar-10Apr-10May-10Jun-10Jul-10Aug-10Sep-10Oct-10Nov-10Dec-10Jan-11Feb-11Mar-11Apr-11May-11Jun-11Jul-11Aug-11Sep-11Oct-11Nov-11Dec-11Jan-12Feb-12Mar-1282.378.872.156.765.376.374.673.174.371.875.377.877.673.071.861.965.777.274.869.965.761.068.177.379.078.4(Million)8,0006,0004,0002,000-Operating StatisticsYear 2010 Year 2011Year 2012(%)100.080.060.040.020.0-YoY (Month) YoY (Quarter)QoQ (Quarter)Mar'12 Mar'11 YoY% Q1'12 Q1'11 YoY% Q1'12 Q4'11 QoQ%MASK 6,703 6,710 - 0.1 19,953 19,571 2.0 19,953 19,953 -MRPK 5,256 4,890 7.5 15,605 14,881 4.9 15,605 12,968 20.3Cabin factor% 78.4 72.9 7.6 78.2 76.0 2.9 78.2 65.0 20.3
43 Investor Relations DepartmentJan-1054.4Feb-10Mar-10Apr-10May-10Jun-10Jul-10Aug-10Sep-10Oct-10Nov-10Dec-10Jan-11Feb-11Mar-11Apr-11May-11Jun-11Jul-11Aug-11Sep-11Oct-11Nov-11Dec-11Jan-12Feb-12Mar-1260.563.962.466.965.061.360.462.262.560.857.953.756.660.158.057.857.755.154.256.156.355.254.349.754.759.8(Million)600400200-Operating StatisticsFreightYear 2010 Year 2011Year 2012(%)80.060.040.020.0-ADTKRFTKF/FYoY (Month) YoY (Quarter)QoQ (Quarter)Mar'12 Mar'11 YoY% Q1'12 Q1'11 YoY% Q1'12 Q4'11 QoQ%MADTK 389 439 - 11.4 1,196 1,233 - 3.0 1,196 1,210 - 1.2MRFTK 233 261 - 10.7 651 698 - 6.7 651 669 - 2.7Freight factor% 59.9 59.5 0.7 54.4 56.6 - 3.8 54.4 55.3 - 1.6
Operating StatisticsPassenger Yield (Including Fuel Surcharge)Passenger Yield (Excluding Fuel Surcharge)(THB/Km)3.002.222.262.422.382.052.162.422.212.082.072.362.142.132.232.411.902.032.351.811.992.211.922.012.192.052.112.291.851.972.222.022.122.322.142.162.342.352.292.312.492.632.722.732.872.872.822.732.542.542.702.672.562.682.822.322.442.782.212.422.642.302.452.632.442.552.752.272.402.702.512.562.812.642.602.812.842.722.82(THB/Km)3.002.502.00Jan Feb Mar Apr May Jun Jul Aug Sep Oct Nov DecYear 2009 Year 2010 Year 2011 Year 20122.001.00Jan Feb Mar Apr May Jun Jul Aug Sep Oct Nov DecYear 2009 Year 2010 Year 2011 Year 201244 Investor Relations Department
Operating StatisticsFreight Yield (Including Fuel Surcharge)(THB/Km)Freight Yield (Excluding Fuel Surcharge)(THB/Km)8.007.727.337.087.027.016.916.946.716.626.967.026.847.137.446.777.477.516.866.676.757.186.987.306.846.696.896.757.017.376.967.087.126.857.487.426.947.537.017.029.749.669.7010.118.719.089.459.878.029.109.859.958.509.309.659.179.898.199.658.909.5310.018.619.309.828.889.8410.009.049.379.809.359.6510.019.439.4410.1510.009.008.007.00Jan Feb Mar Apr May Jun Jul Aug Sep Oct Nov DecYear 2009 Year 2010 Year 2011 Year 20127.006.00Jan Feb Mar Apr May Jun Jul Aug Sep Oct Nov DecYear 2009 Year 2010 Year 2011 Year 201245 Investor Relations Department


