CCU Sewer Connections - Charlotte County Government
CCU Sewer Connections - Charlotte County Government
CCU Sewer Connections - Charlotte County Government

Create successful ePaper yourself
Turn your PDF publications into a flip-book with our unique Google optimized e-Paper software.
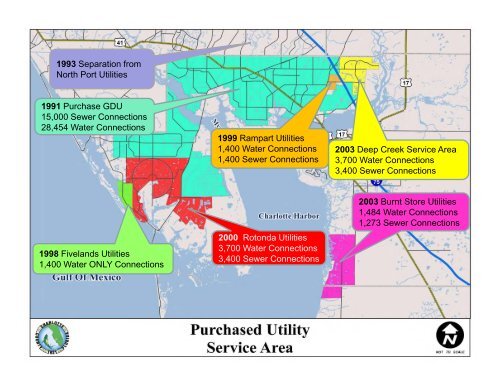
1993 Separation fromNorth Port Utilities1991 Purchase GDU15,000 <strong>Sewer</strong> <strong>Connections</strong>28,454 Water <strong>Connections</strong>1999 Rampart Utilities1,400 Water <strong>Connections</strong>1,400 <strong>Sewer</strong> <strong>Connections</strong>2003 Deep Creek Service Area3,700 Water <strong>Connections</strong>3,400 <strong>Sewer</strong> <strong>Connections</strong>1998 Fivelands Utilities1,400 Water ONLY <strong>Connections</strong>2000 Rotonda Utilities3,700 Water <strong>Connections</strong>3,400 <strong>Sewer</strong> <strong>Connections</strong>2003 Burnt Store Utilities1,484 Water <strong>Connections</strong>1,273 <strong>Sewer</strong> <strong>Connections</strong>
<strong>CCU</strong> <strong>Sewer</strong> <strong>Connections</strong>40353025Thousands20151050Year94 95 96 97 98 99 00 01 02 03 04 05 06 07 08 09 10 11 12<strong>Sewer</strong> 10,993 11,262 11,474 11,800 11,980 13,663 14,230 18,353 19,941 21,249 28,133 29,300 31,066 32,529 32,912 33,204 33,455 33,670 34,094
400Wastewater InfrastructureInventory350gravity LPS forcemains300miles of pipe250200150100500Year94 95 96 97 98 99 00 01 02 03 04 05 06 07 08 09 10 11 12gravity 140 140 140 147 147 166 168 168 248 249 361 365 367 372 376 377 378 378 378LPS 62 62 62 78 79 91 97 213 213 213 214 242 252 253 258 258 258 287 288forcemains 61 61 70 70 70 91 94 94 132 135 185 185 189 193 194 201 250 254 257
West Port Water ReclamationFacility (1.2 MGD)East Port Water ReclamationFacility (6.0 MGD)Rotonda Water ReclamationFacility (2.0 MGD)900+ miles <strong>Sewer</strong> Mains300+ Lift StationsBurnt Store WaterReclamation Facility(0.5 MGD)
Area 3 Commercial CorridorEast Port WRFPlant Capacity 6.0 MGDExisting Flows 4.1 MGDCan Serve Additional10,000 <strong>Connections</strong>Area 3Total Accounts: 343Occupied Accounts: 289Vacant Accounts: 54Percentage Developed: 84%Area 1Total Accounts: 8620Occupied Accounts: 5170Vacant Accounts: 3450Percentage Developed: 60%East & West Spring Lake Pilot StudyTotal Properties: 2455Occupied Properties: 1844Vacant Properties: 611Percentage Developed: 75%
Area 2Total Accounts: 13438Occupied Accounts: 7547Vacant Accounts: 5891Percentage Developed: 56%East Port Expansionfrom 6 to 9 MGDCan Serve Additional20,000 <strong>Connections</strong>
Vacant Accounts (Existing <strong>Sewer</strong>): 6,200Vacant Accounts (Proposed <strong>Sewer</strong> Expansion): 10,800East Port Expansionfrom 9 to 12 MGD.Can Serve Additional20,000 <strong>Connections</strong>
East Port Expansion to 24 MGDCan Serve all of Mid –<strong>County</strong>Can Serve an Additional80,000 <strong>Connections</strong>
Area 4Total Accounts: 5473Occupied Accounts: 2881Vacant Accounts: 2592Percentage Developed: 53%West Port Water Reclamation FacilityCapacity 1.2 MGDExisting Flows 0.6 MGDCan Serve Additional 3,750 <strong>Connections</strong>Rotonda Water Reclamation FacilityCapacity 2 MGDExisting Flows 0.85 MGDCan Serve Additional 7,100 <strong>Connections</strong>
Rotonda Water ReclamationFacilityCapacity 2.0 MGDRotonda Expansion to 3.0 MGDCan Serve an Additional6,750 <strong>Connections</strong>West Port Water ReclamationFacilityCapacity 1.2 MGDWest Port Expansion to 9.2 MGDCan Serve an Additional53,500
Burnt Store Water Reclamation FacilityCapacity 0.5 MGD - Existing Flows 0.3 MGDCan Serve Additional 1,250 <strong>Connections</strong>Full Build-out 5.6 MGDCan Serve Additional 35,000 <strong>Connections</strong>
Reclaimed Water
Why Use Reclaimed Water?Environmental:• Protects environment by helping toprevent salt water intrusion inlandcaused by excessive ground waterwithdrawals for irrigation• Saves utility customers money byreducing the need to develop newpotable water suppliesRegulation:• Compliance with State’s long term goalto conserve water by utilizing 75% of allwastewater flows for potable wateroffsets• Compliance with existing permits allowsfuture expansion of treatment andstorage facilities to meet future growthFinancialConsequences:• New Desalination Plant$10 to $12 / 1,000gal• New Reverse Osmosis WaterTreatment Plant and BabcockRanch Wellfield$4.00 to $4.50 / 1,000gal
Cost of Reclaimed WaterDistributionLineExisting System Existing System Phase 1‐3 Expansion Phase 1‐3 Total System Total SystemNo. Description Capital Costs Equiv Annual Cost Capital Costs Equiv Annual Cost Capital Costs Equiv Annual CostCapital Investment:1 On‐Site Facilities [1] $ 1,610,595.00 $ 89,004.00 $ 3,133,198.00 $ 173,145.00 $ 4,743,793.00 $ 262,148.002 Transmission Mains [1] 10,124,463.00 559,491.00 9,952,540.00 549,991.00 20,077,003.00 1,109,482.003 Storage [1] 1,219,912.00 72,050.00 1,909,240.00 112,762.00 3,129,152.00 184,812.004 Pump Stations [1] 2,064,917.00 153,938.00 4,425,500.00 329,918.00 6,490,417.00 483,856.005 Total Capital Cost $ 15,019,887.00 $ 874,483.00 $ 19,420,478.00 $ 1,165,816.00 $ 34,440,365.00 $ 2,040,299.006 Less Grants Received/Applied For 4,165,005.00 335,538.00 ‐ ‐ 13,875,244.00 1,501,354.007 Total <strong>CCU</strong> Capital Investment $ 10,854,882.00 $ 538,945.00 $ 19,420,478.00 $ 1,165,816.00 $ 20,565,121.00 $ 538,945.008 Amortized Capital Cost[2] $ 538,945.00$ 663,713.009 Renewal & Replacement[3] 42,839.00 78,000.0010 Operating Expenses:11 Electric Pumping Cost[4] 106,000.00 162,000.0012 Other Operating Cost[5] ‐ 67,000.0013 Total Operating Expenses $ 106,000.00$ 597,000.0014 Total Revenue Requirements $ 687,784.00$ 970,713.0015 Daily Revenue Requirement $ 1,884.00$ 2,659.001617 Reclaimed Production @ Plants 5.9 MGD 8.5 MGD18 Cost to produce 1000 gals if all production is sold $0.32 $0.31 w/ 50% Grants$0.76 w/o Grants19 Reclaimed Sent to Customers @ present time 3.003 MGD20 Cost to produce 1000 gals with existing sales $0.63Notes:<strong>CCU</strong> Life Estimate for Assets:[1] Cost to Produce per 1000 gallons based on sales/demand On‐site facilities & Transmission Mains: 100 years[2] Amortization based on the average service life of the facilities an an annual capital cost of 5.5% Storage Facilities : 50 years[3] Based on renewal and replacement funding level equal to 5.0% of revenue Pumping Facilities: 25 years[4] Per <strong>CCU</strong> staff based on actual operating expense.[5] Based on one additional line technician. Equivalent Annual Cost (EAC) = Net Present Value/Annuity Factor
WalendaBooster &Storage 0.5 MGWest PortBooster &Storage 20 MGEagle StreetBooster &Storage 0.5 MGEast Port WRFBooster FacilitiesRotonda EastBooster StationRotondaBooster &Storage 5.6 MGBurnt Store WRFBooster Facilities
Pinemoor WestGolf CourseDuffy Golf CourseNorth<strong>Charlotte</strong>Regional ParkPinemoor EastGolf CoursePort <strong>Charlotte</strong>High School<strong>Charlotte</strong> <strong>County</strong>AdministrationBuildingFranz RossParkDeep CreekGolf CourseKings GateGolf CourseRotonda HillsGolf CoursePine ValleyGolf CourseBurnt Store MarinaGolf Course
GertrudePumping & Storage0.5 MG776 CommercialArea 3MaracaiboParkParkside CRAHarold AvenuePark776 CommercialArea 5Lemon BayGolf Course776 CommercialArea 4776 CommercialArea 2776 CommercialArea 1Sunrise andSpring Lake ParksVictoria KingsEstateGolf CourseEagle PreserveEstates
MurdockVillageKiwanisParkCattle Dock Point RdNorth SideLandings at Coral CreekFivelandsPumping & Storage0.5 MGDCattle Dock Point RdSouth Side771 Commercial Area 1Cape HazeSubdivisionPlacida HarbourCondos771 Commercial Area 2771 Commercial Area 3771 Commercial Area 4PortofinoThunderation 771 Commercial Area 5
Reclaimed WaterDry Season Production and UsagePlant Production* Sent to Users* Total Available*East Port WRF (current) 4.1 1.5 2.6Rotonda WRF (current) 0.9 0.9 0.0West Port WRF (current) 0.6 0.6 0.0TOTAL (current) 5.6 3.0 2.6WASTEWATEREXPANSION(Additional 17,000<strong>Connections</strong>)TOTAL DEMAND PHASE 3STAGES 1-32.6 5.23.5 1.7Burnt Store WRF (current) 0.3 0.003 0.297Burnt Store (future demand) 0.297 0* Flow in Million Gallons per Day (MGD)
Finance
FY 12/13 Net Budget $93,818,051R & R Fund16.4%MSBU0.3%O & M Fund42.7%Debt ServiceFund25.2%Water CFFund4.8%<strong>Sewer</strong> CFFund10.6%
Municipal Service Benefit Unit(MSBU) FundsMSBUPercent of Budget: 0.3%Amount: $319,093Definition: Pays for expansionprojects through equitableassessments adopted byresolution.Source: Assessments (Can beaugmented with grants or otherfunding sources)Note: Assessments are used aspledged revenues for borrowings
Operations & Maintenance(O&M) FundO & MFundPercent of Budget: 42.7%Amount: $40,069,921Definition: Cost of providingservices and maintaining systemand capacity.Source: User fees including BaseFacility Charge, Consumption orUsage Charge, a CustomerCharge and payment of AccruedGuaranteed Revenue Fee by newusers requesting service
<strong>Sewer</strong> Connection Fee and WaterConnection Fee (CF) FundsPercent of Budget:<strong>Sewer</strong> 10.6%; Water 4.8%Amount:<strong>Sewer</strong> $9,935,397Water $4,489,291Definition: Used to pay forgrowth related capital costs. Alsoknown as System DevelopmentCharges.Water CFFund<strong>Sewer</strong> CFFundSource: New customersrequesting utility services.
Connection Fee per ERC*WaterPlant Capacity $910Transmission $380Distribution $490Total $1,780<strong>Sewer</strong>Plant Capacity $1,100Transmission $500Collection $740Total $2,350* Equivalent Residential Connection (ERC) Based on rate resolution 4/1/2012
Debt Service FundPercent of Budget: 25.2%Amount: $23,640,081Definition: Fund pays all Utilitybonds and debt.DebtServiceFundSource: Transfer of Operationsand Maintenance funds andMSBU Funds as needed to paythe annual debt and maintaindebt reserves as required.Final Bonds Maturity - 2024
Debt Retirement FundPrincipal Amountremaining asof 9/30/2012Bond Total* $ 151,315,000SRF Funding, Loans Total** 23,070,693Total Debt $ 174,385,693* Purchase of GDU, Rotonda and Florida Water Service, Expansion of BurntStore and 1995 Wastewater Expansion Engineering Design.** MSBU water and sewer expansions, 1996 upgrade of East Port Facility,and Peace River REP internal loan payment.
Repair & Replacement(R&R) FundR & RFundAKA - Refurbishment andRehabilitation of AssetsPercent of Budget: 16.4%Amount: $15,364,268Definition: For renewal andreplacement of infrastructure tomaintain services and meetregulatory treatment standardsSource: Operations andMaintenance Funds
How an Average Payment of$83.59 is used by the UtilityUtility OperationsDebt ServiceCapital OutlayPurchase WaterR & R Transfer$2.37$7.84$16.17$23.54$33.67$0.00 $10.00 $20.00 $30.00 $40.00* Based on 4,000 gallons usage @ Rates Effective 10/1/2013All utility bill payments are deposited initially into the O&M Fund.
1997 – 2005 Rate Decrease ForWater and <strong>Sewer</strong> Customers• BOCC decreasedwater rates by 12% andsewer rates by 5%.• No increases forinflation during thisperiod.
<strong>CCU</strong> - 8th