Lord Howe Island Howe’s Life Competition
National Offices & Business Park Survey Winter ... - Strutt & Parker
National Offices & Business Park Survey Winter ... - Strutt & Parker
- No tags were found...
Create successful ePaper yourself
Turn your PDF publications into a flip-book with our unique Google optimized e-Paper software.
Annual Take-up: In and out of town8,000,0001607,000,0001406,000,000120Square Feet5,000,0004,000,0003,000,0002,000,000100806040Number of Transactions1,000,0002002002 2003 2004 2005 2006 2007 2008 2009 2010 20110In Town Out of Town No. of Transactions - In Town No. of Transactions - Out of TownAnnual Take-up: By grade8,000,0007,000,0006,000,0005,000,000Square Feet4,000,0003,000,0002,000,0001,000,00002002 2003 2004 2005 2006 2007 2008 2009 2010 2011Grade B Grade A Grade A NewNational Offices & Business Parks Survey Winter 2011/2012 3
Take-up Trends• The FBS, Computer/Electronics andChemical/Pharmaceutical sectorsdominated take up again in 2011accounting for 66% by total floor space,a slight reduction on the 5 and 10 yearaverages. The Energy sector increasedits influence accounting for 9% of totalfloor space with major lettings toCentrica, BP and Saipem.• Post completion lettings accountedfor 86% by total floor space and 95% bynumber of transactions. Last year wepredicted the number of off plan lettingswould increase during 2011 as a resultof limited Grade A New opportunities ina number of locations. 2011 saw 11lettings off plan or during construction,a total of 565,000 sq ft compared toonly 4 in 2010 totalling 343,183 sq ft.These included 83,500 sq ft inCambridge to Microsoft, 81,000 sq ft inOxford to Centrica and 92,000 sq ft inKingston-upon-Thames to Saipem.• Transactions below 40,000 sq ft lastyear were in line with 2010 accountingfor 66% of total floor space (89% bynumber of transactions). There were 23transactions in excess of 40,000 sq ftaveraging 54,030 sq ft. 2010 witnessed6 transactions in excess of 100,000 sq ftwhilst last year there were only 2,namely Astellas Pharma in Chertsey andNestle in Crawley. There were however4 transactions in the 80-100,000 sq ftsize band compared to none in 2010.These were the three pre-letshighlighted earlier and 96,000 sq ft inPortsmouth to Pall Europe.• The Thames Valley which saw aresurgence in 2010 had a disappointingyear with take up levels 8% below the10 year average. With the exception ofMaidenhead which saw take up levelsdouble the 10 year average all othertowns were below. What was missingfrom the market were transactions in thelarger size bands with only 5 in the40-60,000 sq ft size band, 1 in the60-80,000 sq ft size band and notransactions in excess of 80,000 sq ft.The key transactions were AdobeSystems at Market House inMaidenhead town centre (48,800 sq ft)and Covance at Building One,Maidenhead Office Park (50,800 sq ft).In Reading PRA International took43,000 sq ft at Green Park and AtosOrigin 47,050 sq ft at IQ Winnersh. AtHeathrow BP acquired 68,000 sq ft atBedfont Lakes and Centrica took 47,000sq ft on The Causeway in Staines.• 2011 saw the completion of only onespeculative office development, namelyBridgewater House, Finzels Reach inBristol City centre (110,524 sq ft).Completions are set to improve over thenext two years with 873,000 sq ft ofspeculative development either on siteor due to start shortly. 340,000 sq ft isdue for completion this year in fiveschemes in Chiswick, Richmond,Weybridge, Uxbridge and Woking. 2013will see a further five schemes completetotalling 533,000 sq ft in Chiswick,Hammersmith, Maidenhead andStaines. Rockspring are by far the mostactive with 4 schemes, while BAM,Kames Capital, Development Securities/SWIP and Blackstone are developingone each. Further development willcome through in the form ofcomprehensive refurbishments of olderbuildings. A number of funds includingHermes, Prupim, AXA REIM, AvivaInvestors, LIM and Schroders haveeither started or will do shortly onprojects this year totalling in excess ofhalf million sq ft.• Vacancy rates across the regionaverage 13% but with a wide variationbetween towns from a low of 5% inStaines to a high of 22% in Bracknell.Grade A New vacancy now averagesonly 2.9% across the region with sometowns having no new buildingsavailable. It is these hotspot townswhere speculative development is nowtaking place.Annual Take-up: By business sector8,000,0007,000,0006,000,0005 yr computer / electronics trendSquare Feet5,000,0004,000,0003,000,0005 yr FBS trend2,000,0001,000,00002002 2003 2004 2005 2006 2007 2008 2009 2010 2011Chemical / Pharmaceutical Computer / Electronics FBS Telecommunications Other4 National Offices & Business Parks Survey Winter 2011/2012
Annual Take-up: By commitment type8,000,0007,000,0006,000,000Square Feet5,000,0004,000,0003,000,0002,000,0001,000,00002002 2003 2004 2005 2006 2007 2008 2009 2010 2011Post Completion Pre-Completion Letting Pre-Let Off Plan Land SaleAnnual Take-up: By size band8,000,0007,000,000Square Feet6,000,0005,000,0004,000,0003,000,0002,000,0001,000,00002002 2003 2004 2005 2006 2007 2008 2009 2010 2011Annual Take-up: By key Thames Valley towns2,000,0000 - 20,000 20,000 - 40,000 40,000 - 60,000 60,000 - 80,000 80,000 - 100,000 100,000 +1,500,0005 yr trendSquare Feet1,000,000500,00010 yr trend02002 2003 2004 2005 2006 2007 2008 2009 2010 2011Reading Bracknell Heathrow Maidenhead Slough Egham/StainesNational Offices & Business Parks Survey Winter 2011/2012 5
Take-up and Supply – By LocationM4 Corridor2,000,000Square Feet1,500,0001,000,000500,0000Q4 2010Q4 2011Take upQ4 2010Q4 2011Take upQ4 2010Q4 2011Take upQ4 2010Q4 2011Take upQ4 2010Q4 2011Take upQ4 2010Q4 2011Take upEgham/Staines Slough Maidenhead Windsor Bracknell ReadingAvailability - Grade A New Availability - Grade A Availability - Grade B 2011 Take UpEgham/Staines Slough Maidenhead Windsor Bracknell ReadingAvailability - Q4 2010 247,409 795,925 600,070 117,755 1,289,677 1,630,347Availability - Q4 2011 345,906 816,525 505,341 73,597 1,207,763 1,624,881Take Up - Grade A New 0 0 158,607 0 0 148,792Take Up - Grade A 60,675 34,374 50,800 28,250 57,088 58,485Take Up - Grade B 5,802 48,258 0 0 26,594 79,760West London1,000,000800,000600,000Square Feet400,000200,0000Q4 2010Q4 2011Take upQ4 2010Q4 2011Take upQ4 2010Q4 2011Take upQ4 2010Q4 2011Take upHeathrow Uxbridge Chiswick HammersmithAvailability - Grade A New Availability - Grade A Availability - Grade B 2011 Take UpHeathrow Uxbridge Chiswick HammersmithAvailability - Q4 2010 860,413 209,473 305,043 404,375Availability - Q4 2011 825,124 317,706 224,986 440,250Take Up - Grade A New 11,000 0 57,876 0Take Up - Grade A 137,125 0 46,034 124,139Take Up - Grade B 0 0 0 116,5006 National Offices & Business Parks Survey Winter 2011/2012
M40 Corridor500,000400,000300,000200,000100,0000Q4 2010Q4 2011Take upQ4 2010Square FeetQ4 2011Take upQ4 2010Q4 2011Take upQ4 2010Q4 2011Take upMarlow High Wycombe Oxford AbingdonAvailability - Grade A New Availability - Grade A Availability - Grade B 2011 Take UpMarlow High Wycombe Oxford AbingdonAvailability - Q4 2010 155,000 289,580 383,359 124,983Availability - Q4 2011 222,704 206,408 252,860 115,014Take Up - Grade A New 0 0 81,000 0Take Up - Grade A 69,445 11,759 8,000 0Take Up - Grade B 0 8,087 50,048 32,075M3 Corridor1,000,000800,000600,000400,000200,0000Q4 2010Q4 2011Take upQ4 2010Square FeetQ4 2011Take upQ4 2010Q4 2011Take upQ4 2010Q4 2011Take upQ4 2010Q4 2011Take upCamberley Fleet Hook Farnborough BasingstokeAvailability - Grade A New Availability - Grade A Availability - Grade B 2011 Take UpCamberley Fleet Hook Farnborough BasingstokeAvailability - Q4 2010 329,445 199,801 148,445 372,986 746,875Availability - Q4 2011 444,605 273,805 82,212 794,105 807,911Take Up - Grade A New 37,000 0 33,200 21,457 0Take Up - Grade A 60,000 11,264 0 33,609 47,821Take Up - Grade B 6,700 6,028 0 0 16,541National Offices & Business Parks Survey Winter 2011/2012 7
Take-up and Supply – By LocationNorth M25800,000600,000400,000200,0000Q4 2010Q4 2011Take upSquare FeetQ4 2010Q4 2011Take upQ4 2010Q4 2011Take upQ4 2010Q4 2011Take upQ4 2010Q4 2011Take upQ4 2010Q4 2011Take upQ4 2010Q4 2011Take upWatfordHemelHempsteadSt AlbansWelwynGarden CityHatfieldRickmansworthBorehamwoodAvailability - Grade A New Availability - Grade A Availability - Grade B 2011 Take UpRickmansworth Watford Hemel Hempstead St Albans Welwyn & Hatfield BorehamwoodAvailability - Q1 2010 210,204 508,329 613,177 173,429 280,408 346,294Availability - Q1 2011 162,262 433,052 482,066 178,891 293,996 312,169Take Up - Grade A New 0 0 0 0 7,519 0Take Up - Grade A 0 38,824 69,000 7,123 68,350 29,747Take Up - Grade B 0 23,610 16,288 0 11,000 0South M25500,000400,000300,000200,000100,0000Q4 2010Q4 2011Take upSquare FeetQ4 2010Q4 2011Take upQ4 2010Q4 2011Take upQ4 2010Q4 2011Take upQ4 2010Q4 2011Take upQ4 2010Q4 2011Take upQ4 2010Q4 2011Take upRedhill Reigate Leatherhead Guildford Woking Weybridge ChertseyAvailability - Grade A New Availability - Grade A Availability - Grade B 2011 Take UpRedhill Reigate Leatherhead Guildford Woking Weybridge ChertseyAvailability - Q4 2010 185,021 141,064 106,761 264,009 479,097 229,305 146,636Availability - Q4 2011 182,397 130,708 149,640 368,210 298,343 248,138 63,871Take Up - Grade A New 0 0 0 0 0 0 0Take Up - Grade A 37,696 13,000 13,000 17,140 18,165 12,980 100,142Take Up - Grade B 8,230 7,962 31,453 0 74,153 8,010 08 National Offices & Business Parks Survey Winter 2011/2012
Occupier Demand Analysis• 2011 saw identified demand improve20% on 2010 and 35% on 2009 levelsaveraging 5.17 million sq ft over the year.Of this demand 17% was under offer atthe end of Q4 2011 down on 2010 (22%)but slightly up on 2009 (15%).• The 5-20,000 sq ft size band continuesto represent half of all identified demandwith the three upper size bandsaccounting for only 10% by number ofenquiries. This pattern has beenconsistent over the last 3 years. Themost significant change witnessed in2011 was improvement in the 40-60,000sq ft size band which now represents14% compared to only 7% in theprevious two years.• The services and computer/electronicssectors continue to dominate demandwith services representing 38% andcomputers/electronics 30%. This ismarginally ahead of take up levels lastyear where the two sectors combinedaccounted for 60% of take up bynumber of transactions.• Based on current and historic identifieddemand we anticipate take up levels for2012 to be in line with the 5 and 10 yearaverages at 4.25-4.5 million sq ft.Demand by Quarter6,000,000Live Named Enquiries– By Size Band5-20,000 sq ft20-40,000 sq ft40-60,000 sq ft60-80,000 sq ft80-100,000 sq ft100,000 + sq ftLive Named Enquiries– By Business SectorChemical / PharmaceuticalComputer / ElectronicsConstructionConsumer GoodsEnergyGovernmentManufacturing/DistributionMedia / PublishingMotor IndustryRetailServicesTelecoms5,000,0004,000,000Square Feet3,000,0002,000,0001,000,0000Q12009Q22009Q32009Q42009Q12010Q22010Q32010Q42010Q12011Q22011Q32011Q42011LiveUnder OfferNational Offices & Business Parks Survey Winter 2011/2012 9
Investment Market• All UK Property* in 2011 produced aTotal Return of 8.1% but Capital Growthslowed during the year to 1.2%, withvalues actually falling during the lastquarter of the year.• Total Returns for All UK Officesperformed comparatively better at 9.4%but performance was generated byCentral London, and excluding thesefigures Total Returns were 6.1% and3.3% for South East and Rest of UKoffices respectively.• Office transaction volumes in total weredown 11% compared with 2010, buttransaction volumes outside CentralLondon are recorded at £7.1 billion,reflecting a significant increase of 61%on £4.4 billion recorded in 2010.(Property Data)• Prime property continues to remain themost favoured asset for bothinstitutional and private investors.Values remain very robust for the rightstock, a result of a shortage of supply inboth South East and Provincial markets.<strong>Howe</strong>ver investors remain extremelycautious and the definition of prime hasnarrowed to a selected band ofproperties in core town and city centres.• Demand for prime assets has led to asharpening of prime yields by up to 25bps over the last 12 months as investorscontinue to pay a premium for qualityand scarcity of stockMajor Provincial Cities 5.75%-6.00%South East offices 6.00%-6.25%South East business parks 6.00%-6.25%• We expect values to remain robust forprime assets but further falls in valuesfor assets which present increased risk,either refurbishment costs, relettingrisks or exposure to weaker covenants.In our view the widening disparity invalues provides an opportunity forassets in selected markets where weare seeing a lack of quality spaceavailable but consistent occupationaldemand.*IPD Monthly IndexGlobeside, MarlowAdvised Invista on the sale of this urbanbusiness park in Marlow town centre.The scheme comprises four units plus aproposed development phase, withtenants including Telefonica UK, TNT Postand Icon Clinical Research. It waspurchased by Threadneedle in December2011 for £25.95 million reflecting a netinitial yield of 9.84%.Centrum Business Park, St AlbansActing for Orchard Street InvestmentManagement LLP, CT2 and CT3,Centrium Business Park was sold toCBREi for £13.38 million, reflecting a netinitial yield of 7.54%. Both buildings are letto Premier Foods Plc for a remaininglease term of approximately 7 years at acurrent passing rent of £1.07 million pa,reflecting £22.70 psf overall.10 National Offices & Business Parks Survey Winter 2011/2012
Strutt & Parker New Speculative Developments & RefurbishmentsCGI Daytime ViewPoint, MaidenheadAdvising Kames Capital and Capella Estates on thisiconic landmark development in Maidenhead towncentre. The 78,000 sq ft nine storey building is duefor completion in May 2013.Flow, The Causeway, StainesAdvising Rockspring and Exton Estates on this twobuilding office development totalling 59,000 sq ft.Work will start on site in April with completionexpected in May 2013.Velocity, Brooklands, WeybridgeAdvising Rockspring and Exton Estates on this strikingnew development within the historic boundaries of theworld famous Brooklands race track. The 103,593 sq ft,two building development is due for completion inNovember 2012.Abbey Gardens, Kings Road, ReadingAdvising Hermes Fund Managers Ltd and BellHammer on the comprehensive refurbishment of theSouth Block comprising 76,735 sq ft over eightstoreys. Works will start on site in February withcompletion in January 2013.Hammersmith Grove, London W6Advising Development Securities and Scottish WidowsInvestment Partnership on this 230,000 sq ft twobuilding development, the first in Hammersmith for adecade. Building One comprising 105,000 sq ft is duefor completion in April 2013.80 Hammersmith Road, London W6Advising Peakside Capital and Mercer Real EstatePartners on the comprehensive refurbishment of thissix storey building comprising 41,700 sq ft. Works aredue to complete in February 2012.National Offices & Business Parks Survey Winter 2011/2012 11
Strutt & Parker Key Occupational Transactions in 2011Oxford Business ParkAdvised Goodman on the off-plan pre-letting toCentrica of a self contained building comprising81,000 sq ft at a rent of £22.50 per sq ft on a17 year lease.New Square, Bedfont Lakes, HeathrowAdvised Scottish Widows Investment Partnershipon the letting of Building 1, Building 7 and Building 5(part 2nd floor) comprising 66,543 sq ft at rents of£24.00 per sq ft and £25.00 per sq ft on 10 yearleases.Market House, MaidenheadAdvised Shepherd Developments and Durngate onthe letting of two and a half floors comprising 48,788sq ft to Adobe Systems at a rent of £29.50 per sq fton a 12 year lease.12 National Offices & Business Parks Survey Winter 2011/2012
CGI Maidenhead Office Park 2Maidenhead Office Park One, MaidenheadAdvised AXA Real Estate Investment Managers UKLtd on the pre-letting of this self contained buildingcomprising 50,798 sq ft to a confidential USpharmaceutical company at a rent of £23.50 persq ft on a 10 year lease.Form 1, Bartley Wood Business Park, HookAdvised CIT on the letting of the first floor, comprising33,200 sq ft to Alphabet (GB) Ltd at a rent of £19.50per sq ft on a 10 year lease.68-72 Hammersmith Road, London W6Advised Stockland on the sale of this part let selfcontained building comprising 115,000 sq ft at aprice of £38,750,000.Arlington Business Park, ReadingAdvised Goodman on three lettings to Nedap,Wrigleys and Adtran totalling 21,750 sq ft at a rent of£26.50 per sq ft on 10 year leases.3 Shortlands, Hammersmith Road, London W6Advised Halcrow on lettings to Deltek, Diebold andOrega totalling 27,500 sq ft on various length leasesat a rent of £32.50 per sq ft.Building 3, Arlington Square, BracknellAdvised Goodman on the letting of three floorscomprising 34,530 sq ft on 10 year leases toQuantum Storage, AVNet and LANDesk at £18.50per sq ft.National Offices & Business Parks Survey Winter 2011/2012 13
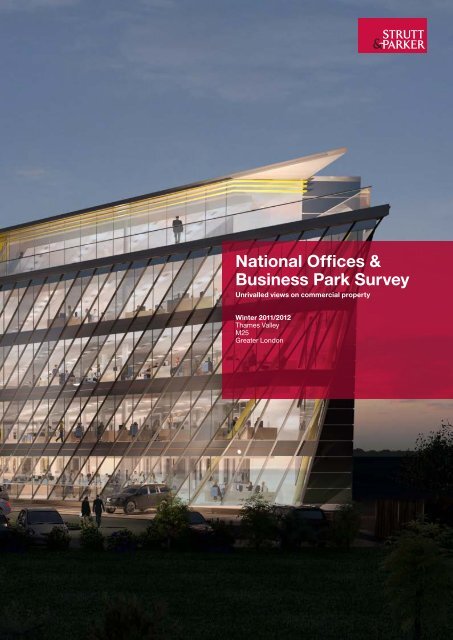
Map of Market AreaA1MM5M40M1M11M4M25M3A3M23M20Definition of termsSizeBoth supply and take-up analysisexcludes floor space under 5,000 sq ft.Take-upOccupational take-up. Taken at thepoint that an agreement becomesunconditional. This excludes developerland/building purchases for developmentand refurbishment.Quarterly DataTake-up is analysed on the basis of3 month quarters. A ‘snapshot’ ofthe market is taken at the end of eachquarter. As additional data becomesavailable the graphs are updatedeach quarter.Grading DefinitionsGrade A New – Brand new developmentor substantial refurbishment. Thisincludes tenant disposals when tenanthas never been in occupation.Grade A – Second Hand – Highquality previously occupiedaccommodation. This includesminor internal refurbishmentsundertaken by Landlords.Grade B – Medium to low qualitypreviously occupied accommodation.SupplyFloor space which is being marketedand is available for occupation.Speculative development underconstruction and due for completionduring the year is included.Sector AnalysisBusiness sectors have been groupedto identify market trends and within thesegroups, there are a numberof sub-sectors. On average, 85%of the market is dominated by fourkey sectors as follows:SectorComputer/ElectronicsServicesTelecomsChemical/PharmaceuticalSub-sectorHardware, Software, Internet,Support Services.Financial, Insurance, Business,Serviced Offices.Manufacturing, Service Provision.Manufacturing, Research, Clinical Trials.Commitment TypeThis analyses how occupiers committo taking space and is broken downinto four categories: land purchase;commitment off plan prior to constructionor commitment during the construction ofa speculative development and postcompletion.DisclaimerEvery effort has been made to ensure that the information and statistics contained in this survey are accurate. We have reliedsubstantially on information provided by outside sources and Strutt & Parker LLP takes no responsibility for any damage orloss sustained as a result of its content. No part of this report may be reproduced or transmitted, in any form or by any meanswithout the prior written consent of Strutt & Parker LLP. January 2012.Cover image:Velocity, Brooklands, Weybridge. A new speculative development by Rockspring and Exton Estates.14 National Offices & Business Parks Survey Winter 2011/2012
National Offices & Business Parks Survey Winter 2011/201215
Simon BlandHead of National MarketsTel: +44 (0)20 7318 5012simon.bland@struttandparker.comEdward SmithHead of National Markets – Office AgencyTel: +44 (0)20 7318 5136edward.smith@struttandparker.comHead Office13 Hill Street, London W1J 5LQTel: +44 (0)20 7629 7282Fax: +44 (0)20 7629 0387City Office1 Angel Court, London EC2R 7HJTel: +44 (0)20 7600 3456Fax: +44 (0)20 7629 3330www.struttandparker.comResidentialCommercialFarmingLand ManagementSportingLeisure and HotelsDevelopmentProfessional Services


