Corn
2007 Corn Annual - Corn Refiners Association
2007 Corn Annual - Corn Refiners Association
- No tags were found...

Create successful ePaper yourself
Turn your PDF publications into a flip-book with our unique Google optimized e-Paper software.
<strong>Corn</strong>Part of of a a Global Economy<strong>Corn</strong> Refiners AssociationAnnual Report 2007
Board of DirectorsJames P. Zallie, ChairmanNational Starch and Chemical CompanyTimothy Kortemeyer, Vice ChairmanPenford Products Co.Ed HarjehausenArcher Daniels Midland CompanyDennis RiddleArcher Daniels Midland CompanyPatrick E. BoweCargill, IncorporatedKen YoergCargill, IncorporatedJack Fortnum<strong>Corn</strong> Products International, Inc.Rick Kyle<strong>Corn</strong> Products International, Inc.Neil S. GrimwoodNational Starch and Chemical CompanyWilliam WinetroubPenford Products Co.Dominique TaretRoquette America, Inc.Richard O'HaraRoquette America, Inc.J. Patrick MohanTate & Lyle Ingredients Americas, Inc.D. Lynn GriderTate & Lyle Ingredients Americas, Inc.StaffAudrae EricksonPresidentSteve LomaxSenior Director of Regulatory AffairsNancy KohlerAssistant Director for Policy and OperationsShannon WeinerExecutive Assistant
ContentsThe Year in Review ....................................................................... 2U.S. <strong>Corn</strong> Exports Are Important to the Economy ..................... 5Refined <strong>Corn</strong> Products: Growing Markets Around the World ... 7A Global Outlook for Refined <strong>Corn</strong> Products ........................... 10<strong>Corn</strong> Industry StatisticsShipments of Products of the <strong>Corn</strong> Refining Industry – 2006 ....... 3U.S. Per Capita Sweetener Deliveries for Food & Beverage Use .. 4U.S. <strong>Corn</strong> Refining Industry at a Glance – 2006 ............................ 5<strong>Corn</strong>: Supply & Disappearance ...................................................... 6Refined <strong>Corn</strong> Exports 1989 – 2006 ................................................ 8World <strong>Corn</strong> Production, Consumption & Stocks............................ 9<strong>Corn</strong>: Food & Industrial Uses....................................................... 11<strong>Corn</strong> for Grain: Yield & Production ............................................. 13Exports of Products from <strong>Corn</strong> – 2006......................................... 14Member Company Products ......................................................... 15Member Company Domestic & International Plant Locations .... 16
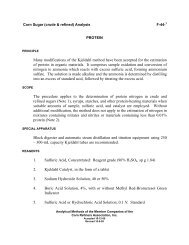
The Year in ReviewAudrae EricksonPresident<strong>Corn</strong> Refiners AssociationThe United States is the largest cornproducer in the world. This year, U.S.corn farmers maintained their distinctionas the most abundant and reliable globalsupplier of corn by producing the largest cropon record ever.<strong>Corn</strong> grown on American soil benefitsconsumers throughout the world in a variety ofways—from the golden kernels used to feedanimals to the corn starch used in bindingpharmaceuticals. Products from the cornrefining industry touch human lives all overthe globe by making thousands of foods,personal and health care items, home productsand industrial goods possible.2007 <strong>Corn</strong> AnnualThis year’s <strong>Corn</strong> Annual provides a glimpse ofthe importance of American corn to the globaleconomy. Our featured guest author is wellknown to the corn refining industry and arespected veteran of agricultural policy andpromotion. U.S. Department of Agriculture(USDA) Acting Secretary Charles F. Connershares his thoughts on the impact of exportmarkets for U.S. corn as they relate to price,availability and policy.<strong>Corn</strong> Refiners Association Chairman James P.Zallie of National Starch and ChemicalCompany analyzes the patterns of exports ofrefined corn products over the past twentyyears to provide insight into potential areas formarket developments in the coming years.Sakharam K. Patil, Ph.D., draws on his 30years of experience in the industry to discussthe impact of technological advancements inrefined corn products to help meet the needs ofan expanding global population.Issues of Importance to the IndustryObesityThe national debate on obesity involves animportant health concern facing our nation andraises issues that deserve well-founded,science-based responses. Unfortunately, themedia cover the subject of obesity withvarying levels of expertise and depth that attimes oversimplify the issue by attempting tosingle out specific food ingredients, includinghigh fructose corn syrup (HFCS), as the soleor predominant cause of this multi-facetedsocietal problem.The CRA employs a number of strategies tocorrect the record by providing science-basedfacts about HFCS. CRA’s rapid responsesystem for communicating with journalists andmedia outlets that mischaracterize HFCS hasbeen effective in educating both the media andthe public. Reports that provide inaccurateHFCS information appear to be declining, andwe have begun seeing articles that defendHFCS as a safe and useful ingredient,consistent with the Food and DrugAdministration’s “Generally Recognized asSafe” or “GRAS” determination that wasinitially granted to HFCS in 1983.Several studies published in peer-reviewedjournals in 2007 have added further scientificsupport for our efforts to demonstrate thesafety and value of HFCS. The February 2007issue of Nutrition, for example, includes astudy by Kathleen J. Melanson, et al. on theeffects of HFCS and sucrose on circulatinglevels of glucose, leptin, insulin and ghrelin.The study found no differences in themetabolic effects of HFCS and sucrose.Similarly, Pablo Monsivais and colleagues atthe University of Washington demonstrate thatbeverages sweetened with sucrose, HFCS andaspartame all have similar effects on satiety(feeling of fullness) in a study published in theJuly 2007 issue of the American Journal ofClinical Nutrition. The August 2007 issue ofCritical Reviews in Food Science andNutrition includes an expert review on HFCSand weight gain led by Richard Forshee,Ph.D., of the University of Maryland Centerfor Food, Nutrition, and Agriculture Policy.These experts found insufficient support forthe notion that HFCS could play a uniquecausal role in obesity. The August 2007 issueof Food and Chemical Toxicology includes astudy by Sam Sun and Mark Empieconcluding that those who frequently consumesweetened soft drinks do not have a higherobesity rate than those who rarely drink them.Proactive communication with dieticians,other health professionals and the journalistswho cover this field is another component ofCRA’s engagement in the obesity debate. The2 | 2007 <strong>Corn</strong> Annual
CRA had discussions with relevantprofessional groups at several conferences,including the American Dietetic Association,Institute of Food Technologists, SchoolNutrition Association and the North AmericanAssociation for the Study of Obesity as well asnumerous groups represented at theExperimental Biology conference.CRA works closely with its ScientificAdvisory Panel to assure that itscommunications with the public on the subjectof obesity have a sound basis in the underlyingscience. CRA also interacts with a number ofimportant allied organizations to presentscience-based, factual information concerningrefined corn products.Farm BillHow the U.S. sugar program is structuredunder the next Farm Bill is crucial to ensuringthat the free trade promised under the NorthAmerican Free Trade Agreement (NAFTA) isrealized by January 1, 2008—not only for thecorn refining industry, but for many other foodand agricultural commodities as well. If anyelement of the sugar program restricts orotherwise negates free trade in sugar betweenthe United States and Mexico, then cornsweeteners will pay a very steep priceincluding loss of jobs to our industry. If theUnited States does not live up to its NAFTAcommitments on sugar, we can be certain thatMexico will come under intense politicalpressure to nullify its NAFTA commitmentsfor numerous high value U.S. exports.The CRA worked diligently to ensure that theinterests of the corn wet milling industry weretaken into account in the House and Senate2007 Farm Bills. Both the House and Senatelegislation included unfettered access forMexican sugar imported into the UnitedStates, ensured that managed bilateral trade ofHFCS with Mexico was not permitted andguaranteed that any sugar for ethanol programwould operate under a competitive bidarrangement by the USDA.TradeAs we have seen with the NAFTA and theCentral American-Dominican Republic FreeTrade Agreement (CAFTA-DR), unrestrictedtrade is an important tool in expanding exportmarkets. While regional trade agreements arepositive developments and strongly supportedby the CRA, the best path for free trade isthrough global negotiations under the WorldTrade Organization (WTO). Talks are ongoingto finalize a framework agreement for theWTO Doha Development Agenda. Significantbehind-the-scenes efforts continue to forge abreakthrough. The CRA supports a final WTOagreement that significantly opens newmarkets for refined corn products.The House of Representatives recentlyapproved a free trade deal with Peru andShipments of Products of the <strong>Corn</strong> Refining Industry – 2006Starch Products (includes corn starch, modified starch and dextrins)6,541,956,000Refinery Products (includes glucose syrup, high fructose syrup, dextrose, corn syrup solids, maltodextrins) 33,061,474,000High fructose corn syrup—42%10,290,837,000High fructose corn syrup—55%+13,135,413,000Total HFCS23,426,250,000Total - Domestic Basic Products39,603,430,000Total - Export Basic Products2,540,965,000<strong>Corn</strong> oil (crude and refined)1,233,337,000<strong>Corn</strong> gluten feed and corn oil meal10,620,928,000<strong>Corn</strong> gluten meal2,645,418,000Steepwater1,413,841,000TOTAL SHIPMENTS58,057,919,000Compiled for the <strong>Corn</strong> Refiners Association by VERIS Consulting, LLC. Statistics represent shipments by members of theassociation. Shipments are in pounds, commercial weights, and do not include co-products derived from ethanol production.2007 <strong>Corn</strong> Annual | 3
Senate ratification of the agreement isexpected by the end of the year. The CRAurges Congress to secure quick passage ofadditional free trade agreements with Panama,Colombia and South Korea.Biotechnology<strong>Corn</strong> refiners recognize the importance ofbiotechnology and embrace its use to ensurean abundant, affordable and safe global foodsupply for generations to come. Our industry,in coalition efforts with other food andagricultural organizations, is working hard tosecure international acceptance of thisimportant technology. Much work remains tobe done, especially in key export markets suchas the European Union.Since the 2006 corn harvest, the U.S.-EU tradein corn gluten feed has fallen to a fraction ofprior years’ levels due to the presence ofHerculex RootWorm (HRW) in the cornsupply—a biotech corn variety that onlyrecently gained approval for import into theEuropean Union. Worldwide CGF exports are40% of the previous years’ volume.The industry faces a nearly identical situationfor feed produced from the 2007 corn cropbecause of the presence of two additionalEU-unapproved corn varieties. CRA continuesto cooperate with European feed compoundersand importers’ efforts to seek short and longtermsolutions for science-based, timelyapproval of biotech events in Europe.Regulatory MattersThe CRA is working cooperatively with theEnvironmental Protection Agency to addressconcerns with a new air quality modeling tool,known as AERMOD, which is used todetermine whether a proposed project willcomply with air permitting requirements underthe Clean Air Act. On this and another matter,an industry-wide protocol to measure volatileorganic compounds (VOCs) emissions, theCRA has provided sound scientificinformation to not only meet existingregulatory requirements, but to improve uponthem as well.SummaryThe corn wet milling industry is a dynamic,innovative industry that is dedicated toproviding high quality ingredients to facilitatea rapidly-growing, ever-changing globaleconomy.U.S. Per Capita Sweetener Deliveries*for Food and Beverage UseHoney &Refined HFCS Glucose Dextrose EdibleYear Sugar <strong>Corn</strong> Sweeteners (dry basis) Syrups1970198019902000200120022003200420052006101.883.664.465.564.563.361.061.763.262.50.519.049.662.762.662.961.059.959.258.310.712.913.615.815.515.515.215.615.313.84.63.53.63.43.33.33.13.33.33.11.51.31.21.51.41.51.41.31.51.5Total CaloricSweeteners119.1120.2132.4148.9147.3146.5141.7141.9142.5139.3Units Measured in PoundsSource: USDA—Economic Research Service* Per capita deliveries of sweeteners by U.S. processors and refiners and direct-consumption imports to foodmanufacturers, retailers, and other end users represent the per capita supply of caloric sweeteners. Actual human intakeof caloric sweeteners is lower because of uneaten food, spoilage, and other losses. Figures do not include deliveries toalcohol manufacturers.4 | 2007 <strong>Corn</strong> Annual
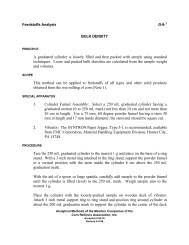
As we look back on 2007, we willremember it as a banner year for corn.We broke new records this year interms of production, price and use.When I left the <strong>Corn</strong> Refiners Association in2001, total U.S. agricultural exports were arespectable $53 billion. The corn crop thatyear was about 9.5 billion bushels and food,seed and industrial (FSI) uses for corn reachedabout 2 billion bushels, pushed by demand forcorn sweeteners. <strong>Corn</strong> used for ethanol was ata “then” record of 680 million bushels and theprice was about $2.00 per bushel.Six years later, we are in an entirely newarena. In 2007, our exports are expected toreach a record $79 billion rising to $83.5billion in 2008. The corn harvest is expected tototal 13.3 billion bushels, a higher level thanmany economists thought possible for thiscountry. Food, seed and industrial uses areestimated at 4.7 billion bushels, now pushedby domestic demand for ethanol. Of the FSItotal, 3.2 billion bushels will go to produceethanol. And the price is averaging a record$3.20 per bushel.Another remarkable aspect of today’s marketis that corn exports have held their own. Theyare still quite strong at 2.3 billion bushels,despite the demand for ethanol. <strong>Corn</strong> exportsU.S. <strong>Corn</strong> Exports AreImportant to the Economyalone account for $9.5 billion of this year’sexport total.All of this has meant a higher cost of doingbusiness for the corn refining industry. Weknow that 2008 is going to be an interestingyear, and I want you to know that we arewatching this market situation very, veryclosely in order to ensure that there areadequate supplies of the feed grains, foodgrains as well as energy stocks available forthis rapidly growing marketplace. Producershave done their part by planting 19.5% morecorn this year than last. But we recognize thatwe need to expand our horizons in terms of thedevelopment of home-grown renewableenergy sources.We want to help make cellulosic ethanol apractical and cost-effective alternative to bothgrain-based ethanol as well as an alternative togasoline. That is going to require not onlyscientific breakthroughs, but innovativeapproaches to the logistical planning andinfrastructure challenges that cellulosicethanol brings. Ultimately, the development ofcellulosic ethanol will ease the pressure onsome of our corn supply, and a thrivingrenewable fuels industry will help us lightenthe burden of $90-a-barrel oil. We must moveaway from our dependence on foreign oil,Charles F. ConnerActing Secretary, U.S.Department of AgricultureU.S. <strong>Corn</strong> Refining Industry at a Glance – 2006<strong>Corn</strong> Refining Plants:Location:<strong>Corn</strong> Grind:Value of <strong>Corn</strong> Purchased:Number of <strong>Corn</strong> SuppliersDirect Employment by CRA Member Companies:Capital Investment (Replacement Value):MAJOR PRODUCTS (estimated)Sweeteners (dry weight):Starches:Ethanol:Co-products:Value Added by Manufacture:2712 states1.6 billion bushels$3.8 billion41,00065,300*$12 billion24.7 billion pounds7.1 billion pounds1.4 billion gallons27.9 billion pounds$9.4 billion*Includes employees that provide services in non-corn refining areas.Compiled by the <strong>Corn</strong> Refiners Association based on 2006 data from the U.S. Department of Agriculture, LMC CommodityStudies, Renewable Fuels Association, and industry data compiled for CRA by VERIS Consulting, LLC.2007 <strong>Corn</strong> Annual | 5
especially that which comes from countrieswith terrorist regimes.On another front, we are working hard toexpand market access for our agriculturalproducts. In my home state of Indiana, forexample, 30% of what we raise goes into theinternational marketplace. Just imagine whatour world would be like if all of a sudden that30% had no where to go? In Indiana alone,that $2 billion of exports supports about25,600 jobs, both on and off the farm, in foodprocessing, storage and transportation.Any new market access will simply add to thatexport total. And that’s what we’ve been tryingto achieve through the multilateral andbilateral processes. We will continue to urgeother countries to match the ambition the U.S.has shown to bring the Doha DevelopmentRound to a successful conclusion.In addition to multilateral negotiations, theBush Administration has aggressively pursuednew bilateral agreements. Four that arepending as I write this letter are agreementswith Peru, Colombia, Panama and SouthKorea. If all are approved, we will gain dutyfree access to these growing markets with acombined population of about 75 million<strong>Corn</strong>: Supply & Disappearancepeople and a GDP of about $575 billion.Here at home, we are very focused on the 2007Farm Bill. We have a tremendous opportunityto craft farm policy that supports Americanagriculture into the future. But the challengenow is not so much about next year becauseprojections tell us next year is going to be agood year for agriculture. The challenge iscrafting policy that will sustain this strengthfive and ten years down the road.I firmly believe that the Administration’s FarmBill proposal is the answer. It reflects many ofthe suggestions we received during our 52USDA Farm Bill Forums across the country.We propose investing $1.6 billion inrenewable energy, $7.8 billion in conservationand providing support to beginning farmers. Itstrengthens the farm safety net and bettertargets support to real farmers instead ofwealthy investors.We will always have ups and downs in theagricultural economy, but we are seeking farmpolicy that will moderate those swings whileallowing markets to put resources to their bestuse. We appreciate your contributions to thisvibrant economy and your interest in publicpolicy.Year BeginningSeptember 1BeginningStocksSUPPLYProductionImportsTotalFood, Alcoholand IndustrialSeedDISAPPEARANCEFeed andResidualTotalExportsTotalDisappearanceENDINGSTOCKSTotal1997/98883.29,206.88.810,098.81,784.420.45,481.87,286.61,504.48,791.01,307.81998/991,307.89,758.718.811,085.31,826.519.85,467.87,314.11,984.29,298.31,787.01999/001,787.09,430.614.711,232.31,893.020.35,664.97,578.21,936.69,514.81,717.52000/011,717.59,915.16.811,639.41,937.619.35,842.17,799.01,941.39,740.31,899.12001/021,899.19,502.610.111,411.82,026.320.15,864.27,910.61,904.89,815.41,596.42002/031,596.48,966.814.510,577.72,320.220.05,562.97,903.11,587.99,491.01,086.72003/041,086.710,089.214.111,190.02,516.720.65,794.98,332.11,899.810,231.9958.12004/05958.111,807.110.812,776.02,666.120.86,157.18,844.01,818.110,662.02,114.02005/062,114.011,114.18.813,236.92,961.319.96,154.79,135.92,133.811,269.71,967.22006/07*1,967.210,534.912.012,514.03,464.323.65,597.79,085.62,124.711,210.31,303.82007/08** 1,303.813,167.715.014,486.54,567.322.75,650.010,240.02,350.012,590.01,896.5Million BushelsSource: USDA – Economic Research Service * Preliminary ** Projected6 | 2007 <strong>Corn</strong> Annual
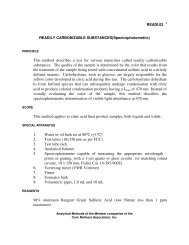
Refined <strong>Corn</strong> Products:Growing Markets Around the WorldTake a look at the list of plant locationsowned and operated by members of theU.S. corn refining industry and you willsee a world of opportunity. <strong>Corn</strong> wet millingplants provide value added products to peoplethroughout the world. While the U.S. cornrefining industry is primarily a domesticsupplier of ingredients and industrial inputs,many overseas markets have come to rely onthe quality, value and availability of ourproducts. Never satisfied with the status quo,the industry has long been a beacon oftechnological advancement in the area ofproduct quality and development. Many of ouroverseas customers recognize this and chooseU.S. refined corn products over alternatives.Exports of refined corn products account forover 20% of total shipments—a healthy figureespecially given the domestic nature of theindustry. We saw an encouraging 13%increase in the value of exports of refined cornproducts in 2006 over the previous year.Exports during the first three quarters of 2007were up 18% over the same period in 2006.Tracking exports of refined corn products overthe past twenty years provides a glimpse intothe growth capacity of this segment of theindustry’s business. As the world’s populationgrows and many areas experience increasedeconomic prosperity, U.S. corn refiners are ina strong position to provide the ingredients toenable regional food and beveragemanufacturers to meet the increasingsophistication of consumer needs and palates.Additionally, refined corn products areessential to a number of industrial productsthat will see increased demand as economiesexpand.Exports: The Ups and DownsExports of refined corn products saw a healthyrate of growth in the late 1980s and most ofthe 1990s (see page 8). The average annualrate of growth during this period was 6%.Then in the late 1990s, we began to see adecline in exports. Much of this can beattributed to a decrease in exports to theEuropean Union.For many years, U.S. corn refiners wereexporting about 5 million tons of corn glutenfeed to Europe annually under a zero-dutybinding negotiated in the 1960s. We began tosee this market shrink when tensions betweenthe European Union and the United Statesincreased over biotech corn varieties. Whilethe U.S. quickly embraced the newtechnology, the European Union was muchslower to do so and imposed restrictions on thetypes of corn that could be imported. Refinedcorn feed product exports to the EuropeanUnion dropped to 2.24 million metric tons in2006 from 5 million metric tons ten yearsearlier, a decline of $474 million.The barriers to biotech corn in the EuropeanUnion have had the greatest impact on feedproducts, but we have seen a reduction inmarkets for all refined corn products to theEuropean Union. In October 2007, theEuropean Union authorized three biotech cornvarieties for import increasing the list ofapproved varieties to 10 for food use and 14for feed use. These are the first approvalssince the European Union ended a six-yearmoratorium on new biotech products in 2004.However, the European Union is facing asignificant shortage of feed products due tonatural disasters that significantly reducedregional production. It is estimated thatEurope will need 17 to 18 million metric tonsof feed grains next year. The slow pace ofapprovals of new biotech varieties threatens toturn the European Union into a net meatimporting region of the world as early as 2009given this projected feed shortage.Regional Trade AgreementsRegional trade agreements have been and willbe a significant factor in expanding exportmarkets. Exports of refined corn products tothe Western Hemisphere should increasesignificantly due to implementation of theUnited States-Central American-DominicanRepublic Free Trade Agreement (CAFTA-DR).Tariffs on corn starch, corn oil, glucose anddextrose, and corn gluten feed and meal wereeliminated when CAFTA-DR wasimplemented in 2005. Exports to CAFTA-DRcountries increased nearly 60% between 2005and 2006 to about $36 million. If the firstthree quarters of 2007 are indicative of theexpected growth rate for 2007, again we willJames P. ZallieChairman of the Board<strong>Corn</strong> Refiners AssociationGroup Vice President,National Starch andChemical Company2007 <strong>Corn</strong> Annual | 7
see a better-than-50% increase in exports ofrefined corn products to this region this year.It is hoped that Congress will further boostU.S. food and agricultural exports by ratifyingagreements with Peru, Colombia, Panama andSouth Korea. While the House has passed theagreement with Peru, Senate passage must besecured to implement it. When the Peru FTAbecomes effective, tariffs on corn gluten feedand meal will be reduced to zero. Duties onother corn products, including corn oil, cornsweeteners and corn starch will be phased outover the life of the agreement. U.S. exports ofrefined corn products to Peru have averaged$830,000 over the past five years, but areexpected to increase significantly under thedeal.Since the North American Free TradeAgreement (NAFTA) was implemented,exports of refined corn products to Canadahave increased two and a half times from avalue of about $71 million to $178 million.And while corn sweetener exports werehampered for several years due to alongstanding sweetener dispute, overallexports to Mexico of refined corn productshave nearly doubled since the passage of theNAFTA in 1994 from about $118 million to$237 million.Value of the DollarThe decline of the value of the U.S. dollaragainst the Euro and major internationalcurrencies in Asia will continue to bode wellfor exports of U.S. refined corn products.Even though the rise in the price of corn hasled to an increase in prices for refined cornproducts, importing countries find U.S.exports attractive due to the relative value ofthe dollar.U.S. farm exports as a whole are growingexponentially. This year they are at a record$79 billion, up more than $25 billion from fiveyears earlier. The U.S. Department ofAgriculture has raised its projection of U.S.agricultural exports for the year 2015 from $84billion to $93 billion.Global DevelopmentsWhen taking a look at potential export marketspoised for growth, China must be considered.The rate of growth of China’s own cornrefining industry has been phenomenal. InRefined <strong>Corn</strong> Exports 1989 – 2006$1.6$1.5$1.4(in billions)$1.3$1.2$1.1$1.08 | 2007 <strong>Corn</strong> Annual
2001, China’s corn refiners had a capacity of2.8 million tons. It is estimated that China’scorn refining capacity will reach 24.5 milliontons this year, which is about 20% of thecountry’s corn production. The industry hasevolved at such a swift pace that thegovernment has imposed restrictions on anynew or planned construction. Through 2010,the Chinese government has set a limit on theproportion of national corn output that can beprocessed to 26%.Over the past 10 years, the value of U.S.refined corn exports to China has increasedsignificantly, from about $8.5 million in 1996to nearly $29.5 million in 2006. China doeshave a strong corn refining industry andnearby reliable suppliers of starch (tapiocastarch from Thailand and Vietnam). However,food costs in China are surging and theChinese government is determined to controlfood inflation for social stability and managedgrowth. If China’s corn refining industrycannot sustain growth and locally producedfood inflation bites consumers, the Chinesegovernment will intervene by subsidizingimports of refined corn products from theUnited States. Given the rate at which theChinese economy is growing, opportunities togrow this export market are apparent.OutlookThe outlook for growth in refined cornexports is positive due to a number of factors.The U.S. industry has a stable supply of highquality corn—a critical factor in theproductivity of corn wet millers, the quality ofour products and the ability to meet customerdemand. Our industry continues to invest inproduct development to meet the needs of ourcustomers, both domestic and international.Regional free trade agreements reducebarriers and present real opportunities forexport growth. The value of the U.S. dollarmakes exports of high-quality productsexceptionally attractive to countries shoppingfor ingredients to increase the quality of theirfood supply. These factors, combined withthe economic and population growth expectedin many parts of the world, present a clearsignal that exports of the U.S. corn refiningindustry are headed up.World <strong>Corn</strong> Production,Consumption & StocksPRODUCTIONArgentinaBrazilCanadaChinaEgyptEthiopiaEU-27IndiaIndonesiaMexicoNigeriaPhilippinesRepublic of South AfricaUkraineVietnamOthersUnited StatesTOTALCONSUMPTIONArgentinaBrazilCanadaChinaEgyptEU-27IndiaIndonesiaJapanRepublic of KoreaMexicoNigeriaPhilippinesRepublic of South AfricaUkraineOthersUnited StatesTOTALENDING STOCKSBrazilCanadaChinaEU-27IranMexicoRepublic of South AfricaOthersUnited StatesTOTAL2005/0615,80041,7009,361139,3655,9324,00061,15314,7106,50019,5007,0005,8846,9357,1503,81865,245282,311696,3646,20039,50010,837137,00010,10061,50014,2007,90016,7008,57927,9006,8005,8008,2005,100104,189232,063704,0293,0152,00135,2559,9341,3132,7072,30816,51849,968123,0192006/0722,50051,0008,990145,4805,9405,00054,64714,9806,70022,0007,8006,2306,7006,4004,31267,169267,598703,4466,70041,00011,436143,00010,50061,10014,6007,90016,5008,83330,3007,6006,3008,6005,250108,509230,783721,4824,2151,34332,4829,8311,7133,2071,30817,76733,117104,983Source: USDA, Foreign Agricultural ServiceBased on local marketing years in thousands of metric tons.2007 <strong>Corn</strong> Annual | 9
A Global Outlook for Refined <strong>Corn</strong> ProductsSakharam K. Patil, Ph.D.President, S.K. Patil &AssociatesThomas L. Friedman, author of “TheWorld is Flat: A Brief History of theTwenty First Century,” theorized thatwe inhabit a “flat” world where globalizationhas leveled the playing field betweenindustrial and emerging market countries forefficient economical and technologicaltransformation. This has createdunprecedented growth opportunities for theeconomic and industrial infrastructure aroundthe world. When I left India in the late 1960s,the country was in a dismal state with percapita income of approximately 50 dollars peryear with very little hope for a rural boy suchas myself. However, today I have seen changein every field and economic structure.According to Forbes, India’s GDP hassurpassed 1 trillion dollars and the grosspurchasing power is greater than 3 trilliondollars growing at a rate of 9% annually. Theimmigrants who came for new opportunitiesfrom India to the United States are nowparticipating in a reverse migration.My personal story aside, the emerging powerof high income segments of China, India andother parts of world has created enormousdemands for energy, consumer and industrialproducts to meet the needs of higher standardsof living that call for convenience and comfortonly available so far to the western developedworld. Broad-based economic growthresulting from rising incomes, rapidurbanization and relatively high populationgrowth result in a higher propensity toconsume in the developing markets, wherechanges in dietary habits are leading todemands on processed foods and industrialproducts. The corn refining industry is poisedto be at the forefront of this change.Biorefineries: An ImportantLink in the Global EconomyBiobased products from corn using corn wetmilling technology and other similarbioprocess technologies from renewable plantand ocean sources have the most promisinggrowth potential globally. The most strikingexamples are ethanol for fuel and foodsweeteners. Besides theses high volumecommodity products, corn refining plants arehighly sophisticated bioprocess operations thatproduce a range of products such as citricacids, lactic acids, amino acids, xanthan gums,polyols and a variety of other products. Inaddition, corn refiners have the ability toproduce a number of items that help reduceour dependence on petroleum-based productssuch as 1,3 propendiol (PDO) a monomer for 3GT used to create synthetic fiber, polylacticacid (PLA) used to make biodegradable film toreplace plastic film and plyhydroxyalkanoates(PHAs), which are polymers that can beformed much like traditional plastic. Therewill be many more to come as the sciencematures.Carbohydrate-based products have thepotential to improve the sustainability ofnatural resources, environmental quality andnational security while competingeconomically to expand the U.S. and worldindustrial base. Biobased products have a widerange of uses in energy and intermediatechemicals for food, industrial, consumer andpharmaceutical applications. Agriculturalproducing rural areas are well positioned tosupport regional processing facilitiesdependent on locally grown crops.<strong>Corn</strong> refineries possess the qualities tocomprise the front end of an industrialcomplex that produces food, specialtychemicals, industrial products, fuels andpharmaceuticals. Such an expandedbiorefinery would provide cleaner and moreeconomical processes for producing existingproducts, new intermediates for manufacturingnew products and an expanded stable marketfor wet millers and for corn farmers. A largecorn wet-milling plant with its own steam andelectric cogeneration station can form thenucleus for several other plants. The wet millis the source of materials for plants thatproduce industrial enzymes, organic acids,amino acids and ethanol. The enzymes arethen used to convert starch to lower molecularweightproducts, principally variousmaltodextrins and syrups. The organic acidsare used in processed foods, detergents andpolymers. The amino acids are used as feedand food supplements and, in the case ofphenylalanine, to make aspartame. The ethanolis used as a fuel or an industrial solvent.10 | 2007 <strong>Corn</strong> Annual
Factors That Will ImpactGrowth of the IndustryThe recent growth of the corn wet millingindustry has slowed in the United Statescompared to the frantic pace in the 1980swhen food and beverage manufacturers werediscovering the benefits of high fructose cornsyrup and ethanol began to replace MTBE.While ethanol production is currently growingfaster than other product segments, it is thefood and pharmaceutical markets that areexpected to be the most important to the cornrefining industry in the United States.Globally, Asia, Eastern Europe and SouthAmerica are growing at a fast pace, which isexpected to continue for the next severalyears. In these regions, food as well asindustrial products will be important growthmarkets for refined corn products. Asia willbe the largest growth area due to its sheerpopulation size. The most surprisingdevelopment has been the growth of the paperindustry in China with very limited forestresources. China’s paper industry growth wasborn out of imported recycled fiber, but nowplantations will fuel the paper and corrugatingindustry expansion. U.S. corn refiners are in agood position to utilize their technologicaladvantage and participate in the global growthfor food and industrial products.Health and NutritionThe worldwide obesity epidemic has become amajor health concern along with diabetes.Unfortunately, carbohydrates are frequently,and erroneously, uniquely blamed for both.Another major health issue is gut health, anarea of science which focuses on thepromotion of the normal function of thegastrointestinal tract and the prevention ofserious diseases in the long term.Great opportunities exist for corn refiners tooffer solutions to the problem by developingstarches that offer low or slow digestibility and<strong>Corn</strong>: Food & Industrial UsesYearHFCSGlucose &DextroseStarchFuelAlcoholBeverageAlcoholCereals &Other ProductsTotal19903792002193491351241,40619913922102253981611281,51419924152142184261361291,53819934412192254581101401,59319944592242305331001501,69619954732272263961251611,60819964922332384291301721,69419975132292464811331821,78419985302192405261271841,82619995402222515661301851,89420005302182476281301851,93820015412172467061311862,02720025322192569961311872,32120035302282711,1681321872,51620045212222791,3231331892,66720055292292751,6031351902,96120065102392722,1171361903,46420075152432803,2001371934,568In million bushelsSource: USDA - Economic Research Service. Year beginning Sept. 1.2007 <strong>Corn</strong> Annual | 11
low glycemic response to combat obesity anddiabetes. The World Health Organizationestimates globally there were 1.6 billion adultsoverweight in 2005 and at least 400 millionwere obese. The WHO further projects that by2015, 2.3 billion adults will be overweight andmore than 700 million will be obese globally.Starch is generally classified as rapidlydigestible (RDS), slowly digestible (SDS) andresistant starch (RS). Development of SDS hasdrawn attention due to its benefits incontrolled and sustained release of glucoseinto the blood stream. This is important forpeople with Type II diabetes who suffer frominconsistent insulin response afterconsumption of readily digestible starch.RS escapes digestion in the small intestine, isinsoluble, is fermented in the large intestineand is a prebiotic fiber, providing some of thehealth benefits of both soluble and insolublefiber. As a prebiotic fiber, RS selectivelyincreases beneficial bacteria for maintaining orimproving digestive health. RS can be used infood and beverages for diabetics to effectivelyreduce serum blood glucose and insulin levels.Recent studies also suggest that RS mayincrease fat oxidation after a meal, animportant tool in weight management.Opportunities for developing economicsources and main stream applications of RSand SDS remain attractive. The challenge forcorn refiners, grain/flour and tuber processors,is to incorporate RS and SDS properties intograin and flour as mainstream large volumecommodities to offer solutions world wide.Obesity and diabetes in the United States andabroad cannot be solved by offering niche highprice ingredients. Advancement in theknowledge of genetic control of starchsynthesizing enzymes and their biosyntheticpathways can improve mainstreamcommodities such a grains, flour, syrups andstarches and can create tremendousopportunities for refined corn products.BiotechnologyBiotechnology holds great promise to enhanceour lives and the planet. With a worldpopulation expected to reach nearly ninebillion by 2050, biotechnology offers newpotential for sustainable living, healthy eatingand battling diseases while reducing ourfootprint on the planet. Genetic engineeringand plant breeding techniques permit theredesign of crops for easier processing andcreation of new types of raw materials. Sourceplants can be modified or selected forcharacteristics that enhance their conversion touseful industrial products. Through geneticengineering, plant cellular processes andcomponents can be altered in ways thatincrease the value or uses of the modifiedcrop. This capability has no parallel inpetroleum-based feedstock systems and is amajor advantage of biobased industrialproducts.There are developments under way viagenomic routes to create starch with propertiessimilar to chemically modified starcheseliminating the need for chemicalmodifications. One example is starch withhigh monophosphate that can enhanceviscosity, film forming and other novelfunctions for food, paper and adhesiveapplications. Similar developments canproduce encapsulation and emulsificationproperties for starches to be used in controlleddelivery of drugs, skin care and many similarapplications.Future OutlookBiorefineries to convert corn into a myriad ofvalue added products have to follow apetrochemical business and operating model toeconomically produce several productsefficiently. There are parallels between thepetroleum refineries and corn wet milling.Petroleum refineries invariably produce moreand more products from the same feedstockover time, thereby diversifying outputs;refineries are flexible and can shift outputs inresponse to market needs, processes inrefineries improve incrementally over time;and process improvement invariably makes thecost of raw material the dominant factor inoverall system economics.<strong>Corn</strong> wet mill operations have a single feedstock, corn. Product selection is based onmarket demand, availability of feed stock,processing equipment and process engineering12 | 2007 <strong>Corn</strong> Annual
2007 <strong>Corn</strong> Annual | 13AK, CT, HI, ME, MA, NV, NH, RI, VT not estimatedSource: USDA - National Agricultural Statistics ServiceStateALAZARCACODEFLGAIDILINIAKSKYLAMDMIMNMSMOMTNENJNMNYNCNDOHOKORPASCSDTNTXUTVAWAWVWIWYUSAREAHARVESTEDThousand AcresYIELDBushel Per AcrePRODUCTIONThousand Bushels200616518180110860161302256511,1505,38012,3503,0001,0402904251,9606,8503252,630187,75064454807401,4002,960220299602903,2205001,4501734575262,8004570,648200520022230110950154282306011,9505,77012,5003,4501,1803304002,0206,8503652,970178,25062554607001,2003,250250259602853,9505951,8501236080282,9004975,1072006721701461651561458211217016315716611514614014214716111013814615212918512913211115910518012211097125121157120210120143129149.1200412318014017513515290130170180168181150152135153134159136162143166143180122117105158150170140100130140139155145200131136131160.4200511919513117214814394129170143154173135132136135143174129111148154122175124120129143115160122116119130114163118205109148140147.9200611,8803,06026,28018,150134,16023,3452,46025,20011,0501,817,450844,6602,050,100345,000151,84040,60060,350288,1201,102,85035,750362,9402,6281,178,0008,2568,32561,92097,680155,400470,64023,1005,220117,12031,900312,34062,500175,4502,66941,40015,7503,120400,4005,80510,534,868200423,9854,86042,70026,250140,40023,2562,88036,40012,7502,088,000929,0402,244,400432,000173,28055,35065,025257,2801,120,95059,840466,5602,1451,319,70010,29610,44061,00086,580120,750491,38030,0004,760137,20029,500539,50086,100233,5201,86052,20021,0003,799353,6006,55011,807,086200523,8004,29030,13018,920140,60022,0222,63229,67010,2001,708,850888,5802,162,500465,750155,76044,88054,000288,8601,191,90047,085329,6702,5161,270,5007,5649,62557,04084,000154,800464,75028,7504,000117,12033,060470,05077,350210,9001,95642,48016,4003,052429,2006,86011,112,0722004195273051501,040153322807511,6005,53012,4002,8801,1404104251,9207,0504402,880157,95072585007401,1503,110200289802954,1506151,68012360105292,6005073,631<strong>Corn</strong> for Grain: Yield and Production
to operate efficiently and cost effectively.Continuous process improvements areessential to operate efficiently where the costof raw material remains a dominant factor. Thebenefits of some of these biobased productsare well known (e.g., enzymes). At the sametime, rapid advances occurring in the life andmaterials sciences will lead to discoveries ofplant compounds that cannot be produced withpetroleum feed stocks. Industry willvigorously pursue the most promisingcandidates for further development andcommercialization.Plant sizes and scale of operations in newdeveloping economies are small andinefficient. U.S. companies have startedinvesting in these regions with more efficientoperations and technologies. Opportunities forbiotechnology will remain strong, especially tocreate novel technologies using biosyntheticpathways and to create new carbohydratepolymers to meet the demands of global anddemographic changes outside westernsocieties.Refined corn ingredients can meet the needs ofhealth conscious and convenience drivensegments of large populations in Asia, SouthAmerica and Africa. The U.S. corn refiningindustry has the expertise, technologies andthe ability to produce new products for food,nutrition and industrial applications to capturethe opportunities worldwide.Dr. Patil has more than 30 years of experiencein quality assurance, research, productdevelopment, marketing and technologytransfer in the corn wet milling industry.Exports of Products From <strong>Corn</strong> – 2006Product<strong>Corn</strong> meal<strong>Corn</strong> starch<strong>Corn</strong> oil, crude<strong>Corn</strong> oil, once refined<strong>Corn</strong> oil, fully refinedGlucose (dextrose)Glucose syrup not containingfructose or containing in the drystate less than 20% fructoseGlucose syrup with 20-50% fructoseChemically pure fructoseFructose syrup with 50%+ fructoseFructose solids containingmore than 50% fructoseBran, sharps and other residues<strong>Corn</strong> gluten feed<strong>Corn</strong> gluten mealOther residues of starchmanufacturing<strong>Corn</strong> oil cakeDextrinsModified starches derivedfrom corn starch2006369,632,350134,507,439188,885,18911,192,051157,044,857100,947,361294,960,18670,295,69698,704,359384,422,6977,595,186143,9732,387,836924,055243,62510,309,71525,391,455209,053,043UnitsKilogramsKilogramsKilogramsKilogramsKilogramsKilogramsKilogramsKilogramsKilogramsKilogramsKilogramsMetric tonsMetric tonsMetric tonsMetric tonsKilogramsKilogramsKilogramsValue$69,945,550$60,258,587$120,361,561$10,626,957$115,174,303$52,161,822$86,373,598$19,123,253$73,046,366$102,549,362$24,805,540$16,967,702$231,316,148$292,034,892$28,784,509$1,262,616$19,525,735$151,989,595Source: U.S. Department of Commerce14 | 2007 <strong>Corn</strong> Annual
<strong>Corn</strong> Refiners Association Member Company ProductsArcher DanielsMidland CompanyCargill,Incorporated<strong>Corn</strong> ProductsInternational, Inc.National Starchand ChemicalCompanyPenfordCorporationRoquette America,Inc.Tate & LyleIngredientsAmericas, Inc.STARCH PRODUCTSUnmodified, food• • • • • • •Unmodified, industrial• • • • • • •Modified, food• • • • • •Modified, industrial• • • • • • •Dextrins• • • • • • •CyclodextrinsREFINERY PRODUCTSGlucose syrups• • •••• •Maltodextrins• • •• • •Dextrose monohydrate• • •• • •Dextrose anhydrous• ••HFCS-42• • •• •HFCS-55• • •• •Crystalline fructose• •CO-PRODUCTSCrude Oil• • •Refined Oil• • •<strong>Corn</strong> gluten feed• • • • • • •<strong>Corn</strong> gluten meal• • • • • • •<strong>Corn</strong> germ or corn germ meal • • • • • • •Steepwater (CFCE)• • • • • • •Carbon dioxide• •FERMENTATION AND OTHER CHEMICALSCitric acid• • •Lactic acid• •LysineThreonineXanthan gum••• • •Erythritol•SorbitolXylitol• • • ••Mannitol• • •Maltitol• ••Hydrogenated starch hydrolysatesGlucose hydrolysatesOTHER••Ethanol, fuel/industrial• • •Ethanol, beverage•Product lists are accurate as of publication date, but may change with time.Also available online at http://www.corn.org/memberproductlines.htm.2007 <strong>Corn</strong> Annual | 15
<strong>Corn</strong> Refiners Association Member CompanyDomestic and International Plant LocationsArcher DanielsMidland CompanyP.O. Box 1470Decatur, Illinois 62525Domestic Plants:Cedar Rapids, Iowa 52404Clinton, Iowa 52732Columbus, Nebraska 68601Decatur, Illinois 62525Marshall, Minnesota 56258-2744International Plant:Guadalajara, Jalisco, MexicoCargill, IncorporatedP.O. Box 5662/MS62Minneapolis, Minnesota 55440-5662Domestic Plants:Blair, Nebraska 68008-2649Cedar Rapids, Iowa 52406-2638Dayton, Ohio 45413-8001Decatur, Alabama 35601Eddyville, Iowa 52553-5000Hammond, Indiana 46320-1094Memphis, Tennessee 38113-0368Wahpeton, North Dakota 58075International Plants:Uberlandia, Minas Gerais, BrazilSong Yuan, ChinaHaubourdin, Pas-de-Calais, FranceKrefeld, Nordrhein-Westfalen,GermanyCastelmassa, Veneto, ItalyMartorell, Barcelona, SpainEfremov, Tula, RussiaBergen Op Zoom, Noord-Brabant,The NetherlandsSas van Gent, Zeeland, TheNetherlandsOrhangasi, Bursa, TurkeyManchester, England, UnitedKingdom<strong>Corn</strong> ProductsInternational, Inc.5 Westbrook Corporate CenterWestchester, Illinois 60154Domestic Plants:Bedford Park, Illinois 60501-1933Stockton, California 95206-0129Winston-Salem, NorthCarolina 27107International Plants:Cardinal, Ontario, CanadaLondon, Ontario, CanadaPort Colborne, Ontario, CanadaGuadalajara, Jalisco, MexicoSan Juan del Rio, Queretaro,MexicoTlalnepantla, Mexico State, MexicoBaradero, Buenos Aires, ArgentinaChacabuco, Buenos Aires,ArgentinaBalsa Nova, Parana, BrazilCabo, Pernambuco, BrazilMogi-Guacu, Sao Paulo, BrazilLlay-Llay, Valparaiso, ChileCali, Valle del Cauca, ColombiaLima, PeruEldoret, Rift Valley, KenyaIcheon, Kyungigi-do, South KoreaIncheon, Bupyong-ku, South KoreaFaisalabad, Punjab, Pakistan<strong>Corn</strong>wala, Punjab, PakistanNational Starch andChemical Company10 Finderne AvenueBridgewater, New Jersey 08807-0500Domestic Plants:Indianapolis, Indiana 46221North Kansas City, Missouri 64116International Plants:Trombudo Central, BrazilHamburg, GermanyPenford Products Co.(A company of Penford Corporation)P.O. Box 428Cedar Rapids, Iowa 52406-0428Domestic Plant:Cedar Rapids, Iowa 52404-2175International Plants:Lane Cove, Sydney, AustraliaOnehunga, Auckland, New ZealandRoquette America, Inc.1417 Exchange StreetP.O. Box 6647Keokuk, Iowa 52632-6647Domestic Plant:Keokuk, Iowa 52632-6647International Plants:Lestrem, Pas-de-Calais, FranceBeinheim, Bas-Rhin, FranceCassano Spinola, Alessandria, ItalyBenifayo, Valencia, SpainCalafat, Dolj, RomaniaTate & Lyle IngredientsAmericas, Inc.(A subsidiary of Tate & Lyle, PLC)P.O. Box 151Decatur, Illinois 62525Domestic Plants:Decatur, Illinois 62521Fort Dodge, Iowa 50501Lafayette, Indiana 47902Lafayette, Indiana 47905Loudon, Tennessee 37774International Plant:Guadalajara, Jalisco, Mexico16 | 2007 <strong>Corn</strong> Annual
Honorary DirectorsMartin AndreasArcher Daniels Midland CompanyFred M. AshCerestar USA, Inc.C.G. CaldwellNational Starch and Chemical CompanyPaul E. GrunderCPC International Inc.Patric J. McLaughlinCerestar USA, Inc.E.S. MicekCargill TrusteesG.M. MitchellCargill TrusteesDonald E. NorlundA.E. Staley Manufacturing CompanyWilliam H. PowellNational Starch and Chemical CompanyRobert M. PowersA.E. Staley Manufacturing CompanyH. T. ReedPenford Products Co.John G. Reed, Jr.Archer Daniels Midland CompanyJohn RiceArcher Daniels Midland CompanySamuel C. Scott<strong>Corn</strong> Products International, Inc.Michael A. UrbanicCargill, IncorporatedRichard Vandervoort<strong>Corn</strong> Products International, Inc.<strong>Corn</strong> Annual Editor/DesignerShannon Shoesmith McNamara
<strong>Corn</strong> Refiners Association 1701 Pennsylvania Ave., N.W. Suite 950 Washington, D.C. 20006-5805tel. (202) 331-1634 fax (202) 331-2054 www.corn.orgwww.HFCSfacts.com