ST 412/512 – Midterm Exam w: Key (00) – Methods of Data Analysis II
ST 412/512 – Midterm Exam w: Key (00) – Methods of Data Analysis II
ST 412/512 – Midterm Exam w: Key (00) – Methods of Data Analysis II

You also want an ePaper? Increase the reach of your titles
YUMPU automatically turns print PDFs into web optimized ePapers that Google loves.
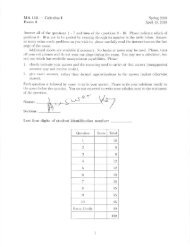
Part B. Acorn data (questions worth 6 points each). Below is a plot <strong>of</strong>Y = log <strong>of</strong> the species range area (1<strong>00</strong>×km 2 ), versusX 1 = log <strong>of</strong> the acorn (seed) volume (cm 3 )for species <strong>of</strong> oak trees from Atlantic and California regions. The species with the smallest Y(species #7) is only found on an island so its range area cannot possibly exceed the area <strong>of</strong> theisland.log <strong>of</strong> Range Area4 6 8 10Regionwith # 7without #7AtlanticCaliforniaspecies # 7-1 0 1 2 3Log <strong>of</strong> Acorn Size11. Based on the scatterplot, circle the letter for the one sentence that describes the probableinfluence <strong>of</strong> species # 7.a) The species is probably not influential.b) The interactive effect <strong>of</strong> log acorn size and region (Atlantic or California) is substantiallymore significant when the species is included than when it is not included.c) The interactive effect <strong>of</strong> log acorn size and region is substantially less significant when thespecies is included than when it is not included.Page 2 <strong>of</strong> 5