ST 412/512 – Midterm Exam w: Key (00) – Methods of Data Analysis II
ST 412/512 – Midterm Exam w: Key (00) – Methods of Data Analysis II
ST 412/512 – Midterm Exam w: Key (00) – Methods of Data Analysis II

You also want an ePaper? Increase the reach of your titles
YUMPU automatically turns print PDFs into web optimized ePapers that Google loves.
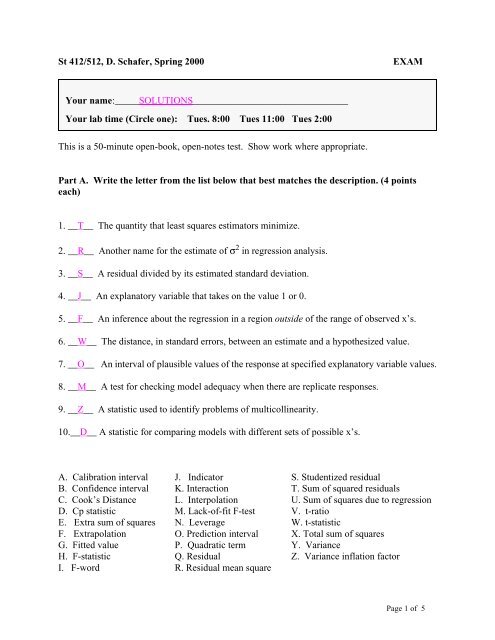
St <strong>412</strong>/<strong>512</strong>, D. Schafer, Spring 2<strong>00</strong>0EXAMYour name:_____SOLUTIONS________________________________Your lab time (Circle one): Tues. 8:<strong>00</strong> Tues 11:<strong>00</strong> Tues 2:<strong>00</strong>This is a 50-minute open-book, open-notes test. Show work where appropriate.Part A. Write the letter from the list below that best matches the description. (4 pointseach)1. __T__ The quantity that least squares estimators minimize.2. __R__ Another name for the estimate <strong>of</strong> σ 2 in regression analysis.3. __S__ A residual divided by its estimated standard deviation.4. __J__ An explanatory variable that takes on the value 1 or 0.5. __F__ An inference about the regression in a region outside <strong>of</strong> the range <strong>of</strong> observed x’s.6. __W__ The distance, in standard errors, between an estimate and a hypothesized value.7. __O__ An interval <strong>of</strong> plausible values <strong>of</strong> the response at specified explanatory variable values.8. __M__ A test for checking model adequacy when there are replicate responses.9. __Z__ A statistic used to identify problems <strong>of</strong> multicollinearity.10.__D__ A statistic for comparing models with different sets <strong>of</strong> possible x’s.A. Calibration interval J. Indicator S. Studentized residualB. Confidence interval K. Interaction T. Sum <strong>of</strong> squared residualsC. Cook’s Distance L. Interpolation U. Sum <strong>of</strong> squares due to regressionD. Cp statistic M. Lack-<strong>of</strong>-fit F-test V. t-ratioE. Extra sum <strong>of</strong> squares N. Leverage W. t-statisticF. Extrapolation O. Prediction interval X. Total sum <strong>of</strong> squaresG. Fitted value P. Quadratic term Y. VarianceH. F-statistic Q. Residual Z. Variance inflation factorI. F-word R. Residual mean squarePage 1 <strong>of</strong> 5
Part B. Acorn data (questions worth 6 points each). Below is a plot <strong>of</strong>Y = log <strong>of</strong> the species range area (1<strong>00</strong>×km 2 ), versusX 1 = log <strong>of</strong> the acorn (seed) volume (cm 3 )for species <strong>of</strong> oak trees from Atlantic and California regions. The species with the smallest Y(species #7) is only found on an island so its range area cannot possibly exceed the area <strong>of</strong> theisland.log <strong>of</strong> Range Area4 6 8 10Regionwith # 7without #7AtlanticCaliforniaspecies # 7-1 0 1 2 3Log <strong>of</strong> Acorn Size11. Based on the scatterplot, circle the letter for the one sentence that describes the probableinfluence <strong>of</strong> species # 7.a) The species is probably not influential.b) The interactive effect <strong>of</strong> log acorn size and region (Atlantic or California) is substantiallymore significant when the species is included than when it is not included.c) The interactive effect <strong>of</strong> log acorn size and region is substantially less significant when thespecies is included than when it is not included.Page 2 <strong>of</strong> 5
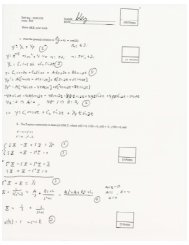
19. The following is the fit to model D (recall: Y = log area, X 1 = log acorn volume):µ(Y|X 1 ,X 2 ) = 5.7 + 2.8X 1 + .63X 2 .Which <strong>of</strong> the following is the best interpretation <strong>of</strong> the effect <strong>of</strong> acorn volume.SHOW WORK then circle the correct answer.2.82 = 7.0see p. 208a) Associated with each one cm 3 increase in acorn volume is a 2.8 ×1<strong>00</strong> km 2 increase in the meanrange area.b) Associated with each one cm 3 increase in acorn volume is a .63×1<strong>00</strong> km 2 increase in the meanrange area.c) Associated with each doubling in acorn volume is a 2.8 ×1<strong>00</strong> km 2 increase in the mean rangearea.d) Associated with each doubling in acorn volume is a .63 ×1<strong>00</strong> km 2 increase in the mean rangearea.e) Associated with each doubling in acorn volume is a 1.9 ×1<strong>00</strong> km 2 increase in the mean rangearea.f) Associated with each doubling in acorn volume is a 7-fold change in the median range area.g) Associated with each doubling in acorn volume is a 16-fold change in the median range area.20. Suppose there are 3 regions. Let X 2 = 1 if a species is from the Atlantic region, and 0 otherwise;let X 3 = 1 if a species is from the midwest region and 0 otherwise; and let X 4 = 1 if aspecies is from the California region, and 0 otherwise. Write down a model that specifies 3parallel lines for the regression <strong>of</strong> Y on X 1 , using the midwest region as the “reference level.”µ(Y|X 1 ,X 2 ,X 3 ,X 4 ) = β 0 + β 1 + β 2 X 2 + β 3 X 4_____________________________Page 5 <strong>of</strong> 5
POINT DI<strong>ST</strong>RIBUTION SUMMARYLower quartile = 69.5Median = 73Upper quartile = 84LETTER GRADE SCORINGA 84-1<strong>00</strong>A- 77-83B+ 70-76B 60-69B- 50-59C+ 40-59C 35-39Page 6 <strong>of</strong> 5