SkanIt Software
SkanIt 06_0203006.indd - AB Ninolab
SkanIt 06_0203006.indd - AB Ninolab
- No tags were found...

Create successful ePaper yourself
Turn your PDF publications into a flip-book with our unique Google optimized e-Paper software.
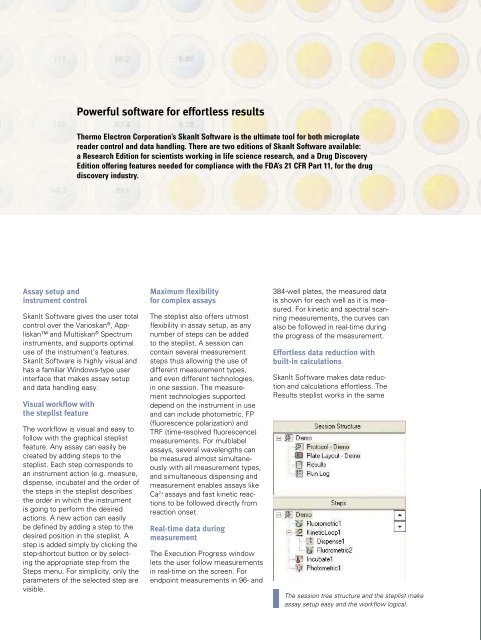
Powerful software for effortless resultsThermo Electron Corporation’s <strong>SkanIt</strong> <strong>Software</strong> is the ultimate tool for both microplatereader control and data handling. There are two editions of <strong>SkanIt</strong> <strong>Software</strong> available:a Research Edition for scientists working in life science research, and a Drug DiscoveryEdition offering features needed for compliance with the FDA’s 21 CFR Part 11, for the drugdiscovery industry.The measurement can be followed inreal-time on the screen.Kinetic or spectral scanning curvesfrom different samples can be combinedfor data comparison.Assay setup andinstrument control<strong>SkanIt</strong> <strong>Software</strong> gives the user totalcontrol over the Varioskan ® , Appliskanand Multiskan ® Spectruminstruments, and supports optimaluse of the instrument’s features.<strong>SkanIt</strong> <strong>Software</strong> is highly visual andhas a familiar Windows-type userinterface that makes assay setupand data handling easy.Visual workflow withthe steplist featureThe workflow is visual and easy tofollow with the graphical steplistfeature. Any assay can easily becreated by adding steps to thesteplist. Each step corresponds toan instrument action (e.g. measure,dispense, incubate) and the order ofthe steps in the steplist describesthe order in which the instrumentis going to perform the desiredactions. A new action can easilybe defined by adding a step to thedesired position in the steplist. Astep is added simply by clicking thestep-shortcut button or by selectingthe appropriate step from theSteps menu. For simplicity, only theparameters of the selected step arevisible.Maximum flexibilityfor complex assaysThe steplist also offers utmostflexibility in assay setup, as anynumber of steps can be addedto the steplist. A session cancontain several measurementsteps thus allowing the use ofdifferent measurement types,and even different technologies,in one session. The measurementtechnologies supporteddepend on the instrument in useand can include photometric, FP(fluorescence polarization) andTRF (time-resolved fluorescence)measurements. For multilabelassays, several wavelengths canbe measured almost simultaneouslywith all measurement types,and simultaneous dispensing andmeasurement enables assays likeCa 2+ assays and fast kinetic reactionsto be followed directly fromreaction onset.Real-time data duringmeasurementThe Execution Progress windowlets the user follow measurementsin real-time on the screen. Forendpoint measurements in 96- and384-well plates, the measured datais shown for each well as it is measured.For kinetic and spectral scanningmeasurements, the curves canalso be followed in real-time duringthe progress of the measurement.Effortless data reduction withbuilt-in calculations<strong>SkanIt</strong> <strong>Software</strong> makes data reductionand calculations effortless. TheResults steplist works in the sameThe session tree structure and the steplist makeassay setup easy and the workflow logical.intuitive way as in the assay setupsection, and gives you control overa comprehensive set of built-in calculations.These calculations includeBlank Subtraction; Multipointreduction; Curve Fit with 8 differentfit types including 1 to 4 degreepolynomials, cubic spline and fourparameter logistics; Cut-Off with upto 5 user defined limits; EffectiveDose; Kinetic Processors for reductionof kinetic data; Ratio/Inhibition;Spectral Reduction for spectralscanning data calculations andQuality Control (QC). Additionally,the User Equation calculator, whichworks just like a pocket calculator,can be used for easy creation ofcustom-made calculations.Comprehensive reportsand easy export of dataBoth measurement results andcalculated data can be displayed intable and list format for easy interpretationand analysis. For kineticand spectral scanning data graphsare displayed, and graphs fromdifferent wells can easily be combined.Data can be exported eithermanually or automatically in .pdf,.txt and .xls format for use in othersystems such as Microsoft ® Excel.Alternatively, extensive reports canbe created using the Report generator.In the Drug Discovery Edition,such reports can be electronicallysigned.Data reduction iseasily set up byadding calculationsteps to theResults steplist.The familiar pocketcalculator screenis used for easysetup of QC, Cut-Off and User Equationcalculations.Integration withautomated systems<strong>SkanIt</strong> <strong>Software</strong> offers a specialremote control interface for integrationwith LIMS and automatedsystems. The remote interface hasbeen implemented as a generic,automation system independent,ActiveX ® dll component, whichallows easy integration with differentrobotic systems.