<strong>Green</strong> <strong>Street</strong>’s Disclosure InformationAnalyst Certification – I, Mike Kirby, hereby certify that all of <strong>the</strong> views expressed <strong>in</strong> this research report accurately reflect my personal views about any and all of <strong>the</strong> subject companiesor securities. I also certify that no part of my compensation was, is, or will be directly or <strong>in</strong>directly related to <strong>the</strong> specific recommendation(s) or view(s) <strong>in</strong> this report.Issuers of this Report: US and EEA: This report has been prepared by analysts work<strong>in</strong>g for <strong>Green</strong> <strong>Street</strong> <strong>Advisors</strong> (GSA (US)) and/or <strong>Green</strong> <strong>Street</strong> <strong>Advisors</strong> (U.K.) Limited (GSA (UK)),both of which are subsidiaries of <strong>Green</strong> <strong>Street</strong> Hold<strong>in</strong>gs, Inc.This report is issued <strong>in</strong> <strong>the</strong> USA by GSA (US). GSA (UK) accepts no responsibility for this report to <strong>the</strong> extent that it is relied upon by persons based <strong>in</strong> <strong>the</strong> USA. GSA (US) isregulated by FINRA and <strong>the</strong> United States Securities and Exchange Commission, and its headquarters is located at 567 San Nicolas Drive, Suite 200, Newport Beach, CA 92660.This report is issued <strong>in</strong> <strong>the</strong> European Economic Area (EEA) by GSA (UK). GSA (US) accepts no responsibility for this report to <strong>the</strong> extent that it is relied upon by personsbased <strong>in</strong> <strong>the</strong> EEA. GSA (UK) is registered <strong>in</strong> England, (Company number. 6471304), and its registered office is 22 Grosvenor Square, London, W1K 6LF. GSA (UK) is authorized andregulated by <strong>the</strong> F<strong>in</strong>ancial Services Authority <strong>in</strong> <strong>the</strong> United K<strong>in</strong>gdom and is entered on <strong>the</strong> FSA’s register (no. 482269]).References to “<strong>Green</strong> <strong>Street</strong>” <strong>in</strong> Disclosures <strong>in</strong> this section and <strong>in</strong> <strong>the</strong> O<strong>the</strong>r Important Information section apply to:● GSA (US) to <strong>the</strong> extent that this report has been dissem<strong>in</strong>ated <strong>in</strong> <strong>the</strong> USA; or● GSA (UK) to <strong>the</strong> extent that this report has been dissem<strong>in</strong>ated <strong>in</strong> <strong>the</strong> EEA by.<strong>Green</strong> <strong>Street</strong> reserves <strong>the</strong> right to update <strong>the</strong> disclosures and policies set out <strong>in</strong> this document at any time. We encourage a careful comparison of <strong>the</strong>se disclosures and policies with thoseof o<strong>the</strong>r research providers, and welcome <strong>the</strong> opportunity to discuss <strong>the</strong>m.Affiliate Disclosures: <strong>Green</strong> <strong>Street</strong> does not directly engage <strong>in</strong> <strong>in</strong>vestment bank<strong>in</strong>g, underwrit<strong>in</strong>g or advisory work with any of <strong>the</strong> companies <strong>in</strong> our coverage universe. However, <strong>the</strong>follow<strong>in</strong>g are potential conflicts regard<strong>in</strong>g our affiliates that should be considered:● <strong>Green</strong> <strong>Street</strong> is affiliated with Eastdil Secured, a real estate brokerage and <strong>in</strong>vestment bank that sometimes engages <strong>in</strong> <strong>in</strong>vestment bank<strong>in</strong>g work with companies <strong>in</strong> <strong>Green</strong> <strong>Street</strong>’scoverage universe. <strong>Green</strong> <strong>Street</strong> does not control, have ownership <strong>in</strong>, or make any bus<strong>in</strong>ess or <strong>in</strong>vestment decisions for, Eastdil Secured.●●<strong>Green</strong> <strong>Street</strong> has an advisory practice servic<strong>in</strong>g <strong>in</strong>vestors seek<strong>in</strong>g to acquire <strong>in</strong>terests <strong>in</strong> publicly-traded companies. <strong>Green</strong> <strong>Street</strong> may provide such valuation services to prospectiveacquirers of companies which are <strong>the</strong> subject(s) of <strong>Green</strong> <strong>Street</strong>’s research reports. <strong>Green</strong> <strong>Street</strong> may receive fees that are cont<strong>in</strong>gent upon <strong>the</strong> successful completion of a transactionor o<strong>the</strong>r fees for its work on behalf of prospective acquirers.An affiliate of <strong>Green</strong> <strong>Street</strong> is <strong>the</strong> <strong>in</strong>vestment manager of an equity securities portfolio on behalf of a s<strong>in</strong>gle client. The portfolio conta<strong>in</strong>s securities of issuers covered by <strong>Green</strong> <strong>Street</strong>’sresearch department. The affiliate is located <strong>in</strong> a separate office, employs an <strong>in</strong>vestment strategy based on <strong>Green</strong> <strong>Street</strong>’s published research, and does not trade with <strong>Green</strong> <strong>Street</strong>’strad<strong>in</strong>g desk.O<strong>the</strong>r Important InformationManagement of Conflicts of Interest: Conflicts of <strong>in</strong>terest can seriously imp<strong>in</strong>ge <strong>the</strong> ability of analysts to do <strong>the</strong>ir job, and <strong>in</strong>vestors should demand unbiased research. In that spirit,<strong>Green</strong> <strong>Street</strong> adheres to <strong>the</strong> follow<strong>in</strong>g policies regard<strong>in</strong>g conflicts of <strong>in</strong>terest:●●●●●<strong>Green</strong> <strong>Street</strong> employees are prohibited from own<strong>in</strong>g <strong>the</strong> shares of any company <strong>in</strong> our coverage universe.<strong>Green</strong> <strong>Street</strong> employees do not serve as officers or directors of any of our subject companies.<strong>Green</strong> <strong>Street</strong> does not commit capital or make markets <strong>in</strong> any securities.Nei<strong>the</strong>r <strong>Green</strong> <strong>Street</strong> nor its employees/analysts receives any compensation from subject companies for <strong>in</strong>clusion <strong>in</strong> our research.<strong>Green</strong> <strong>Street</strong> does not directly engage <strong>in</strong> <strong>in</strong>vestment bank<strong>in</strong>g or underwrit<strong>in</strong>g work with any subject companies.Please also have regard to <strong>the</strong> Affiliate Disclosures listed above when consider<strong>in</strong>g <strong>the</strong> extent to which you place reliance on this research report and any research recommendations madehere<strong>in</strong>.A number of companies covered by <strong>Green</strong> <strong>Street</strong> research reports pay an annual fee to receive <strong>Green</strong> <strong>Street</strong>’s research reports. <strong>Green</strong> <strong>Street</strong> may periodically solicit this bus<strong>in</strong>ess from<strong>the</strong> subject companies. In <strong>the</strong> aggregate, annual fees for GSA (US) and GSA (UK) research reports received from subject companies represent less than 3% of each of GSA (US)’s andGSA (UK)'s respective total revenues.<strong>Green</strong> <strong>Street</strong> publishes research reports cover<strong>in</strong>g issuers that may offer and sell securities <strong>in</strong> an <strong>in</strong>itial or secondary offer<strong>in</strong>g. Broker-dealers <strong>in</strong>volved with sell<strong>in</strong>g <strong>the</strong> issuer’s securities or<strong>the</strong>ir affiliates may pay compensation to GSA upon <strong>the</strong>ir own <strong>in</strong>itiative, or at <strong>the</strong> request of <strong>Green</strong> <strong>Street</strong>'s clients <strong>in</strong> <strong>the</strong> form of “soft dollars,” for receiv<strong>in</strong>g research reports published by<strong>Green</strong> <strong>Street</strong>.The <strong>in</strong>formation conta<strong>in</strong>ed <strong>in</strong> this report is based on data obta<strong>in</strong>ed from sources we deem to be reliable; it is not guaranteed as to accuracy and does not purport to be complete. Thisreport is produced solely for <strong>in</strong>formational purposes and is not <strong>in</strong>tended to be used as <strong>the</strong> primary basis of <strong>in</strong>vestment decisions. Because of <strong>in</strong>dividual client requirements, it is not, and itshould not be construed as, advice designed to meet <strong>the</strong> particular <strong>in</strong>vestment needs of any <strong>in</strong>vestor. This report is not an offer or <strong>the</strong> solicitation of an offer to sell or buy any security.<strong>Green</strong> <strong>Street</strong> <strong>Advisors</strong> is an accredited member of <strong>the</strong> Investorside sm Research Association, whose mission is to <strong>in</strong>crease <strong>in</strong>vestor and pensioner trust <strong>in</strong> <strong>the</strong>U.S. capital markets system through <strong>the</strong> promotion and use of <strong>in</strong>vestment research that is f<strong>in</strong>ancially aligned with <strong>in</strong>vestor <strong>in</strong>terests.<strong>Green</strong> <strong>Street</strong> generally prohibits research analysts from send<strong>in</strong>g draft research reports to subject companies. However, it should be presumed that <strong>the</strong> analyst(s) whoauthored this report has(/have) had discussions with <strong>the</strong> subject company to ensure factual accuracy prior to publication, and has(/have) had assistance from <strong>the</strong>company <strong>in</strong> conduct<strong>in</strong>g due diligence, <strong>in</strong>clud<strong>in</strong>g visits to company sites and meet<strong>in</strong>gs with company management and o<strong>the</strong>r representatives.Certified ProviderTerms of UseProtection of Proprietary Rights: To <strong>the</strong> extent that this report is issued by GSA (US), this material is <strong>the</strong> proprietary and confidential <strong>in</strong>formation of <strong>Green</strong> <strong>Street</strong> <strong>Advisors</strong>, Inc., and isprotected by copyright. To <strong>the</strong> extent that this report is issued by GSA (UK), this material is <strong>the</strong> proprietary and confidential <strong>in</strong>formation of <strong>Green</strong> <strong>Street</strong> <strong>Advisors</strong> (U.K.) Limited, and isprotected by copyright.This report may be used solely for reference for <strong>in</strong>ternal bus<strong>in</strong>ess purposes. This report may not be reproduced, re-distributed, sold, lent, licensed or o<strong>the</strong>rwise transferred without <strong>the</strong> priorconsent of <strong>Green</strong> <strong>Street</strong>. All o<strong>the</strong>r rights with respect to this report are reserved by <strong>Green</strong> <strong>Street</strong>.EEA Recipients: For use only by Professional Clients and Eligible Counterparties: GSA (UK) is authorized by <strong>the</strong> F<strong>in</strong>ancial Services Authority of <strong>the</strong> United K<strong>in</strong>gdom to issue thisreport to "Professional Clients" and "Eligible Counterparties" only and is not authorized to issue this report to "Retail Clients", as def<strong>in</strong>ed by <strong>the</strong> rules of <strong>the</strong> F<strong>in</strong>ancial Services Authority.This report is provided <strong>in</strong> <strong>the</strong> United K<strong>in</strong>gdom for <strong>the</strong> use of <strong>the</strong> addressees only and is <strong>in</strong>tended for use only by a person or entity that qualifies as a "Professional Client" or an "EligibleCounterparty". Consequently, this report is <strong>in</strong>tended for use only by persons hav<strong>in</strong>g professional experience <strong>in</strong> matters relat<strong>in</strong>g to <strong>in</strong>vestments. This report is not <strong>in</strong>tendedfor use by any o<strong>the</strong>r person. In particular, this report <strong>in</strong>tended only for use by persons who have received written notice from GSA (UK) that he/she/it has been classified, for<strong>the</strong> purpose of receiv<strong>in</strong>g services from GSA (UK), as ei<strong>the</strong>r a "Professional Client" or an "Eligible Counterparty". Any o<strong>the</strong>r person who receives this report should not act on<strong>the</strong> contents of this report.Review of Recommendations:• Unless o<strong>the</strong>rwise <strong>in</strong>dicated, <strong>Green</strong> <strong>Street</strong> reviews all <strong>in</strong>vestment recommendations on at least a monthly basis.• The research recommendation conta<strong>in</strong>ed <strong>in</strong> this report was first released for distribution on <strong>the</strong> date identified on <strong>the</strong> cover of this report.• <strong>Green</strong> <strong>Street</strong> will furnish upon request available <strong>in</strong>vestment <strong>in</strong>formation support<strong>in</strong>g <strong>the</strong> recommendation(s) conta<strong>in</strong>ed <strong>in</strong> this report.This report conta<strong>in</strong>s copyrighted subject matter and is covered under <strong>the</strong> <strong>Green</strong> <strong>Street</strong> <strong>Advisors</strong>' Terms of Use.<strong>Green</strong> <strong>Street</strong> <strong>Advisors</strong> reserves all rights not expressly granted.
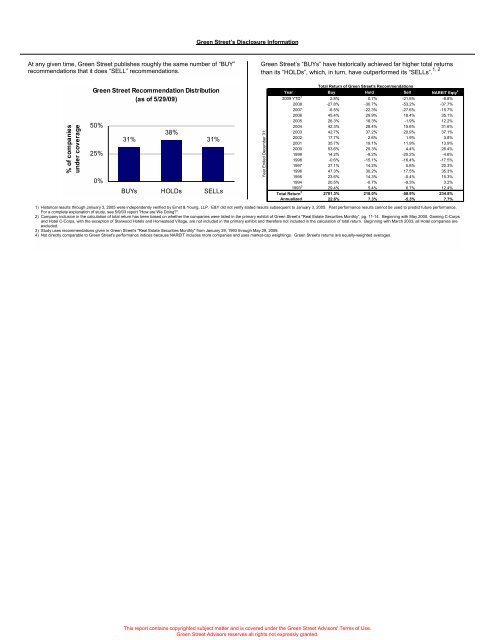
<strong>Green</strong> <strong>Street</strong>’s Disclosure InformationAt any given time, <strong>Green</strong> <strong>Street</strong> publishes roughly <strong>the</strong> same number of “BUY”recommendations that it does “SELL” recommendations.<strong>Green</strong> <strong>Street</strong>’s “BUYs” have historically achieved far higher total returnsthan its ”HOLDs”, which, <strong>in</strong> turn, have outperformed its “SELLs”. 1, 2% of companiesunder coverage<strong>Green</strong> <strong>Street</strong> Recommendation Distribution(as of 5/29/09)50%25%0%31%38%31%BUYs HOLDs SELLsYear Ended December 31:Total Return of <strong>Green</strong> <strong>Street</strong>'s RecommendationsYear Buy Hold Sell NA<strong>REIT</strong> Eqty 42009 YTD 3 2.8% 0.7% -21.5% -8.8%2008 -27.8% -30.7% -53.2% -37.7%2007 -6.5% -22.3% -27.6% -15.7%2006 45.4% 29.9% 18.4% 35.1%2005 26.3% 18.3% -1.9% 12.2%2004 42.3% 28.4% 15.6% 31.6%2003 42.7% 37.2% 20.9% 37.1%2002 17.7% 2.6% 1.9% 3.8%2001 35.7% 19.1% 11.9% 13.9%2000 53.6% 29.3% 4.4% 26.4%1999 14.2% -9.2% -20.2% -4.6%1998 -0.6% -15.1% -16.4% -17.5%1997 37.1% 14.2% 5.8% 20.3%1996 47.3% 30.2% 17.5% 35.3%1995 23.6% 14.3% -0.4% 15.3%1994 20.5% -0.7% -9.3% 3.2%1993 3 29.4% 5.4% 6.7% 12.4%Total Return 3 2701.3% 218.0% -58.9% 234.8%Annualized 22.6% 7.3% -5.3% 7.7%1) Historical results through January 3, 2005 were <strong>in</strong>dependently verified by Ernst & Young, LLP. E&Y did not verify stated results subsequent to January 3, 2005. Past performance results cannot be used to predict future performance.For a complete explanation of study, see 5/9/03 report "How are We Do<strong>in</strong>g?".2) Company <strong>in</strong>clusion <strong>in</strong> <strong>the</strong> calculation of total return has been based on whe<strong>the</strong>r <strong>the</strong> companies were listed <strong>in</strong> <strong>the</strong> primary exhibit of <strong>Green</strong> <strong>Street</strong>’s "Real Estate Securities Monthly”, pg. 11-14. Beg<strong>in</strong>n<strong>in</strong>g with May 2000, Gam<strong>in</strong>g C-Corpsand Hotel C-Corps, with <strong>the</strong> exception of Starwood Hotels and Homestead Village, are not <strong>in</strong>cluded <strong>in</strong> <strong>the</strong> primary exhibit and <strong>the</strong>refore not <strong>in</strong>cluded <strong>in</strong> <strong>the</strong> calculation of total return. Beg<strong>in</strong>n<strong>in</strong>g with March 2003, all Hotel companies areexcluded.3) Study uses recommendations given <strong>in</strong> <strong>Green</strong> <strong>Street</strong>'s "Real Estate Securities Monthly" from January 29, 1993 through May 29, 2009.4) Not directly comparable to <strong>Green</strong> <strong>Street</strong>'s performance <strong>in</strong>dices because NA<strong>REIT</strong> <strong>in</strong>cludes more companies and uses market-cap weight<strong>in</strong>gs. <strong>Green</strong> <strong>Street</strong>'s returns are equally-weighted averages.This report conta<strong>in</strong>s copyrighted subject matter and is covered under <strong>the</strong> <strong>Green</strong> <strong>Street</strong> <strong>Advisors</strong>' Terms of Use.<strong>Green</strong> <strong>Street</strong> <strong>Advisors</strong> reserves all rights not expressly granted.