<strong>Capital</strong> <strong>Structure</strong> <strong>in</strong> <strong>the</strong> <strong>REIT</strong> <strong>Sector</strong> — July 1, 20094III. How Does <strong>the</strong> Rest of Corporate America Do It?Whereas real estate execs have historically had to choose from an abbreviated menu of f<strong>in</strong>anc<strong>in</strong>g options(what flavor of secured debt do you prefer?), o<strong>the</strong>r large companies have enjoyed a lengthy list of alacarte options. Now that <strong>REIT</strong>s are allowed to order off <strong>the</strong> adult menu, <strong>the</strong>re is presumably much to belearned by look<strong>in</strong>g to see which items are preferred by <strong>the</strong> long-time d<strong>in</strong>ers.<strong>REIT</strong>s use far more debt than most companies. Tech companies use a lot less. It appears that<strong>the</strong> history of <strong>the</strong> two sectors has created cultures that arguably no longer make sense.Key Leverage Ratios for S&P 500 ConstituentsNet Liabs % of Tot Mkt Cap60%50%40%30%20%10%0%54%Net Liabilities as a % of Total Mkt <strong>Capital</strong>izationNet Liabilities/EBITDA8.321%9%1.60.9<strong>REIT</strong>s S&P 500 (ex f<strong>in</strong>ancials) Tech Companies10.08.06.04.02.00.0Net Liabilities/EBITDAThe figures shown for <strong>REIT</strong>s and <strong>the</strong> S&P are <strong>the</strong> median value. For tech companies it’s <strong>the</strong> average. The medianvalue for tech companies is zero. Net liabilities equals total liabilities less current assets and excludes preferred equity.50%% of S&P Constituents (ex F<strong>in</strong>ancials) that Use MoreLeverage than <strong>REIT</strong>s25%0%18%Net Liabilities % of Tot Mkt Cap2%Net Liabilities/EBITDAThe key takeaway is that, except<strong>in</strong>g companies engaged <strong>in</strong> <strong>the</strong> bus<strong>in</strong>ess of f<strong>in</strong>ance (e.g. banks and <strong>in</strong>surancecompanies), most corporations ma<strong>in</strong>ta<strong>in</strong> a conservative posture with regard to leverage. The medianleverage ratio (net liabilities/total market capitalization) for non-f<strong>in</strong>ancial members of <strong>the</strong> S&P 500is 21%, a figure that is well below <strong>the</strong> 54% median for <strong>the</strong> <strong>REIT</strong>s <strong>in</strong> that <strong>in</strong>dex. Similarly, <strong>the</strong> median NetLiabilities/EBITDA multiple of 1.6X for S&P members stands <strong>in</strong> stark contrast to <strong>the</strong> 8.3X figure for<strong>REIT</strong>s. Only 2% of S&P members have higher Net Liabilities/EBITDA multiples than <strong>the</strong> typical <strong>REIT</strong>!At least as <strong>in</strong>terest<strong>in</strong>g as <strong>the</strong>se averages is <strong>the</strong> fact that a large number of this country’s premier corporations(e.g. Microsoft, Cisco, Johnson & Johnson, Coke, McDonalds, Exxon Mobil, etc.) choose to operatewith little or no debt at all (Appendix B provides <strong>the</strong>se statistics for each of <strong>the</strong> 50 largest US corporations).Consider<strong>in</strong>g that each of <strong>the</strong>se blue-chips, and virtually every member of <strong>the</strong> S&P 500, is a taxablecorporation (and not a pass-through vehicle like a <strong>REIT</strong>), <strong>the</strong> conservative leverage stance stands <strong>in</strong>stark contrast with <strong>the</strong> norms of <strong>the</strong> <strong>REIT</strong> <strong>in</strong>dustry.A common refra<strong>in</strong> heard from real estate <strong>in</strong>dustry participants goes someth<strong>in</strong>g like, “<strong>the</strong> stability of realestate cash flows allows higher debt levels for <strong>REIT</strong>s”, which purportedly expla<strong>in</strong>s why <strong>REIT</strong>s havehigher debt levels than most companies. However, this po<strong>in</strong>t is relevant only when ask<strong>in</strong>g, “How muchdebt can I get”? It has noth<strong>in</strong>g to do with answer<strong>in</strong>g <strong>the</strong> far more important question, “How muchshould I have?”WWW.GREENSTREETADVISORS.COM© 2010, <strong>Green</strong> <strong>Street</strong> <strong>Advisors</strong>, Inc. - Use of this report is subject to <strong>the</strong> Terms of Use listed at <strong>the</strong> end of <strong>the</strong> report.This report conta<strong>in</strong>s copyrighted subject matter and is covered under <strong>the</strong> <strong>Green</strong> <strong>Street</strong> <strong>Advisors</strong>' Terms of Use.<strong>Green</strong> <strong>Street</strong> <strong>Advisors</strong> reserves all rights not expressly granted.
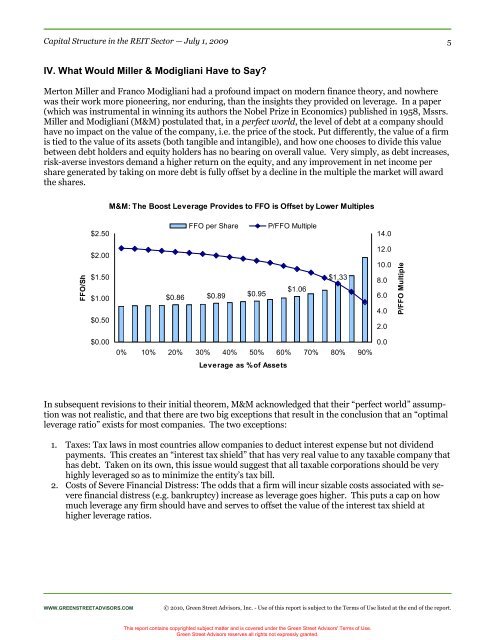
<strong>Capital</strong> <strong>Structure</strong> <strong>in</strong> <strong>the</strong> <strong>REIT</strong> <strong>Sector</strong> — July 1, 20095IV. What Would Miller & Modigliani Have to Say?Merton Miller and Franco Modigliani had a profound impact on modern f<strong>in</strong>ance <strong>the</strong>ory, and nowherewas <strong>the</strong>ir work more pioneer<strong>in</strong>g, nor endur<strong>in</strong>g, than <strong>the</strong> <strong>in</strong>sights <strong>the</strong>y provided on leverage. In a paper(which was <strong>in</strong>strumental <strong>in</strong> w<strong>in</strong>n<strong>in</strong>g its authors <strong>the</strong> Nobel Prize <strong>in</strong> Economics) published <strong>in</strong> 1958, Mssrs.Miller and Modigliani (M&M) postulated that, <strong>in</strong> a perfect world, <strong>the</strong> level of debt at a company shouldhave no impact on <strong>the</strong> value of <strong>the</strong> company, i.e. <strong>the</strong> price of <strong>the</strong> stock. Put differently, <strong>the</strong> value of a firmis tied to <strong>the</strong> value of its assets (both tangible and <strong>in</strong>tangible), and how one chooses to divide this valuebetween debt holders and equity holders has no bear<strong>in</strong>g on overall value. Very simply, as debt <strong>in</strong>creases,risk-averse <strong>in</strong>vestors demand a higher return on <strong>the</strong> equity, and any improvement <strong>in</strong> net <strong>in</strong>come pershare generated by tak<strong>in</strong>g on more debt is fully offset by a decl<strong>in</strong>e <strong>in</strong> <strong>the</strong> multiple <strong>the</strong> market will award<strong>the</strong> shares.M&M: The Boost Leverage Provides to FFO is Offset by Lower Multiples$2.50FFO per ShareP/FFO Multiple14.0FFO/Sh$2.00$1.50$1.00$0.50$0.86$0.89$0.95$1.06$1.3312.010.08.06.04.02.0P/FFO Multiple$0.000% 10% 20% 30% 40% 50% 60% 70% 80% 90%Leverage as % of Assets0.0In subsequent revisions to <strong>the</strong>ir <strong>in</strong>itial <strong>the</strong>orem, M&M acknowledged that <strong>the</strong>ir “perfect world” assumptionwas not realistic, and that <strong>the</strong>re are two big exceptions that result <strong>in</strong> <strong>the</strong> conclusion that an “optimalleverage ratio” exists for most companies. The two exceptions:1. Taxes: Tax laws <strong>in</strong> most countries allow companies to deduct <strong>in</strong>terest expense but not dividendpayments. This creates an “<strong>in</strong>terest tax shield” that has very real value to any taxable company thathas debt. Taken on its own, this issue would suggest that all taxable corporations should be veryhighly leveraged so as to m<strong>in</strong>imize <strong>the</strong> entity’s tax bill.2. Costs of Severe F<strong>in</strong>ancial Distress: The odds that a firm will <strong>in</strong>cur sizable costs associated with severef<strong>in</strong>ancial distress (e.g. bankruptcy) <strong>in</strong>crease as leverage goes higher. This puts a cap on howmuch leverage any firm should have and serves to offset <strong>the</strong> value of <strong>the</strong> <strong>in</strong>terest tax shield athigher leverage ratios.WWW.GREENSTREETADVISORS.COM© 2010, <strong>Green</strong> <strong>Street</strong> <strong>Advisors</strong>, Inc. - Use of this report is subject to <strong>the</strong> Terms of Use listed at <strong>the</strong> end of <strong>the</strong> report.This report conta<strong>in</strong>s copyrighted subject matter and is covered under <strong>the</strong> <strong>Green</strong> <strong>Street</strong> <strong>Advisors</strong>' Terms of Use.<strong>Green</strong> <strong>Street</strong> <strong>Advisors</strong> reserves all rights not expressly granted.