Growing the Curriculum
Growing the Curriculum: - Babson Survey Research Group
Growing the Curriculum: - Babson Survey Research Group

Create successful ePaper yourself
Turn your PDF publications into a flip-book with our unique Google optimized e-Paper software.
<strong>Growing</strong> <strong>the</strong> <strong>Curriculum</strong>:<br />
Open Education Resources in U.S. Higher Education<br />
I. Elaine Allen and Jeff Seaman
<strong>Growing</strong> <strong>the</strong> <strong>Curriculum</strong>:<br />
Open Education Resources in U.S. Higher Education<br />
I. Elaine Allen, Ph.D.<br />
Professor of Biostatistics & Epidemiology, UCSF<br />
Emeritus Professor of Statistics & Entrepreneurship<br />
Co-Director, Babson Survey Research Group<br />
Jeff Seaman, Ph.D.<br />
Co-Director, Babson Survey Research Group<br />
November 2012
CONTENTS<br />
Acknowledgments .................................................................................................................................... 1<br />
Executive Summary .................................................................................................................................. 2<br />
Study Results<br />
Awareness of Open Educational Resources ........................................................................... 4<br />
Use of OER ..................................................................................................................................... 6<br />
Perceived Value of OER ............................................................................................................... 8<br />
Saving Time and Money ............................................................................................................ 11<br />
The Gatekeepers ........................................................................................................................ 14<br />
Potential Barriers ........................................................................................................................ 17<br />
The Faculty View ........................................................................................................................ 19<br />
Survey Methodology ............................................................................................................................. 27<br />
Appendix Tables .................................................................................................................................... 29<br />
The cover design is by Mark Favazza (www.favazza.com).<br />
Copyright ©2012 by Babson Survey Research Group and Quahog Research Group, LLC.<br />
Permission is hereby granted for all non-commercial use of this report provided that notification is<br />
provided to bsrg@babson.edu and proper attribution is included.<br />
Commercial use may also be granted – inquire at bsrg@babson.e<br />
! !<br />
!
ACKNOWLEDGMENTS<br />
This research would not be possible without <strong>the</strong> assistance of a number of<br />
organizations. First, we wish to thank The William and Flora Hewlett Foundation<br />
for <strong>the</strong>ir considerable help in framing <strong>the</strong> project, as well as <strong>the</strong>ir support for <strong>the</strong><br />
core analysis and report creation. Their background and knowledge of open<br />
education resources was invaluable in helping to define <strong>the</strong> focus for all of <strong>the</strong><br />
aspects of <strong>the</strong> study. We also want to thank <strong>the</strong> Global Healthy Living<br />
Foundation for <strong>the</strong>ir support in <strong>the</strong> administration of <strong>the</strong> Hewlett grant.<br />
The report presents results derived from four different national-representative<br />
samples of higher education faculty and administrators. This is only possible<br />
because <strong>the</strong> sponsors of each of those <strong>the</strong> data collection efforts generously<br />
allowed us to include OER-related questions as part of <strong>the</strong>ir project. We sincerely<br />
thank <strong>the</strong>m for <strong>the</strong>ir support and willingness to be part of this larger effort.<br />
Results on chief academic officers are taken from <strong>the</strong> data collected for <strong>the</strong><br />
2011 Babson Survey Research Group’s online learning report. This effort was<br />
supported by Kaplan University, Pearson, and <strong>the</strong> Sloan Consortium. Chief<br />
academic officer data collection for 2009 and 2010 was supported by a grant<br />
from <strong>the</strong> Alfred P. Sloan Foundation. One faulty survey and <strong>the</strong> survey of<br />
academic technology administrators was conducted as a joint project by <strong>the</strong><br />
Babson Survey Research Group with Inside Higher Ed. Four companies –<br />
CourseSmart, Deltak, Pearson and Sonic Foundry – provided <strong>the</strong> support to<br />
help make that research effort possible. Pearson also supported a second<br />
faculty survey. Pearson fur<strong>the</strong>r provided <strong>the</strong> specific resources to allow <strong>the</strong><br />
construction of both nationally representative faculty samples, as well as support<br />
for <strong>the</strong> overall production and distribution of this report.<br />
Finally we want to thank <strong>the</strong> thousands of faculty members and academic<br />
administrators who took <strong>the</strong> time to provide us with <strong>the</strong>ir detailed and<br />
thoughtful responses. We understand that you are very busy people, so we<br />
very much appreciate your effort. This report would not be possible without<br />
you, and we hope that you find it useful.<br />
Co-Directors<br />
Babson Survey Research Group<br />
! "! !<br />
!
EXECUTIVE SUMMARY<br />
Open educational resources (OER) have been defined by <strong>the</strong> Hewlett<br />
Foundation as teaching, learning, and research resources that reside in <strong>the</strong><br />
public domain or have been released under an intellectual property license that<br />
permits <strong>the</strong>ir free use and re-purposing by o<strong>the</strong>rs. Open educational resources<br />
include full courses, course materials, modules, textbooks, streaming videos,<br />
tests, software, and any o<strong>the</strong>r tools, materials, or techniques used to support<br />
access to knowledge. 1<br />
Formal initiatives in OER can be traced to <strong>the</strong> late 20 th Century through<br />
developments in distance (and now online) learning. The term ‘open<br />
educational resources’ was first adopted at UNESCO's 2002 Forum on <strong>the</strong><br />
Impact of Open Courseware for Higher Education in Developing Countries. 2<br />
As part of <strong>the</strong> ongoing Babson Survey Research Group’s online learning reports,<br />
we have asked institutional academic leaders questions on <strong>the</strong>ir knowledge, use<br />
and opinion of OER as part of <strong>the</strong> 2009 - 2011 surveys. In addition, we have<br />
conducted surveys asking faculty in higher education and academic technology<br />
administrators <strong>the</strong>ir opinions of <strong>the</strong>se resources 3 . Finally, our survey of faculty<br />
on <strong>the</strong>ir use of social media also asked for faculty opinions on OER 4 . This<br />
report contains <strong>the</strong> results from all <strong>the</strong>se data collection efforts 5 .<br />
• Most academic leaders are at least somewhat aware of open education<br />
resources (OER) and slightly over half list <strong>the</strong>mselves as ‘Aware’ or<br />
‘Very aware.’<br />
• Only one-half of all chief academic officers report that any of <strong>the</strong><br />
courses at <strong>the</strong>ir institution currently use OER materials.<br />
• In 2011, most surveyed academic leaders report that open education<br />
resources will have value for <strong>the</strong>ir campus; 57 percent agree that <strong>the</strong>y<br />
have value and less than five percent disagree.<br />
• Nearly two-thirds of all chief academic officers agree that open education<br />
resources have <strong>the</strong> potential to reduce costs for <strong>the</strong>ir institution.<br />
• There is wide agreement among academic leaders that open education<br />
resources will save time in <strong>the</strong> development of new courses.<br />
1 http://www.hewlett.org/programs/education-program/open-educational-resources.<br />
2 Johnstone, Sally M. (2005). "Open Educational Resources Serve <strong>the</strong> World". Educause Quarterly 28 (3). Retrieved<br />
2012-8-13.<br />
3 Allen, I Elaine, Jeff Seaman, with Doug Lederman, Scott Jaschik, Digital Faculty: Professor, Teaching and Technology,<br />
2012, Babson Survey Research Group.<br />
4 Moran, Mike, Jeff Seaman, Hester Tinti-Kane, Blogs, Wikis, Podcasts and Facebook: How Today’s Higher Education Faculty<br />
Use Social Media, Pearson learning Solutions and Babson Survey Research Group.<br />
5 All reports are available at http://www.quahogresearch.com<br />
! "! !<br />
!
• Chief academic officers at over a majority of institutions reported that<br />
individual faculty developing courses, faculty committees, programs or<br />
divisions, and <strong>the</strong> administration all have a role in a decision to adopt<br />
open education resources.<br />
• Only two groups, individual faculty members and <strong>the</strong> administration, are<br />
seen as having <strong>the</strong> primary decision responsibility on <strong>the</strong> adoption of<br />
open education resources.<br />
• Over one-half of academic leaders agree or strongly agree that open<br />
education resources would be more useful if <strong>the</strong>re was a single<br />
clearinghouse.<br />
• Among faculty, cost (88% reporting as important or very important) and<br />
ease of use (86%) are most important for selecting online resources.<br />
• The time and effort to find and evaluate are consistently listed as <strong>the</strong> most<br />
important barriers by faculty to <strong>the</strong> adoption of open education resources.<br />
• Older faculty have a greater level of concern with all potential barriers<br />
to open education resource adoption than do younger faculty.<br />
• Female faculty members report higher levels of concern for all potential<br />
open education resource adoption barriers examined.<br />
! #! !<br />
!
STUDY RESULTS:<br />
Awareness of Open Educational Resources<br />
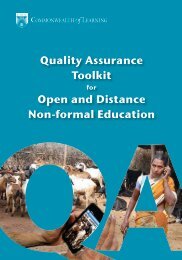
Most academic leaders are at least somewhat aware of open education<br />
resources (OER) and slightly over half list <strong>the</strong>mselves as ‘Aware’ or ‘Very<br />
aware.’ An additional third report that <strong>the</strong>y are only ‘Somewhat aware.’<br />
Examining <strong>the</strong> open-ended responses from <strong>the</strong> academic leaders shows that, for<br />
many, while <strong>the</strong>y may claim to be ‘Aware’ or ‘Very aware,’ <strong>the</strong>re is wide<br />
variability in exactly what <strong>the</strong>y consider to be open education resources. Those<br />
claiming some level of awareness provided a wide range of descriptions<br />
including those who spoke of content versus those who focused on software<br />
and services (e.g. Moodle). O<strong>the</strong>rs seamed to equate ‘open’ with ‘free’ and<br />
grouped all free resources as OER. Still o<strong>the</strong>rs mentioned open-source<br />
computer code as <strong>the</strong>ir example of OER. One concept very important to many<br />
in <strong>the</strong> OER field was rarely mentioned at all – licensing terms such as creative<br />
commons that permit free use or re-purposing by o<strong>the</strong>rs.<br />
CHIEF ACADEMIC OFFICER AWARENESS OF<br />
OPEN EDUCATIONAL RESOURCES - FALL 2011<br />
Not aware<br />
Very aware<br />
Somewhat<br />
aware<br />
Aware<br />
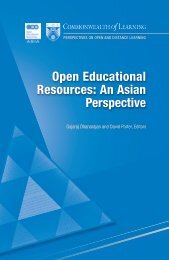
The professed level of chief academic officer awareness differs less by type and<br />
size of institution than by whe<strong>the</strong>r <strong>the</strong> institution offers online courses and full<br />
programs. At schools with no online offerings, only 28 percent of chief<br />
academic officers were ‘Aware’ or ‘Very aware’ of OER compared to 59<br />
percent of institutions with online courses and full programs.<br />
! $! !<br />
!
CHIEF ACADEMIC OFFICERS AWARE OR VERY AWARE OF OPEN<br />
EDUCATIONAL RESOURCES BY ONLINE OFFERINGS - FALL 2011<br />
70%<br />
60%<br />
50%<br />
40%<br />
30%<br />
20%<br />
10%<br />
0%<br />
Courses and full programs Courses only No offerings<br />
One hypo<strong>the</strong>sis is that those most engaged in online learning may have a higher<br />
level of awareness of OER because online courses at an institution have often<br />
been developed more recently than <strong>the</strong> corresponding face-to-face courses,<br />
reflecting <strong>the</strong> recent and rapid growth in this sector of higher education. This,<br />
coupled with a presumed greater awareness of technology options in general, may<br />
provide academic leaders that are heavily engaged in online learning with <strong>the</strong><br />
opportunity to have greater exposure to open education resources and o<strong>the</strong>r<br />
newer course creation options. The results do seem to confirm this hypo<strong>the</strong>sis<br />
with a declining percent of academic leaders aware of OER as you move from<br />
schools with online programs and courses, to those with online courses only, and<br />
to schools with no online presence (60% to 50% to 28%, respectively).<br />
The proportion of chief academic officers who are aware of OER increases<br />
somewhat with <strong>the</strong> size of <strong>the</strong> institution, with 44 percent ‘Aware’ or ‘Very<br />
aware’ at institutions with under 1500 students, rising to 69 percent at <strong>the</strong><br />
largest (over 15,000 students) schools.<br />
80%<br />
CHIEF ACADEMIC OFFICERS AWARE OR VERY AWARE OF OPEN<br />
EDUCATIONAL RESOURCES BY TOTAL ENROLLMENT - FALL 2011<br />
60%<br />
40%<br />
20%<br />
0%<br />
Under 1500 1500 - 2999 3000 - 7499 7500 - 14999 15000+<br />
! %! !<br />
!
Use of OER<br />
The level of reported use of open education resources by academic leaders is<br />
not very high. Only one-half of all chief academic officers report that any of <strong>the</strong><br />
courses at <strong>the</strong>ir institution currently make use of OER materials. This is a very<br />
low threshold, since it requires use of OER in only a single course at <strong>the</strong><br />
institution to provide an affirmative response. This low reported use may<br />
reflect a less-than-perfect understanding of <strong>the</strong> nature of OER, or that those on<br />
campus using OER have not communicated such use to <strong>the</strong> academic leaders.<br />
USE OF OPEN EDUCATIONAL RESOURCES BY TYPE OF COURSE<br />
- FALL 2011<br />
Currently Use<br />
Not currently use, but plan to implement<br />
Not currently use - unsure if will<br />
implement<br />
Face-to-face<br />
Blended<br />
Online<br />
0% 10% 20% 30% 40% 50% 60%<br />
The pattern of reported use is very similar for courses of all types of delivery<br />
methods – online, blended, and face-to-face. Academic leaders at roughly onehalf<br />
of all institutions report that <strong>the</strong>ir courses make use of OER materials, with<br />
approximately ten percent saying <strong>the</strong>y do not currently use OER, but <strong>the</strong>y are<br />
planning to in <strong>the</strong> future. An additional ten percent report that <strong>the</strong>y are<br />
uncertain if <strong>the</strong>y will use open education resources in <strong>the</strong> future. The remaining<br />
fraction, around 30 percent, say <strong>the</strong>y do not use OER materials and have no<br />
plans to use <strong>the</strong>m in <strong>the</strong> future.<br />
! &! !<br />
!
Current use of open education resources is very consistent across institutions<br />
of all sizes. Approximately one-half of institutions of all sizes, ranging from <strong>the</strong><br />
very smallest (under 1500 total enrollments) to <strong>the</strong> very largest (with over<br />
15,000 total enrollments) report that <strong>the</strong>y currently use OER materials in <strong>the</strong>ir<br />
courses. This pattern of use by institutional size is consistent for all course<br />
delivery types – online, blended, and face-to-face.<br />
USE OF OPEN EDUCATIONAL RESOURCES BY TOTAL ENROLLMENT<br />
AND TYPE OF COURSE - FALL 2011<br />
70%<br />
60%<br />
50%<br />
40%<br />
30%<br />
20%<br />
10%<br />
0%<br />
Online Courses<br />
Blended Courses<br />
Face-to-face courses<br />
Under 1500 1500 - 2999 3000 - 7499 7500 - 14999 15000+<br />
Academic leaders are not reporting any significant change in <strong>the</strong> use of OER<br />
materials at <strong>the</strong>ir institutions. In 2010 almost half (49%) of all schools reported<br />
that <strong>the</strong>y currently used some OER in <strong>the</strong>ir online courses. This is not<br />
markedly changed for 2011 where 50 percent of academic leaders report using<br />
OER for <strong>the</strong>se courses. The one area of change is among those planning on<br />
future adoption of OER – this proportion has grown from 5 percent of<br />
reporting institutions in 2010 to 13 percent in 2011.<br />
USE OF OPEN EDUCATIONAL RESOURCES IN ONLINE COURSES-<br />
FALL 2010 AND 2011<br />
Currently Use<br />
Not currently use, but plan to implement<br />
Not currently use - unsure if will implement<br />
2010<br />
2011<br />
0% 10% 20% 30% 40% 50% 60%<br />
! '! !<br />
!
Perceived Value of OER<br />
The perceived value of OER among chief academic officers has increased<br />
between 2009 and 2011. In 2011, most surveyed academic leaders report that<br />
open education resources will have value for <strong>the</strong>ir campus; 57 percent agree<br />
that <strong>the</strong>y have value and less than five percent disagree. These results are<br />
similar to those for <strong>the</strong> same question when asked two years ago, with one<br />
notable difference. The proportion of for-profit institutions agreeing with this<br />
statement has shown a large increase over <strong>the</strong> two-year period (moving from<br />
50% in 2009 to 72% in 2011). Both private nonprofit institutions and public<br />
institutions display smaller increases over this time period.<br />
CHIEF ACADEMIC OFFICERS: OPEN<br />
EDUCATIONAL RESOURCES WILL BE OF VALUE<br />
FOR MY CAMPUS - FALL 2011<br />
Disagree<br />
Neutral<br />
Agree<br />
Unlike <strong>the</strong> differences seen by type of institution, <strong>the</strong>re are only small<br />
differences in opinion among academic leaders at different sized institutions.<br />
Likewise <strong>the</strong>re has been little change in <strong>the</strong>se levels between 2009 and 2011.<br />
Comparing <strong>the</strong> 2009 results to those for 2011 by <strong>the</strong> size of <strong>the</strong> institution,<br />
most show only a very small increases in <strong>the</strong> proportion agreeing that OER has<br />
value for <strong>the</strong>ir campus – with <strong>the</strong> very largest institutions showing no gains at<br />
all. The 2011 results are now virtually <strong>the</strong> same for all sizes of institutions, with<br />
57 or 58 percent of all but <strong>the</strong> very largest institutions agreeing (which have an<br />
agreement level ten points lower at 48%).<br />
! (! !<br />
!
CHIEF ACADEMIC OFFICERS: OPEN EDUCATIONAL RESOURCES<br />
WILL BE OF VALUE FOR MY CAMPUS BY OVERALL ENROLLMENT<br />
- FALL 2009 AND FALL 2011<br />
70%<br />
60%<br />
50%<br />
40%<br />
30%<br />
20%<br />
10%<br />
0%<br />
2009<br />
2011<br />
Under 1500 1500 - 2999 3000 - 7499 7500 - 14999 15000+<br />
Examined by type of institution shows wide differences in <strong>the</strong> perceived value<br />
proposition of open education resources with Associates schools being <strong>the</strong><br />
highest in agreeing in <strong>the</strong> value of OER for both 2009 and 2011. While <strong>the</strong>re<br />
were differences between Baccalaureate, Masters, and Doctoral/Research<br />
institutions in 2009 (34%, 45%, and 30% respectively), <strong>the</strong>y are almost equal in<br />
2011 (46%, 47%, and 45% respectively agreeing that OER will be of value to<br />
<strong>the</strong>ir campus).<br />
80%<br />
70%<br />
60%<br />
50%<br />
40%<br />
30%<br />
20%<br />
10%<br />
0%<br />
CHIEF ACADEMIC OFFICERS: OPEN EDUCATIONAL RESOURCES<br />
WILL BE OF VALUE FOR MY CAMPUS BY CARNEGIE<br />
CLASSIFICATION - FALL 2009 AND FALL 2011<br />
Specialized Associates Baccalaureate Masters Doctoral/Research<br />
2009 2011<br />
! )! !<br />
!
Interestingly, <strong>the</strong> value of OER does not track with <strong>the</strong> offering of online<br />
courses and programs, as <strong>the</strong> awareness of OER did. The percent finding value<br />
for <strong>the</strong>ir institution in open education resources has not changed from 2009 to<br />
2011 in schools with online courses and programs (59% and 58%, respectively)<br />
but it has increased for institutions with online courses only (50% to 62%,<br />
respectively) and those with no online presence (37% and 43%, respectively).<br />
70%<br />
CHIEF ACADEMIC OFFICERS: OPEN EDUCATIONAL RESOURCES<br />
WILL BE OF VALUE FOR MY CAMPUS BY ONLINE OFFERINGS -<br />
FALL 2009 AND FALL 2011<br />
60%<br />
50%<br />
40%<br />
30%<br />
20%<br />
10%<br />
0%<br />
Courses and full programs Courses only No offerings<br />
2009 2011<br />
! "*! !<br />
!
Saving Time and Money<br />
Open education resources are seen as having <strong>the</strong> potential to reduce costs –<br />
nearly two-thirds of all surveyed chief academic officers agree with this<br />
statement. With an agreement rate of slightly over half (51%), <strong>the</strong> Doctoral/<br />
Research institutions have <strong>the</strong> lowest percent of chief academic officers agreeing<br />
with this statement followed by Baccalaureate institutions (57%).<br />
80%<br />
CHIEF ACADEMIC OFFICERS: OPEN EDUCATIONAL RESOURCES<br />
HAVE THE POTENTIAL TO SAVE MY INSTITUTION MONEY BY<br />
CARNEGIE CLASSIFICATION - FALL 2011<br />
70%<br />
60%<br />
50%<br />
40%<br />
30%<br />
20%<br />
10%<br />
0%<br />
Specialized Associates Baccalaureate Masters Doctoral/Research<br />
Agree<br />
Strongly Agree<br />
Not surprisingly, chief academic officers at schools offering online courses and<br />
programs agree or strongly agree that OER has <strong>the</strong> potential to save <strong>the</strong>m<br />
money. The percent agreement drops off sharply for schools that have no<br />
online presence (from 69% to 50%) with institutions offering only online courses<br />
closer to institutions with online programs (67%).<br />
CHIEF ACADEMIC OFFICERS: OPEN EDUCATIONAL RESOURCES HAVE THE POTENTIAL<br />
TO SAVE MY INSTITUTION MONEY BY TYPE OF ONLINE OFFERINGS - FALL 2011<br />
80%<br />
70%<br />
60%<br />
50%<br />
40%<br />
30%<br />
20%<br />
10%<br />
0%<br />
Courses and full programs Courses only No offerings<br />
Agree<br />
Strongly Agree<br />
! ""! !<br />
!
When examined by type school (private for-profit, private nonprofit, or public),<br />
a majority of all chief academic officers agreed that open education resources<br />
could save <strong>the</strong>ir institution money (67%, 58%, and 70% respectively). In<br />
addition, when <strong>the</strong> size of <strong>the</strong> institution is delineated, all showed at least 60%<br />
agreeing or strongly agreeing that OER will save <strong>the</strong>m money. It appears that<br />
<strong>the</strong> Carnegie class of school and whe<strong>the</strong>r it offers any courses online are <strong>the</strong><br />
major factors in determining if <strong>the</strong>re is agreement or strong agreement by <strong>the</strong><br />
chief academic officers.<br />
CHIEF ACADEMIC OFFICERS: OPEN EDUCATIONAL RESOURCES<br />
HAVE THE POTENTIAL TO SAVE MY INSTITUTION MONEY BY<br />
INSTITUTIONAL CONTROL - FALL 2011<br />
80%<br />
70%<br />
60%<br />
50%<br />
40%<br />
30%<br />
20%<br />
10%<br />
0%<br />
Private for-profit Private nonprofit Public<br />
Agree<br />
Strongly Agree<br />
Why do academic leaders believe that use of OER can save <strong>the</strong>ir institution<br />
money? One possibility is that by adopting <strong>the</strong>se free resources <strong>the</strong>y will not<br />
need to develop <strong>the</strong>ir own resources on campus, saving time. Overall, <strong>the</strong>re is<br />
wide agreement that open education resources will save time in <strong>the</strong><br />
development of new courses.<br />
CHIEF ACADEMIC OFFICERS: OPEN EDUCATIONAL RESOURCES<br />
CAN SAVE TIME IN DEVELOPING NEW COURSES - FALL 2011<br />
Strongly Disagree<br />
Disagree<br />
Strongly<br />
Agree<br />
Neutral<br />
Agree<br />
! "+! !<br />
!
While a sizable proportion of academic leaders agree that <strong>the</strong> use of OER can<br />
save time in developing new courses, <strong>the</strong> level of this agreement is not that<br />
strong; only a few percent say that <strong>the</strong>y ‘strongly agree’ that this is <strong>the</strong> case.<br />
This agreement is driven by institutions that offer online courses or online<br />
courses and full programs online, with both showing percent agreement above<br />
60 percent while less that 35 percent of respondents from schools with no<br />
online offerings agreed.<br />
CHIEF ACADEMIC OFFICERS: OPEN EDUCATIONAL RESOURCES<br />
CAN SAVE TIME IN DEVELOPING NEW COURSES BY TYPE OF<br />
ONLINE OFFERINGS - FALL 2011<br />
70%<br />
60%<br />
50%<br />
40%<br />
30%<br />
20%<br />
10%<br />
0%<br />
Courses and full programs Courses only No offerings<br />
Strongly Agree<br />
Agree<br />
! "#! !<br />
!
The Gatekeepers<br />
Who in a large complex organization such as higher education institutions decides<br />
to adopt a new technique or technology? What roles within <strong>the</strong> institution serve<br />
this gatekeeper function? The survey probed academic leaders on which persons<br />
within <strong>the</strong>ir own organization would play a role in a decision to adopt open<br />
education resources. As might be expected from institutions that often strive for<br />
consensus in decision-making, <strong>the</strong> number of different players potentially involved<br />
in a decision is ra<strong>the</strong>r large. Chief academic officers at over a majority of<br />
institutions reported that individual faculty developing courses, faculty<br />
committees, programs or divisions, and <strong>the</strong> administration all had a role in <strong>the</strong><br />
decision-making. Slight less (43%) said that <strong>the</strong> instructional design group had a<br />
role. The lower rate of instructional design group involvement may stem from a<br />
lack of such organizations among <strong>the</strong> smaller institutions.<br />
70%<br />
60%<br />
50%<br />
40%<br />
30%<br />
20%<br />
10%<br />
HAS A ROLE IN DECISION TO ADOPT OER - FALL 2011<br />
0%<br />
Individual<br />
faculty<br />
Faculty<br />
committee<br />
Program or<br />
division<br />
Instructional<br />
design group<br />
Administration<br />
O<strong>the</strong>r<br />
Except for <strong>the</strong> lower rate of instructional design group representation among<br />
<strong>the</strong> smallest institutions (those with less than 1,500 total students), <strong>the</strong> pattern<br />
of which groups are involved in OER adoption decisions is similar across all<br />
sized higher education institutions. The one o<strong>the</strong>r exception is that program or<br />
division are more likely to have this role in <strong>the</strong> very largest of schools.<br />
! "$! !<br />
!
HAS A ROLE IN DECISION TO ADOPT OER - FALL 2011<br />
90%<br />
80%<br />
70%<br />
60%<br />
50%<br />
40%<br />
30%<br />
20%<br />
10%<br />
0%<br />
Individual faculty<br />
Faculty committee<br />
Program or division<br />
Instructional design group<br />
Administration<br />
Under 1500 1500 - 2999 3000 - 7499 7500 - 14999 15000+<br />
The large cast of players could aid <strong>the</strong> adoption of open education resources if<br />
each group was able to independently bring potential resources to <strong>the</strong> attention<br />
of o<strong>the</strong>rs and into <strong>the</strong> classroom. The potentially large number of persons<br />
involved in <strong>the</strong> decision-making could also make <strong>the</strong> process unwieldy. This might<br />
be especially true at institutions that strive for consensus for major decisions.<br />
It might be expected that not everyone that is part of <strong>the</strong> decision plays an equal<br />
role. One reason for <strong>the</strong> large group of decision makers may be that many of<br />
<strong>the</strong>m serve in an advisory capacity, with <strong>the</strong> final decisions being made by a<br />
much smaller group. Academic leaders were also asked which groups on <strong>the</strong>ir<br />
campus had <strong>the</strong> primary role in a decision to adopt open education resources.<br />
The picture of <strong>the</strong> primary decision maker is very different from that of those<br />
who have any role – only two groups, individual faculty members and <strong>the</strong><br />
administration, are seen as having primary decision responsibility.<br />
PRIMARY ROLE IN DECISION TO ADOPT OER - FALL 2011<br />
50%<br />
45%<br />
40%<br />
35%<br />
30%<br />
25%<br />
20%<br />
15%<br />
10%<br />
5%<br />
0%<br />
Individual faculty Faculty committee Program or division Instructional design<br />
group<br />
Administration<br />
! "%! !<br />
!
The relative role of <strong>the</strong>se two groups is very different in different types of<br />
institutions. When examined by <strong>the</strong> type of control of <strong>the</strong> institution, <strong>the</strong><br />
administration has <strong>the</strong> lead among for-profit institutions, where central decisionmaking<br />
is more of a tradition. Faculty are in <strong>the</strong> lead among <strong>the</strong> private<br />
nonprofit and <strong>the</strong> public institutions.<br />
PRIMARY ROLE IN DECISION TO ADOPT OER -<br />
FALL 2011<br />
70%<br />
60%<br />
50%<br />
40%<br />
30%<br />
20%<br />
10%<br />
0%<br />
Private for-profit Private nonprofit Public<br />
Administration<br />
Individual faculty<br />
The importance of faculty among <strong>the</strong> Doctoral/Research institutions is clear,<br />
where <strong>the</strong>y are over six times as likely to have <strong>the</strong> primary role in an OER<br />
adoption decision than is <strong>the</strong> administration. Associates institutions display an<br />
even balance in reporting who has <strong>the</strong> primary role – with equal numbers<br />
reporting faculty and <strong>the</strong> administration. This is <strong>the</strong> only type of institution<br />
where <strong>the</strong> role of <strong>the</strong> administration approaches that of <strong>the</strong> faculty.<br />
PRIMARY ROLE IN DECISION TO ADOPT OER - FALL 2011<br />
80%<br />
70%<br />
60%<br />
50%<br />
40%<br />
30%<br />
20%<br />
10%<br />
0%<br />
Doctoral/Research Masters Baccalaureate Associates Specialized<br />
Administration<br />
Individual faculty<br />
! "&! !<br />
!
Potential Barriers<br />
While academic leaders are clear that <strong>the</strong>y see potential benefit for open<br />
education resources for <strong>the</strong>ir institutions, <strong>the</strong>y are not without concerns. The<br />
level of concern among <strong>the</strong>se leaders, however, is ra<strong>the</strong>r low. Over one-half of<br />
<strong>the</strong> respondents agree or strongly agree that open education resources would<br />
be more useful if <strong>the</strong>re was a single clearinghouse. This does not mean that<br />
<strong>the</strong>se leaders require a clearinghouse in order to adopt OER, only that having<br />
one would make <strong>the</strong> process easier.<br />
CHIEF ACADEMIC OFFICERS: OPINIONS ABOUT OPEN<br />
EDUCATIONAL RESOURCES - FALL 2011<br />
Would be much more useful if <strong>the</strong>re was a single<br />
clearinghouse<br />
Require too much time and energy to find and evaluate<br />
Are not yet of sufficient quality for my institution<br />
Are not available to meet my institution's particular<br />
needs<br />
Will never be accepted by my faculty<br />
0% 10% 20% 30% 40% 50% 60% 70%<br />
Agree<br />
Strongly Agree<br />
Academic leaders at institutions with online offerings express <strong>the</strong> greatest<br />
interest in a single clearinghouse. These are <strong>the</strong> same leaders who had <strong>the</strong><br />
highest level of awareness and <strong>the</strong> saw <strong>the</strong> greatest potential value and potential<br />
time savings from OER.<br />
CHIEF ACADEMIC OFFICERS: OPEN EDUCATION RESOURCES WOULD BE MORE<br />
USEFUL IF THERE WAS A SINGLE CLEARINGHOUSE - FALL 2011<br />
70%<br />
60%<br />
50%<br />
40%<br />
30%<br />
20%<br />
10%<br />
0%<br />
Courses and full programs Courses only No offerings<br />
Strongly Agree<br />
Agree<br />
! "'! !<br />
!
O<strong>the</strong>r, more serious, concerns were raised by much smaller numbers of<br />
respondents. About one in five leaders thinks that it takes too much time and<br />
energy to find and evaluate OER or that OER materials are not yet of sufficient<br />
quality for <strong>the</strong>ir institution. The level of concern is not exceedingly high among<br />
<strong>the</strong>se chief academic officers, as virtually all report that <strong>the</strong>y ‘agree’ that this is a<br />
concern, but very few go as far as to say that <strong>the</strong>y ‘strongly agree.’<br />
Open education resources do not suffer from <strong>the</strong> same level of distrust among<br />
faculty that has been evident in <strong>the</strong> growth of online learning. Academic leaders<br />
do not believe that <strong>the</strong>ir faculty will not accept open education resources, as<br />
only 8 percent report that <strong>the</strong>ir faculty will not accept OER. This is very<br />
different than <strong>the</strong> pattern we have seen for faculty acceptance of online<br />
education, where even after over a decade of growth in online education, only<br />
32 percent of <strong>the</strong>se same leaders say that <strong>the</strong>ir faculty now accept <strong>the</strong> value and<br />
legitimacy of online education.<br />
CHIEF ACADEMIC OFFICERS: OPEN EDUCATIONAL RESOURCES<br />
WILL NEVER BY ACCEPTED BY MY FACULTY - FALL 2011<br />
Strongly Agree<br />
Strongly<br />
Disagree<br />
Agree<br />
Disagree<br />
Neutral<br />
! "(! !<br />
!
The Faculty View<br />
Academic leaders may believe that open education resources have potential<br />
value for <strong>the</strong>ir institutions, but what about <strong>the</strong> faculty members, who are ei<strong>the</strong>r<br />
strongly involved in <strong>the</strong> decision making or will be driving any decision to adopt<br />
OER materials. The first question to address is whe<strong>the</strong>r faculty use <strong>the</strong>se types<br />
of materials in general – regardless of <strong>the</strong>ir “open” status? Since <strong>the</strong><br />
overwhelming majority of open education recourse materials are digital, one<br />
such measure of potential adoption can be seen in <strong>the</strong> proportion of faculty that<br />
are making use of such digital materials in <strong>the</strong>ir classes.<br />
The answer is affirmative – large numbers of faculty are already making use of<br />
digital resources as a part of <strong>the</strong>ir teaching. Fully 83 percent report that <strong>the</strong>y<br />
include digital materials such as simulations or videos in <strong>the</strong> <strong>the</strong>ir course<br />
presentations. Ano<strong>the</strong>r 11 percent say <strong>the</strong>y do so, but only rarely. Less than<br />
six percent of faculty say that <strong>the</strong>y never use such materials.<br />
FACULTY: USED DIGITAL MATERIALS SUCH AS<br />
SIMULATIONS AND VIDEOS IN COURSE PRESENTATIONS<br />
Rarely<br />
Never /<br />
NA<br />
Regularly<br />
Occasionally<br />
! ")! !<br />
!
The current report is concerned with <strong>the</strong> consumption, not <strong>the</strong> creation of<br />
open education resources. However, examining <strong>the</strong> experiences of faculty in<br />
producing such materials is ano<strong>the</strong>r good indicator of <strong>the</strong>ir potential reception<br />
of OER materials. A majority of faculty report that have produced digital<br />
teaching materials, open education resources, or lecture captures as part of<br />
<strong>the</strong>ir teaching. Only one in five say that <strong>the</strong>y do this “Regularly”, with a similar<br />
number saying it is “Occasionally.”<br />
The question is not specific to only OER materials, but broader in scope, since<br />
faculty may be producing any form of digital teaching materials to respond<br />
affirmatively. The result does, however, provide a fur<strong>the</strong>r indication that faculty<br />
are both familiar with and receptive to digital teaching materials.<br />
FACULTY: CREATED DIGITAL TEACHING MATERIALS/<br />
OPEN EDUCATIONAL RESOURCES OR CAPTURED<br />
LECTURES<br />
Regularly<br />
Never / NA<br />
Occasionally<br />
Rarely<br />
! +*! !<br />
!
While it remains a minority of faculty that say that <strong>the</strong>y regularly or occasionally<br />
produce such digital materials, <strong>the</strong> picture changes considerably when those<br />
faculty with blended or online teaching experience are examined. A majority of<br />
all faculty who are teaching an online and/or blended course report that <strong>the</strong>y<br />
have produced digital teaching materials. Among those who are teaching both<br />
online and blended courses <strong>the</strong> percentage rises to 66 percent. Faculty teaching<br />
ei<strong>the</strong>r fully online or partly online (as in a blended course) will have more<br />
exposure and experience with digital delivery – and probably more experience<br />
in using <strong>the</strong> digital tools provided by <strong>the</strong>ir institution. We might, <strong>the</strong>refore,<br />
expect faculty with online and blended teaching responsibilities to be among <strong>the</strong><br />
most receptive to OER adoption.<br />
FACULTY: CREATED DIGITAL TEACHING MATERIALS/OPEN EDUCATIONAL<br />
RESOURCES OR CAPTURED LECTURES BY ONLINE AND BLENDED<br />
TEACHING STATUS<br />
Teach Nei<strong>the</strong>r<br />
Teach Blended<br />
Teach Online<br />
Teach Online and Teach Blended<br />
0% 10% 20% 30% 40% 50% 60% 70%<br />
Regularly<br />
Occasionally<br />
Given that faculty are large consumers of digital materials as part of <strong>the</strong>ir<br />
teaching, and that a substantial minority say that <strong>the</strong>y regularly or occasionally<br />
produce such digital materials, does this mean that <strong>the</strong>y believe that <strong>the</strong>ir<br />
institutions have embraced <strong>the</strong> production of digital resources? Faculty were<br />
asked if <strong>the</strong>y believed that <strong>the</strong>ir institution has “a fair system of rewarding<br />
contributions made to digital pedagogy.” Faculty are evenly divided on this –<br />
with only slightly more faculty disagreeing with this statement than those<br />
reporting that <strong>the</strong>y agree. By far <strong>the</strong> largest proportion of faculty (40%) are<br />
neutral. The implication for OER in this result it that, for most faculty, <strong>the</strong>re<br />
are no strong institutional dis-incentives to <strong>the</strong>ir potential creation of <strong>the</strong>ir own<br />
OER materials.<br />
! +"! !<br />
!
FACULTY: MY INSTITUTION HAS A FAIR SYSTEM OF<br />
REWARDING CONTRIBUTIONS MADE TO DIGITAL<br />
PEDAGOGY<br />
Strongly<br />
Disagree<br />
Strongly<br />
Agree<br />
Agree<br />
!Disagree<br />
Neutral<br />
Comparisons of <strong>the</strong> attitudes of faculty members with those of <strong>the</strong> academic<br />
technology administrators on <strong>the</strong>ir campus has consistently shown that faculty<br />
are more pessimistic than are <strong>the</strong> administrators. This pattern is also evident<br />
here – a larger proportion of academic technology administrators believe that<br />
<strong>the</strong> institution has a fair system of rewards in place than do <strong>the</strong> faculty<br />
members. Among administrators, 35 percent agree or strongly agree that <strong>the</strong>re<br />
is a fair reward system in place, while <strong>the</strong> corresponding number of faculty is<br />
only 27 percent. The difference, however, is far less than that observed for<br />
many o<strong>the</strong>r aspects of teaching with technology (for example on <strong>the</strong> question of<br />
having good tools in place to assess <strong>the</strong> quality of online education, over 50% of<br />
administrators report that <strong>the</strong>y do compared to only 20% of faculty). 6<br />
! "Allen, I Elaine, Jeff Seaman, with Doug Lederman, Scott Jaschik, Conflicted, Faculty and Online Education, 2012, Babson<br />
Survey Research Group."<br />
! ++! !<br />
!
FACULTY AND ADMINISTRATORS: MY INSTITUTION HAS A FAIR SYSTEM OF<br />
REWARDING CONTRIBUTIONS MADE TO DIGITAL PEDAGOGY<br />
Administrator<br />
Faculty<br />
0% 5% 10% 15% 20% 25% 30% 35% 40%<br />
Strongly Agree<br />
Agree<br />
What criteria do faculty use in selecting <strong>the</strong>ir digital resources? Cost (88%<br />
reporting as important or very important) and ease of use (86%) top all o<strong>the</strong>r<br />
dimensions. The ability to quickly search and review <strong>the</strong> material is also critical,<br />
mentioned by 82 percent of faculty. Integration with <strong>the</strong> institutional learning<br />
manage systems (LMS) is also important for most faculty. This is most critical for<br />
faculty who are teaching online, where <strong>the</strong> entire course delivery may require <strong>the</strong><br />
LMS. Having <strong>the</strong> resources mapped to particular learning outcomes is mentioned<br />
by 62 percent of faculty. Slightly fewer than one-half of all faculty report that<br />
faculty rating and comments are important to <strong>the</strong>ir selection process.<br />
FACULTY: CRITERIA FOR SELECTING ONLINE RESOURCES<br />
Is easy to use<br />
Is available for free or low cost<br />
Can be searched and reviewed quickly<br />
Easily integrate with my institutions LMS<br />
Is mapped to particular learning outcomes<br />
Has faculty ratings and comments<br />
0% 10% 20% 30% 40% 50% 60% 70% 80% 90% 100%<br />
Very Important<br />
Important<br />
! +#! !<br />
!
Faculty are large consumers of digital materials for teaching. What prevents<br />
even wider use of <strong>the</strong>se materials? To address this question faculty were<br />
specifically asked to rate how important of a number of potential barriers would<br />
be to <strong>the</strong>ir adoption of open education resources. The time and effort to find<br />
and evaluate <strong>the</strong>se resources are consistently listed as <strong>the</strong> most important<br />
barriers. A majority of faculty report that difficultly in searching and <strong>the</strong> lack of<br />
a comprehensive catalog on OER materials are ‘Important’ or ‘Very important’<br />
barriers to <strong>the</strong>ir use of OER. These concerns are well aligned with <strong>the</strong> opinions<br />
of <strong>the</strong> chief academic officers, where a similar proportion noted that <strong>the</strong> lack of<br />
single clearinghouse as a barrier.<br />
FACULTY: BARRIERS TO ADOPTION OF OER<br />
Difficulty in searching<br />
Lack of a comprehensive catalog<br />
Concerns about <strong>the</strong> time to learn and use<br />
Need better mapping to learning outcomes<br />
Lack of support for non-local curriculum<br />
Lack of faculty ratings and comments<br />
0% 10% 20% 30% 40% 50% 60% 70%<br />
Very Important<br />
Important<br />
Faculty are more likely to have a level of concern with <strong>the</strong> time to learn and use<br />
open education resources than do <strong>the</strong>ir academic leaders. Only 23 percent of<br />
chief academic officers listed concerns about time and energy as a potential<br />
barrier. This compares with <strong>the</strong> 59 percent of faculty who do so.<br />
Smaller numbers of faculty report concerns in mapping to specific learning<br />
outcomes and <strong>the</strong> lack of support at <strong>the</strong>ir institutions for non-local curriculum. The<br />
lowest ranked barrier, a lack of faculty rating and comments on OER resources is<br />
still rated as important or very important by over one-third of all faculty.<br />
! +$! !<br />
!
It is sometimes hypo<strong>the</strong>sized that younger faculty members have a more<br />
positive attitude towards new technologies. There is some evidence to suggest<br />
that this might be <strong>the</strong> case. For example, younger faculty are much greater<br />
users of social media, both for personal and professions purposes, than are<br />
older faculty 7 . Is <strong>the</strong>re a similar age effect in attitudes towards of open<br />
education resources?<br />
It does appear that older faculty have a greater level of concern with all of <strong>the</strong><br />
potential barriers than do younger faculty. Faculty under <strong>the</strong> age of 35 report<br />
<strong>the</strong> lowest level of concern for every potential barrier, while those age 45 to 55<br />
and over 55 have <strong>the</strong> highest level of concern. The greatest age difference is<br />
around <strong>the</strong> issue <strong>the</strong> amount of time it will take to learn and use <strong>the</strong> materials –<br />
<strong>the</strong>re is a ten point difference between <strong>the</strong> youngest (under 35) group and <strong>the</strong><br />
next oldest (44% compared with 55% for those aged 35 to 44). Older faculty<br />
have an even higher levels of concern (61% for those aged 45 to 55 and 62% for<br />
those over 55).<br />
FACULTY: BARRIERS TO ADOPTION OF OER BY AGE<br />
70%<br />
60%<br />
50%<br />
40%<br />
30%<br />
55+<br />
20%<br />
45-54<br />
35-44<br />
10%<br />
Under 35<br />
0%<br />
Difficulty in<br />
searching<br />
Lack of a<br />
comprehensive<br />
catalog<br />
Lack of faculty<br />
ratings and<br />
comments<br />
Need better<br />
mapping to<br />
Lack of support for<br />
non-local<br />
learning outcomes curriculum<br />
Concerns about<br />
<strong>the</strong> time to learn<br />
and use<br />
# "Moran, Mike, Jeff Seaman, Hester Tinti-Kane, Blogs, Wikis, Podcasts and Facebook: How Today’s Higher Education Faculty<br />
Use Social Media, Pearson learning Solutions and Babson Survey Research Group."<br />
! +%! !<br />
!
In addition to an age effect on faculty adoption of open education resources,<br />
<strong>the</strong>re also appears to be gender differences. Female faculty members report<br />
higher levels of concern for every barrier examined. In two of <strong>the</strong>se cases,<br />
difficulty in searching and <strong>the</strong> need for better mapping to learning outcomes, <strong>the</strong><br />
difference exceeds ten percentage points. Are female faculty members just<br />
more critical consumers, or is <strong>the</strong>re something else going on here? Is it possible<br />
that, o<strong>the</strong>r things being equal, women faculty perceive higher barriers to<br />
promotion and tenure and believe that using outside sources in <strong>the</strong>ir classes<br />
may hinder <strong>the</strong>ir path forward?<br />
FACULTY: BARRIERS TO ADOPTION OF OER BY GENDER<br />
80%<br />
70%<br />
60%<br />
50%<br />
40%<br />
30%<br />
20%<br />
Female<br />
Male<br />
10%<br />
0%<br />
Difficulty in<br />
searching<br />
Lack of a<br />
comprehensive<br />
catalog<br />
Lack of faculty<br />
ratings and<br />
comments<br />
Need better<br />
mapping to<br />
learning outcomes<br />
Lack of support for<br />
non-local<br />
curriculum<br />
Concerns about <strong>the</strong><br />
time to learn and<br />
use<br />
! +&! !<br />
!
SURVEY METHODOLOGY<br />
This study reports <strong>the</strong> results of four surveys of key participants in U.S. Higher<br />
Education. Each survey was designed to reach a representative cross-section of<br />
<strong>the</strong> relevant higher education population. The target respondents were chief<br />
academic officers (<strong>the</strong> highest-ranking official at <strong>the</strong> institution with direct<br />
responsibility for <strong>the</strong> academic program), academic technology administrators,<br />
and teaching faculty.<br />
The chief academic officer survey was directed to all active, degree-granting<br />
institutions of higher education in <strong>the</strong> United States. All sample schools were<br />
sent an invitation email and reminders, inviting <strong>the</strong>ir participation and assuring<br />
<strong>the</strong>m that no individual responses would be released. The sample universe<br />
contains 4,523 institutions; a total of 2,512 responses were included in <strong>the</strong><br />
analysis, representing 56 percent of <strong>the</strong> sample universe. Because nonresponding<br />
institutions are predominately those with <strong>the</strong> smallest enrollments,<br />
<strong>the</strong> institutions included in <strong>the</strong> analysis represents 80 percent of higher<br />
education enrollments. There were 2,590 responses in 2009 and 2,583 in 2010.<br />
A second outreach effort focused on academic administrators – in particular<br />
those responsible for academic technology at <strong>the</strong>ir institutions. There are a<br />
wide variety of titles among those invited to participate – <strong>the</strong> most common<br />
being “Director of Academic Computing” and “Director of Instructional<br />
Technology.” A total of 591 administrators provided a sufficient number of<br />
responses to be included in <strong>the</strong> study. The respondents include slightly more<br />
men than women, with about one-quarter having been in <strong>the</strong>ir current position<br />
for 20 years or more.<br />
There are two nationally representative faculty samples used in this analysis –<br />
both were collected using identical techniques designed to be representative of<br />
<strong>the</strong> overall range of faculty teaching in U.S. higher education. A multiple-stage<br />
selection process was used for selecting a stratified sample of all teaching faculty.<br />
The process began by obtaining data from a commercial source, Market Data<br />
Retrieval 8 , which claims that its records represent 93 percent of all teaching<br />
faculty. A total of 1,506,627 teaching faculty (defined as having at least one<br />
course code associated with <strong>the</strong>ir records) were included at that stage. Via<br />
information from <strong>the</strong> Carnegie Classification for each institution, faculty were<br />
<strong>the</strong>n randomly selected from <strong>the</strong> master list in proportion to <strong>the</strong> number<br />
contained in each Carnegie Classification to produce two non-overlapping<br />
second-stage selections of 75,000 teaching faculty members each. These samples<br />
were <strong>the</strong>n checked against opt-out lists, as well as for non-functioning email<br />
addresses. Approximately twelve percent of all emails were removed at this<br />
stage. The number of email addresses that were still receiving mail, but no<br />
longer actively being used by <strong>the</strong> individual being addressed (e.g., moved or<br />
retired) is unknown. Spam filters at both <strong>the</strong> institution and <strong>the</strong> individual level<br />
also captured an unknown proportion of <strong>the</strong>se emails.<br />
$ "http://www.schooldata.com/"<br />
! +'! !<br />
!
A total of 3,875 faculty members in <strong>the</strong> first sample provided a sufficient number<br />
of responses to be included in <strong>the</strong> study. Three-quarters of <strong>the</strong> respondents<br />
report that <strong>the</strong>y are full-time faculty members. Just under one-quarter teach<br />
online, slightly over one-half are female, and over one-third have been teaching<br />
for 20 years or more.<br />
A total of 4,564 faculty responded to <strong>the</strong> second survey, representing <strong>the</strong> full<br />
range of higher education institutions (two-year, four-year, all Carnegie<br />
classifications, and public, private nonprofit, and for-profit) and <strong>the</strong> complete<br />
range of faculty (full- and part-time, tenured or not, and all disciplines). Threequarters<br />
of <strong>the</strong> respondents report that <strong>the</strong>y are full-time faculty members. Just<br />
over one-quarter teach online, <strong>the</strong>y are evenly split between male and female,<br />
and over one-third have been teaching for 20 years or more.<br />
Institutional descriptive data used in all <strong>the</strong> surveys come from <strong>the</strong> College<br />
Board Annual Survey of Colleges and from <strong>the</strong> National Center for Educational<br />
Statistics’ IPEDS database. After <strong>the</strong> data were compiled and merged with <strong>the</strong><br />
College Board Annual College Survey 9 and IPEDS database, responders and<br />
nonresponders were compared to create weights, if necessary, to ensure that<br />
<strong>the</strong> survey results reflected <strong>the</strong> characteristics of <strong>the</strong> entire population of<br />
schools. The responses are compared for 35 unique categories based on <strong>the</strong><br />
2005 Carnegie Classification of Institutions of Higher Education. These weights<br />
provide a small adjustment to <strong>the</strong> results allowing for inferences to be made<br />
about <strong>the</strong> entire population of active, degree-granting institutions of higher<br />
education in <strong>the</strong> United States.<br />
% "Portions of <strong>the</strong> data used for this report were collected by The College Board as part of <strong>the</strong> Annual Survey of<br />
Colleges and is Copyright © 2010-2011 The College Board."<br />
"<br />
! +(! !<br />
!
APPENDIX TABLES<br />
Awareness of Open Educational Resources (OER)<br />
CHIEF ACADEMIC OFFICER AWARENESS OF OPEN EDUCATIONAL RESOURCES - FALL<br />
2011<br />
Very aware 13.5%<br />
Aware 37.7%<br />
Somewhat aware 35.5%<br />
Not aware 13.3%<br />
CHIEF ACADEMIC OFFICERS AWARE OR VERY AWARE OF OPEN EDUCATIONAL<br />
RESOURCES BY INSTITUTIONAL CONTROL - FALL 2011<br />
Private for-profit Private nonprofit Public<br />
Aware or very aware 53.5% 42.0% 59.2%<br />
CHIEF ACADEMIC OFFICERS AWARE OR VERY AWARE OF OPEN EDUCATIONAL<br />
RESOURCES BY CARNEGIE CLASSIFICATION - FALL 2011<br />
Specialized Associates Baccalaureate Masters Doctoral/Research<br />
Aware or very aware 36.6% 56.9% 48.3% 46.6% 60.7%<br />
Chief Academic Officers Aware or Very Aware of Open Educational Resources by Online Offerings -<br />
Fall 2011<br />
Courses and full programs Courses only No offerings<br />
Aware or very aware 59.4% 49.8% 28.3%<br />
CHIEF ACADEMIC OFFICERS AWARE OR VERY AWARE OF OPEN EDUCATIONAL<br />
RESOURCES BY TOTAL ENROLLMENT - FALL 2011<br />
Under 1500 1500 - 2999 3000 - 7499 7500 - 14999 15000+<br />
Aware or very aware 44.1% 54.5% 56.8% 54.7% 69.2%<br />
! !<br />
!<br />
+)!
Use of OER<br />
USE OF OPEN EDUCATIONAL RESOURCES BY TYPE OF COURSE - FALL 2011<br />
Online Blended Face-to-face<br />
Not currently use - unsure if will implement 12.9% 10.8% 16.0%<br />
Not currently use, but plan to implement 13.2% 15.9% 9.1%<br />
Currently Use 50.2% 46.4% 51.0%<br />
Do Not Use 23.7% 26.9% 23.9%<br />
USE OF OPEN EDUCATIONAL RESOURCES BY TOTAL ENROLLMENT AND TYPE OF<br />
COURSE - FALL 2011<br />
Under 1500 1500 - 2999 3000 - 7499 7500 - 14999 15000+<br />
Online Courses 47.0% 44.3% 60.8% 48.4% 54.8%<br />
Blended Courses 41.9% 51.7% 49.8% 42.4% 53.7%<br />
Face-to-face courses 52.6% 55.0% 48.3% 39.1% 52.7%<br />
USE OF OPEN EDUCATIONAL RESOURCES IN ONLINE COURSES - FALL 2010 AND 2011<br />
2011 2010<br />
Not currently use - unsure if will implement 12.9% 12.2%<br />
Not currently use, but plan to implement 13.2% 5.3%<br />
Currently Use 50.2% 49.3%<br />
! !<br />
!<br />
#*!
Perceived Value of OER<br />
CHIEF ACADEMIC OFFICERS: OPEN EDUCATIONAL RESOURCES WILL BE OF VALUE FOR<br />
MY CAMPUS - FALL 2011<br />
Agree 56.6%<br />
Neutral 38.7%<br />
Disagree 4.6%<br />
CHIEF ACADEMIC OFFICERS: OPEN EDUCATIONAL RESOURCES WILL BE OF VALUE FOR<br />
MY CAMPUS BY INSTITUTIONAL CONTROL - FALL 2009 AND FALL 2011<br />
Private for-profit Private nonprofit Public<br />
2009 49.8% 44.6% 56.5%<br />
2011 72.4% 45.5% 60.9%<br />
CHIEF ACADEMIC OFFICERS: OPEN EDUCATIONAL RESOURCES WILL BE OF VALUE FOR<br />
MY CAMPUS BY OVERALL ENROLLMENT - FALL 2009 AND FALL 2011<br />
Under 1500 1500 - 2999 3000 - 7499 7500 - 14999 15000+<br />
2009 47.5% 54.1% 55.4% 48.4% 49.5%<br />
2011 56.7% 57.6% 58.0% 57.7% 47.5%<br />
CHIEF ACADEMIC OFFICERS: OPEN EDUCATIONAL RESOURCES WILL BE OF VALUE FOR<br />
MY CAMPUS BY CARNEGIE CLASSIFICATION - FALL 2009 AND FALL 2011<br />
Specialized Associates Baccalaureate Masters Doctoral/Research<br />
2009 54.8% 57.9% 33.5% 44.8% 30.0%<br />
2011 48.1% 69.5% 45.8% 46.6% 45.1%<br />
CHIEF ACADEMIC OFFICERS: OPEN EDUCATIONAL RESOURCES WILL BE OF VALUE FOR<br />
MY CAMPUS BY ONLINE OFFERINGS - FALL 2009 AND FALL 2011<br />
Courses and full programs Courses only No offerings<br />
2009 58.6% 49.8% 37.0%<br />
2011 58.4% 61.6% 43.3%<br />
! !<br />
!<br />
#"!
Saving Time and Money<br />
CHIEF ACADEMIC OFFICERS: OPEN EDUCATIONAL RESOURCES HAVE THE POTENTIAL<br />
TO SAVE MY INSTITUTION MONEY - FALL 2011<br />
Strongly Agree 17.7%<br />
Agree 47.5%<br />
Neutral 28.8%<br />
Disagree 5.0%<br />
Strongly Disagree 1.1%<br />
CHIEF ACADEMIC OFFICERS: OPEN EDUCATIONAL RESOURCES HAVE THE POTENTIAL<br />
TO SAVE MY INSTITUTION MONEY BY CARNEGIE CLASSIFICATION - FALL 2011<br />
Specialized Associates Baccalaureate Masters Doctoral/Research<br />
Strongly Agree 14.1% 21.1% 18.9% 10.8% 16.1%<br />
Agree 43.6% 51.0% 37.6% 50.2% 35.7%<br />
Neutral 30.6% 25.3% 34.0% 32.0% 39.7%<br />
Disagree 10.9% 1.8% 6.4% 6.4% 8.5%<br />
Strongly Disagree .8% .9% 3.1% .5% .0%<br />
CHIEF ACADEMIC OFFICERS: OPEN EDUCATIONAL RESOURCES HAVE THE POTENTIAL<br />
TO SAVE MY INSTITUTION MONEY BY TYPE OF ONLINE OFFERINGS - FALL 2011<br />
Courses and full programs Courses only No offerings<br />
Strongly Agree 18.2% 23.0% 9.2%<br />
Agree 50.8% 44.1% 40.8%<br />
Neutral 25.3% 28.3% 39.6%<br />
Disagree 4.7% 3.9% 8.2%<br />
Strongly Disagree .9% .7% 2.2%<br />
CHIEF ACADEMIC OFFICERS: OPEN EDUCATIONAL RESOURCES HAVE THE POTENTIAL<br />
TO SAVE MY INSTITUTION BY INSTITUTIONAL CONTROL - FALL 2011<br />
Private for-profit Private nonprofit Public<br />
Strongly Agree 17.1% 15.2% 20.3%<br />
Agree 50.2% 42.6% 50.5%<br />
Neutral 29.1% 34.5% 23.1%<br />
Disagree 3.5% 5.9% 5.0%<br />
Strongly Disagree .0% 1.8% 1.0%<br />
CHIEF ACADEMIC OFFICERS: OPEN EDUCATIONAL RESOURCES CAN SAVE TIME IN<br />
DEVELOPING NEW COURSES - FALL 2011<br />
Strongly Agree 7.8%<br />
Agree 49.5%<br />
Neutral 32.4%<br />
Disagree 8.9%<br />
Strongly Disagree 1.4%<br />
! !<br />
!<br />
#+!
CHIEF ACADEMIC OFFICERS: OPEN EDUCATIONAL RESOURCES CAN SAVE TIME IN<br />
DEVELOPING NEW COURSES BY TYPE OF ONLINE OFFERINGS - FALL 2011<br />
Courses and full programs Courses only No offerings<br />
Strongly Agree 9.5% 8.3% 1.9%<br />
Agree 52.5% 55.1% 33.3%<br />
Neutral 28.3% 26.9% 50.8%<br />
Disagree 8.5% 9.7% 9.8%<br />
Strongly Disagree 1.1% .0% 4.3%<br />
! !<br />
!<br />
##!
The Gatekeepers<br />
HAS A ROLE IN DECISION TO ADOPT OER - FALL 2011<br />
Individual faculty 62.8%<br />
Faculty committee 60.1%<br />
Program or division 57.7%<br />
Instructional design group 43.2%<br />
Administration 58.2%<br />
O<strong>the</strong>r 6.2%<br />
Note: Respondents can give multiple answers<br />
HAS A ROLE IN DECISION TO ADOPT OER - FALL 2011<br />
Under 1500 1500 - 2999 3000 - 7499 7500 - 14999 15000+<br />
Individual faculty 66.7% 62.8% 63.8% 53.3% 48.1%<br />
Faculty committee 59.6% 61.6% 59.7% 62.0% 64.9%<br />
Program or division 49.5% 71.9% 55.7% 68.0% 79.4%<br />
Instructional design group 31.9% 51.4% 51.3% 55.6% 64.3%<br />
Administration 64.1% 55.9% 52.3% 49.3% 50.0%<br />
O<strong>the</strong>r 5.9% 4.6% 7.2% 8.6% 5.8%<br />
Note: Respondents can give multiple answers<br />
PRIMARY ROLE IN DECISION TO ADOPT OER - FALL 2011<br />
Individual faculty 47.0%<br />
Faculty committee 12.1%<br />
Program or division 9.5%<br />
Instructional design group 3.5%<br />
Administration 26.8%<br />
PRIMARY ROLE IN DECISION TO ADOPT OER - FALL 2011<br />
Private for-profit Private nonprofit Public<br />
Administration 38.0% 27.5% 19.3%<br />
Individual faculty 19.4% 53.0% 57.4%<br />
PRIMARY ROLE IN DECISION TO ADOPT OER - FALL 2011<br />
Doctoral/Research Masters Baccalaureate Associates Specialized<br />
Administration 12.9% 17.4% 17.3% 33.1% 31.8%<br />
Individual faculty 74.5% 61.7% 53.8% 33.5% 49.2%<br />
! !<br />
!<br />
#$!
Potential Barriers<br />
CHIEF ACADEMIC OFFICERS: OPINIONS ABOUT OPEN EDUCATIONAL RESOURCES -<br />
FALL 2011<br />
Agree Strongly Agree<br />
Will never be accepted by my faculty 7.9% .5%<br />
Are not available to meet my institution's particular needs 13.0% 1.4%<br />
Are not yet of sufficient quality for my institution 17.6% 1.8%<br />
Require too much time and energy to find and evaluate 19.9% 2.6%<br />
Would be much more useful if <strong>the</strong>re was a single clearinghouse 39.3% 20.0%<br />
CHIEF ACADEMIC OFFICERS: OPEN EDUCATION RESOURCES WOULD BE MORE USEFUL<br />
IF THERE WAS A SINGLE CLEARINGHOUSE - FALL 2011<br />
Courses and full programs Courses only No offerings<br />
Strongly Agree 22.5% 18.1% 15.8%<br />
Agree 38.5% 48.2% 30.6%<br />
Neutral 30.8% 24.1% 42.8%<br />
Disagree 5.6% 6.5% 7.9%<br />
Strongly Disagree 2.6% 3.1% 2.9%<br />
CHIEF ACADEMIC OFFICERS: OPEN EDUCATION RESOURCES WOULD BE MORE USEFUL<br />
IF THERE WAS A SINGLE CLEARINGHOUSE - FALL 2011<br />
Private for-profit Private nonprofit Public<br />
Strongly Agree 12.1% 18.1% 26.4%<br />
Agree 37.0% 36.9% 42.8%<br />
Neutral 38.3% 36.2% 23.2%<br />
Disagree 7.0% 6.5% 5.7%<br />
Strongly Disagree 5.6% 2.2% 1.9%<br />
CHIEF ACADEMIC OFFICERS: OPEN EDUCATIONAL RESOURCES WILL NEVER BY<br />
ACCEPTED BY MY FACULTY - FALL 2011<br />
Strongly Agree 0.5%<br />
Agree 7.9%<br />
Neutral 40.2%<br />
Disagree 41.5%<br />
Strongly Disagree 10.0%<br />
! !<br />
!<br />
#%!
The Faculty View<br />
FACULTY: USED DIGITAL MATERIALS SUCH AS SIMULATIONS AND VIDEOS IN COURSE<br />
PRESENTATIONS<br />
Regularly Occasionally Rarely Never / NA<br />
46.7% 36.2% 11.3% 5.8%<br />
FACULTY: CREATED DIGITAL TEACHING MATERIALS/OPEN EDUCATIONAL RESOURCES<br />
OR CAPTURED LECTURES<br />
Regularly Occasionally Rarely Never / NA<br />
20.2% 22.8% 17.0% 39.9%<br />
FACULTY: CREATED DIGITAL TEACHING MATERIALS/OPEN EDUCATIONAL RESOURCES<br />
OR CAPTURED LECTURES BY ONLINE AND BLENDED TEACHING STATUS<br />
Online and Blended Teaching Status Regularly Occasionally Rarely Never / NA<br />
Teach Online and Teach Blended 35.0% 31.4% 14.0% 19.6%<br />
Teach Online 34.6% 26.7% 13.2% 25.5%<br />
Teach Blended 28.3% 25.3% 16.9% 29.5%<br />
Teach Nei<strong>the</strong>r 12.4% 19.6% 18.6% 49.3%<br />
FACULTY: MY INSTITUTION HAS A FAIR SYSTEM OF REWARDING CONTRIBUTIONS<br />
MADE TO DIGITAL PEDAGOGY<br />
Strongly Agree Agree Neutral Disagree Strongly Disagree<br />
6.3% 21.1% 39.8% 23.7% 9.1%<br />
FACULTY AND ADMINISTRATORS: MY INSTITUTION HAS A FAIR SYSTEM OF<br />
REWARDING CONTRIBUTIONS MADE TO DIGITAL PEDAGOGY<br />
Strongly Agree<br />
Agree<br />
Faculty 6.3% 21.1%<br />
Administrator 11.0% 24.3%<br />
FACULTY: CRITERIA FOR SELECTING ONLINE RESOURCES<br />
Very<br />
Somewhat Not<br />
Important Important Important Important<br />
Has faculty ratings and comments 16.6% 26.8% 31.8% 24.9%<br />
Is mapped to particular learning<br />
27.6% 34.7% 22.7% 15.0%<br />
outcomes<br />
Easily integrate with my institutions 34.5% 31.2% 17.4% 16.9%<br />
LMS<br />
Can be searched and reviewed quickly 40.8% 41.5% 12.2% 5.5%<br />
Is available for free or low cost 56.2% 29.7% 9.9% 4.3%<br />
Is easy to use 56.4% 31.4% 8.8% 3.5%<br />
! !<br />
!<br />
#&!
FACULTY: BARRIERS TO ADOPTION OF OER<br />
Very<br />
Important<br />
Important<br />
Somewhat<br />
Important<br />
Not<br />
Important<br />
Lack of faculty ratings and comments 10.6% 25.6% 37.8% 26.0%<br />
Lack of support for non-local<br />
13.0% 25.5% 28.9% 32.7%<br />
curriculum<br />
Need better mapping to learning<br />
14.4% 32.8% 32.2% 20.7%<br />
outcomes<br />
Concerns about <strong>the</strong> time to learn and<br />
use<br />
26.0% 32.8% 26.2% 15.1%<br />
Lack of a comprehensive catalog 20.0% 39.4% 26.9% 13.7%<br />
Difficulty in searching 24.2% 38.2% 24.8% 12.8%<br />
FACULTY: BARRIERS TO ADOPTION OF OER BY AGE<br />
Under 35 35-44 45-54 55+<br />
Difficulty in searching 57.0% 59.4% 66.6% 62.1%<br />
Lack of a comprehensive catalog 51.4% 59.0% 61.9% 59.4%<br />
Lack of faculty ratings and comments 27.1% 30.5% 38.1% 39.5%<br />
Need better mapping to learning outcomes 37.7% 43.1% 48.6% 50.2%<br />
Lack of support for non-local curriculum 33.6% 38.0% 38.7% 39.5%<br />
Concerns about <strong>the</strong> time to learn and use 43.8% 54.6% 61.3% 62.1%<br />
FACULTY: BARRIERS TO ADOPTION OF OER BY GENDER<br />
Female Male<br />
Difficulty in searching 68.2% 55.3%<br />
Lack of a comprehensive catalog 63.2% 54.6%<br />
Lack of faculty ratings and comments 39.6% 32.1%<br />
Need better mapping to learning outcomes 51.9% 41.3%<br />
Lack of support for non-local curriculum 39.8% 36.7%<br />
Concerns about <strong>the</strong> time to learn and use 63.4% 52.9%<br />
! !<br />
!<br />
#'!
BABSON SURVEY RESEARCH GROUP<br />
The study design, survey administration, analysis and report production for this report is <strong>the</strong><br />
responsibility of <strong>the</strong> Babson Survey Research Group.<br />
The Babson Survey Research Group in <strong>the</strong> Arthur M. Blank Center for Entrepreneurial<br />
Research at Babson College conducts regional, national, and international research projects,<br />
including survey design, sampling methodology, data integrity, statistical analyses and reporting.<br />
Sloan Series of National and Regional Surveys of Online Education<br />
• Going <strong>the</strong> Distance: Online Education in <strong>the</strong> United States, 2012<br />
• Online Learning Trends in Private-Sector Colleges and Universities, 2011<br />
• Class Differences: Online Education in <strong>the</strong> United States, 2010<br />
• Learning on Demand: Online Education in <strong>the</strong> United States, 2009<br />
• Staying <strong>the</strong> Course: Online Education in <strong>the</strong> United States, 2008<br />
• Online Nation: Five Years of Growth in Online Learning<br />
• Making <strong>the</strong> Grade: Online Education in <strong>the</strong> United States, 2006<br />
• Making <strong>the</strong> Grade: Online Education in <strong>the</strong> United States, 2006 - Midwestern Edition<br />
• Making <strong>the</strong> Grade: Online Education in <strong>the</strong> United States, 2006 - Sou<strong>the</strong>rn Edition<br />
• <strong>Growing</strong> by Degrees: Online Education in <strong>the</strong> United States, 2005<br />
• <strong>Growing</strong> by Degrees: Online Education in <strong>the</strong> United States, 2005 - Sou<strong>the</strong>rn Edition<br />
• Entering <strong>the</strong> Mainstream: The Quality and Extent of Online Education in <strong>the</strong> United States,<br />
2003 and 2004<br />
• Sizing <strong>the</strong> Opportunity: The Quality and Extent of Online Education in <strong>the</strong> United States,<br />
2002 and 2003<br />
Sloan K-12 Online Learning Survey Reports<br />
• Online Learning In Illinois High Schools: Has The Time Come?<br />
• Class Connections: High School Reform and <strong>the</strong> Role of Online Learning<br />
• K–12 Online Learning: A 2008 follow-up of <strong>the</strong> Survey of U.S. School District<br />
Administrators<br />
• K–12 Online Learning: A Survey of U.S. School District Administrators<br />
The A!P!L!U-Sloan National Commission on Online Learning<br />
• Online Learning as a Strategic Asset, Volume II: The Paradox of Faculty Voices: Views<br />
and Experiences with Online Learning<br />
• Online Learning as a Strategic Asset: A Survey of APLU Presidents and Chancellors<br />
• Online Learning as a Strategic Asset: A Survey of NAFEO Presidents and Chancellors<br />
• Online Learning as a Strategic Asset: A Survey of AIHEC Tribal College and University<br />
! !<br />
!<br />
"#!
This research would not be possible without<br />
<strong>the</strong> assistance of a number of organizations.<br />
A grant from The William and Flora Hewlett<br />
Foundation supported <strong>the</strong> analysis and<br />
reporting of <strong>the</strong> chief academic officer results.<br />
Their background and knowledge of Open<br />
Education Resources was invaluable in helping<br />
to define <strong>the</strong> focus for all aspects of <strong>the</strong> study.<br />
The Global Healthy Living Foundation provided<br />
administration for <strong>the</strong> Hewlett grant.<br />
Additional support to expand <strong>the</strong> analysis to<br />
include faculty and academic technology<br />
administrators was provided by Pearson.<br />
Pearson also provided support for <strong>the</strong><br />
production and distribution of <strong>the</strong> final report.<br />
Results on chief academic officer are taken from <strong>the</strong><br />
data collection effort for <strong>the</strong> Babson Survey Research<br />
Group’s online learning report. The 2011 effort was<br />
supported by Kaplan University, Pearson, and <strong>the</strong><br />
Sloan Consortium. Support for 2009 and 2010 was<br />
provided by <strong>the</strong> Alfred P. Sloan Foundation.<br />
One faulty survey and <strong>the</strong> survey of academic<br />
technology administrators was conducted as a joint<br />
project by <strong>the</strong> Babson Survey Research Group with<br />
Inside Higher Ed. Four companies – CourseSmart,<br />
Deltak, Pearson and Sonic Foundry – provided <strong>the</strong><br />
support to make that research effort possible.<br />
A second faculty survey was supported by Pearson.<br />
Copyright ©2012 by Quahog Research Group, LLC<br />
and Babson Survey Research Group