UV/H2O2 Treatment an Essential Barrier in a - PWN Technologies
UV/H2O2 Treatment an Essential Barrier in a - PWN Technologies
UV/H2O2 Treatment an Essential Barrier in a - PWN Technologies

You also want an ePaper? Increase the reach of your titles
YUMPU automatically turns print PDFs into web optimized ePapers that Google loves.
Full Scale <strong>UV</strong>/<strong>H2O2</strong> Installation<br />
Upon start up of the retrofitted pl<strong>an</strong>t Andijk, a site accept<strong>an</strong>ce test was performed. For operat<strong>in</strong>g purposes, the<br />
<strong>UV</strong>/<strong>H2O2</strong> <strong>in</strong>stallation is equipped with a control-unit, calculat<strong>in</strong>g the atraz<strong>in</strong>e degradation capacity under actual<br />
process conditions. Both for the ‘<strong>in</strong>stallation software’ as for the ‘k<strong>in</strong>etic model prediction’, the presented<br />
predictions were based on the actual water characteristics.<br />
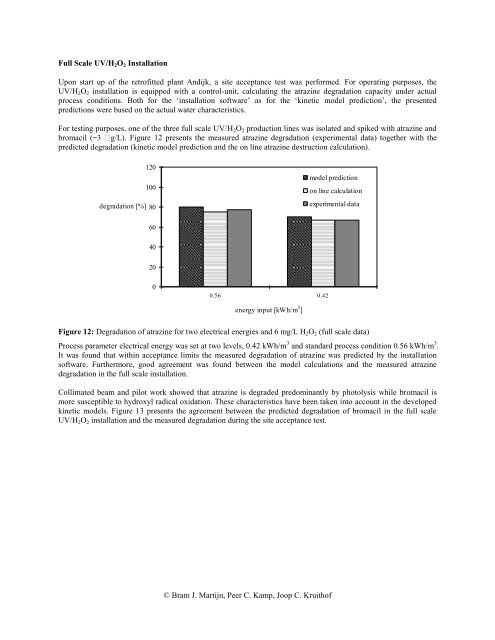
For test<strong>in</strong>g purposes, one of the three full scale <strong>UV</strong>/<strong>H2O2</strong> production l<strong>in</strong>es was isolated <strong>an</strong>d spiked with atraz<strong>in</strong>e <strong>an</strong>d<br />
bromacil (~3 �g/L). Figure 12 presents the measured atraz<strong>in</strong>e degradation (experimental data) together with the<br />
predicted degradation (k<strong>in</strong>etic model prediction <strong>an</strong>d the on l<strong>in</strong>e atraz<strong>in</strong>e destruction calculation).<br />
120<br />
100<br />
degradation [%] 80<br />
60<br />
40<br />
20<br />
0<br />
0.56 0.42<br />
energy <strong>in</strong>put [kWh/m 3 ]<br />
© Bram J. Martijn, Peer C. Kamp, Joop C. Kruithof<br />
model prediction<br />
on l<strong>in</strong>e calculation<br />
experimental data<br />
Figure 12: Degradation of atraz<strong>in</strong>e for two electrical energies <strong>an</strong>d 6 mg/L <strong>H2O2</strong> (full scale data)<br />
Process parameter electrical energy was set at two levels, 0.42 kWh/m 3 <strong>an</strong>d st<strong>an</strong>dard process condition 0.56 kWh/m 3 .<br />
It was found that with<strong>in</strong> accept<strong>an</strong>ce limits the measured degradation of atraz<strong>in</strong>e was predicted by the <strong>in</strong>stallation<br />
software. Furthermore, good agreement was found between the model calculations <strong>an</strong>d the measured atraz<strong>in</strong>e<br />
degradation <strong>in</strong> the full scale <strong>in</strong>stallation.<br />
Collimated beam <strong>an</strong>d pilot work showed that atraz<strong>in</strong>e is degraded predom<strong>in</strong><strong>an</strong>tly by photolysis while bromacil is<br />
more susceptible to hydroxyl radical oxidation. These characteristics have been taken <strong>in</strong>to account <strong>in</strong> the developed<br />
k<strong>in</strong>etic models. Figure 13 presents the agreement between the predicted degradation of bromacil <strong>in</strong> the full scale<br />
<strong>UV</strong>/<strong>H2O2</strong> <strong>in</strong>stallation <strong>an</strong>d the measured degradation dur<strong>in</strong>g the site accept<strong>an</strong>ce test.