Capital
QFBvvS
QFBvvS
- No tags were found...

You also want an ePaper? Increase the reach of your titles
YUMPU automatically turns print PDFs into web optimized ePapers that Google loves.
ArthVeda <strong>Capital</strong> Fact Sheet<br />
ArthVeda Alpha UK100<br />
<strong>Capital</strong><br />
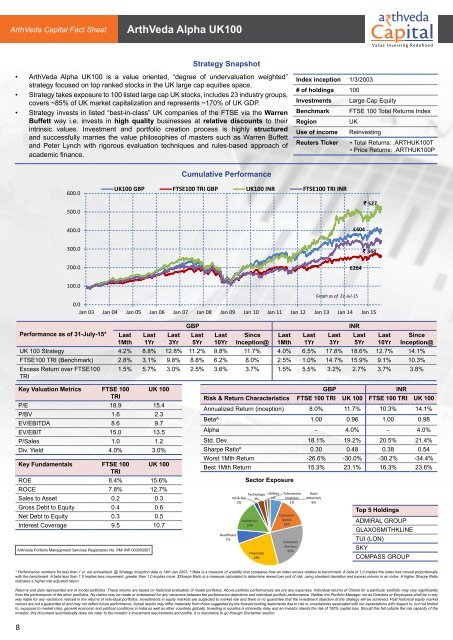
Strategy Snapshot<br />
• ArthVeda Alpha UK100 is a value oriented, “degree of undervaluation weighted”<br />
strategy focused on top ranked stocks in the UK large cap equities space.<br />
• Strategy takes exposure to 100 listed large cap UK stocks, includes 23 industry groups,<br />
covers ~85% of UK market capitalization and represents ~170% of UK GDP.<br />
• Strategy invests in listed “best-in-class” UK companies of the FTSE via the Warren<br />
Buffett way i.e. invests in high quality businesses at relative discounts to their<br />
intrinsic values. Investment and portfolio creation process is highly structured<br />
and successfully marries the value philosophies of masters such as Warren Buffett<br />
and Peter Lynch with rigorous evaluation techniques and rules-based approach of<br />
academic finance.<br />
Index inception 1/3/2003<br />
# of holdings 100<br />
Investments Large Cap Equity<br />
Benchmark FTSE 100 Total Returns Index<br />
Region<br />
UK<br />
Use of income Reinvesting<br />
Reuters Ticker • Total Returns: .ARTHUK100T<br />
• Price Returns: .ARTHUK100P<br />
600.0<br />
500.0<br />
Cumulative Performance<br />
UK100 GBP FTSE100 TRI GBP UK100 INR FTSE100 TRI INR<br />
₹ 527<br />
400.0<br />
£404<br />
300.0<br />
200.0<br />
£264<br />
₹ 344<br />
100.0<br />
Graph as of 31-Jul-15<br />
0.0<br />
Jan 03 Jan 04 Jan 05 Jan 06 Jan 07 Jan 08 Jan 09 Jan 10 Jan 11 Jan 12 Jan 13 Jan 14 Jan 15<br />
GBP<br />
INR<br />
Performance as of 31-July-15* Last<br />
1Mth<br />
Last<br />
1Yr<br />
Last<br />
3Yr<br />
Last<br />
5Yr<br />
Last<br />
10Yr<br />
Since<br />
Inception@<br />
Last<br />
1Mth<br />
Last<br />
1Yr<br />
Last<br />
3Yr<br />
Last<br />
5Yr<br />
Last<br />
10Yr<br />
Since<br />
Inception@<br />
UK 100 Strategy 4.2% 8.8% 12.8% 11.2% 9.8% 11.7% 4.0% 6.5% 17.8% 18.6% 12.7% 14.1%<br />
FTSE100 TRI (Benchmark) 2.8% 3.1% 9.8% 8.8% 6.2% 8.0% 2.5% 1.0% 14.7% 15.9% 9.1% 10.3%<br />
Excess Return over FTSE100<br />
TRI<br />
1.5% 5.7% 3.0% 2.5% 3.6% 3.7% 1.5% 5.5% 3.2% 2.7% 3.7% 3.8%<br />
Key Valuation Metrics FTSE 100 UK 100<br />
TRI<br />
P/E 18.9 15.4<br />
P/BV 1.6 2.3<br />
EV/EBITDA 8.6 9.7<br />
EV/EBIT 15.0 13.5<br />
P/Sales 1.0 1.2<br />
Div. Yield 4.0% 3.0%<br />
Key Fundamentals FTSE 100 UK 100<br />
TRI<br />
ROE 8.4% 15.6%<br />
ROCE 7.8% 12.7%<br />
Sales to Asset 0.2 0.3<br />
Gross Debt to Equity 0.4 0.6<br />
Net Debt to Equity 0.3 0.5<br />
Interest Coverage 9.5 10.7<br />
ArthVeda Portfolio Management Services Registration No. PM/ INP 000003567<br />
GBP<br />
INR<br />
Risk & Return Characteristics FTSE 100 TRI UK 100 FTSE 100 TRI UK 100<br />
Annualized Return (inception) 8.0% 11.7% 10.3% 14.1%<br />
Beta^ 1.00 0.96 1.00 0.98<br />
Alpha - 4.0% - 4.0%<br />
Std. Dev. 18.1% 19.2% 20.5% 21.4%<br />
Sharpe Ratio # 0.30 0.48 0.38 0.54<br />
Worst 1Mth Return -26.6% -30.0% -30.2% -34.4%<br />
Best 1Mth Return 15.3% 23.1% 16.3% 23.6%<br />
Healthcare<br />
7%<br />
Sector Exposure<br />
Technology<br />
Oil & Gas 3%<br />
2%<br />
Industrials<br />
16%<br />
Financials<br />
24%<br />
Utilities<br />
1%<br />
Telecommu<br />
nications<br />
1%<br />
Consumer<br />
Goods<br />
15%<br />
Consumer<br />
Services<br />
25%<br />
Basic<br />
Materials<br />
6%<br />
Top 5 Holdings<br />
ADMIRAL GROUP<br />
GLAXOSMITHKLINE<br />
TUI (LON)<br />
SKY<br />
COMPASS GROUP<br />
* Performance numbers for less than 1 yr. not annualized. @ Strategy Inception date is 14th Jan 2003. ^ Beta is a measure of volatility that compares how an index moves relative to benchmark. A beta of 1.0 implies the index has moved proportionally<br />
with the benchmark. A beta less than 1.0 implies less movement; greater than 1.0 implies more. $Sharpe Ratio is a measure calculated to determine reward per unit of risk, using standard deviation and excess returns in an index. A higher Sharpe Ratio<br />
indicates a higher risk-adjusted return.<br />
Returns and data represented are of model portfolios. These returns are based on historical evaluation of model portfolios. Above portfolio performances are pre any expenses. Individual returns of Clients for a particular portfolio may vary significantly<br />
from the performance of the other portfolios. No claims may be made or entertained for any variances between the performance depictions and individual portfolio performance. Neither the Portfolio Manager nor its Directors or Employees shall be in any<br />
way liable for any variations noticed in the returns of individual portfolios. Investments in equity markets are subjected to market risk and there is no guarantee that the investment objective of the strategy will be achieved. Past historical equity market<br />
returns are not a guarantee of and may not reflect future performance. Actual results may differ materially from those suggested by the forward looking statements due to risk or uncertainties associated with our expectations with respect to, but not limited<br />
to, exposure to market risks, general economic and political conditions in India as well as other countries globally. Investing in equities is inherently risky and an investor stands the risk of 100% capital loss. Should this fall outside the risk capacity of the<br />
investor, this document automatically does not cater to the investor’s investment requirements and profile. It is mandatory to go through Disclaimer section.<br />
8