Capital
QFBvvS
QFBvvS
- No tags were found...

You also want an ePaper? Increase the reach of your titles
YUMPU automatically turns print PDFs into web optimized ePapers that Google loves.
ArthVeda <strong>Capital</strong> Fact Sheet<br />
ArthVeda AlphaPlus Extreme 25<br />
<strong>Capital</strong><br />
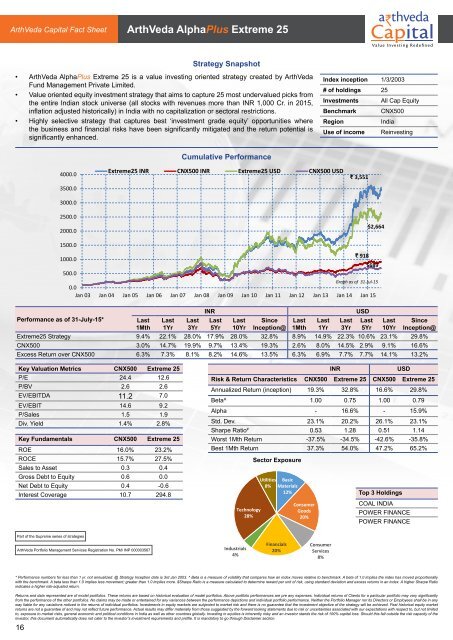
Strategy Snapshot<br />
• ArthVeda AlphaPlus Extreme 25 is a value investing oriented strategy created by ArthVeda<br />
Fund Management Private Limited.<br />
• Value oriented equity investment strategy that aims to capture 25 most undervalued picks from<br />
the entire Indian stock universe (all stocks with revenues more than INR 1,000 Cr. in 2015,<br />
inflation adjusted historically) in India with no capitalization or sectoral restrictions.<br />
• Highly selective strategy that captures best ‘investment grade equity’ opportunities where<br />
the business and financial risks have been significantly mitigated and the return potential is<br />
significantly enhanced.<br />
Index inception 1/3/2003<br />
# of holdings 25<br />
Investments All Cap Equity<br />
Benchmark CNX500<br />
Region<br />
India<br />
Use of income Reinvesting<br />
4000.0<br />
3500.0<br />
3000.0<br />
2500.0<br />
2000.0<br />
Cumulative Performance<br />
Extreme25 INR CNX500 INR Extreme25 USD CNX500 USD<br />
₹ 3,551<br />
$2,664<br />
1500.0<br />
1000.0<br />
₹ 918<br />
$689<br />
500.0<br />
Graph as of 31-Jul-15<br />
0.0<br />
Jan 03 Jan 04 Jan 05 Jan 06 Jan 07 Jan 08 Jan 09 Jan 10 Jan 11 Jan 12 Jan 13 Jan 14 Jan 15<br />
INR<br />
USD<br />
Performance as of 31-July-15*<br />
Last<br />
1Mth<br />
Last<br />
1Yr<br />
Last<br />
3Yr<br />
Last<br />
5Yr<br />
Last<br />
10Yr<br />
Since<br />
Inception@<br />
Last<br />
1Mth<br />
Last<br />
1Yr<br />
Last<br />
3Yr<br />
Last<br />
5Yr<br />
Last<br />
10Yr<br />
Since<br />
Inception@<br />
Extreme25 Strategy 9.4% 22.1% 28.0% 17.9% 28.0% 32.8% 8.9% 14.9% 22.3% 10.6% 23.1% 29.8%<br />
CNX500 3.0% 14.7% 19.9% 9.7% 13.4% 19.3% 2.6% 8.0% 14.5% 2.9% 9.1% 16.6%<br />
Excess Return over CNX500 6.3% 7.3% 8.1% 8.2% 14.6% 13.5% 6.3% 6.9% 7.7% 7.7% 14.1% 13.2%<br />
Key Valuation Metrics CNX500 Extreme 25<br />
P/E 24.4 12.6<br />
P/BV 2.6 2.6<br />
EV/EBITDA 11.2 7.0<br />
EV/EBIT 14.6 9.2<br />
P/Sales 1.5 1.9<br />
Div. Yield 1.4% 2.8%<br />
Key Fundamentals CNX500 Extreme 25<br />
ROE 16.0% 23.2%<br />
ROCE 15.7% 27.5%<br />
Sales to Asset 0.3 0.4<br />
Gross Debt to Equity 0.6 0.0<br />
Net Debt to Equity 0.4 -0.6<br />
Interest Coverage 10.7 294.8<br />
INR<br />
USD<br />
Risk & Return Characteristics CNX500 Extreme 25 CNX500 Extreme 25<br />
Annualized Return (inception) 19.3% 32.8% 16.6% 29.8%<br />
Beta^ 1.00 0.75 1.00 0.79<br />
Alpha - 16.6% - 15.9%<br />
Std. Dev. 23.1% 20.2% 26.1% 23.1%<br />
Sharpe Ratio # 0.53 1.28 0.51 1.14<br />
Worst 1Mth Return -37.5% -34.5% -42.6% -35.8%<br />
Best 1Mth Return 37.3% 54.0% 47.2% 65.2%<br />
Technology<br />
28%<br />
Sector Exposure<br />
Utilities Basic<br />
8% Materials<br />
12%<br />
Consumer<br />
Goods<br />
20%<br />
Top 3 Holdings<br />
COAL INDIA<br />
POWER FINANCE<br />
POWER FINANCE<br />
Part of the Supreme series of strategies<br />
ArthVeda Portfolio Management Services Registration No. PM/ INP 000003567<br />
Industrials<br />
4%<br />
Financials<br />
20%<br />
Consumer<br />
Services<br />
8%<br />
* Performance numbers for less than 1 yr. not annualized. @ Strategy Inception date is 3rd Jan 2003. ^ Beta is a measure of volatility that compares how an index moves relative to benchmark. A beta of 1.0 implies the index has moved proportionally<br />
with the benchmark. A beta less than 1.0 implies less movement; greater than 1.0 implies more. $Sharpe Ratio is a measure calculated to determine reward per unit of risk, using standard deviation and excess returns in an index. A higher Sharpe Ratio<br />
indicates a higher risk-adjusted return.<br />
Returns and data represented are of model portfolios. These returns are based on historical evaluation of model portfolios. Above portfolio performances are pre any expenses. Individual returns of Clients for a particular portfolio may vary significantly<br />
from the performance of the other portfolios. No claims may be made or entertained for any variances between the performance depictions and individual portfolio performance. Neither the Portfolio Manager nor its Directors or Employees shall be in any<br />
way liable for any variations noticed in the returns of individual portfolios. Investments in equity markets are subjected to market risk and there is no guarantee that the investment objective of the strategy will be achieved. Past historical equity market<br />
returns are not a guarantee of and may not reflect future performance. Actual results may differ materially from those suggested by the forward looking statements due to risk or uncertainties associated with our expectations with respect to, but not limited<br />
to, exposure to market risks, general economic and political conditions in India as well as other countries globally. Investing in equities is inherently risky and an investor stands the risk of 100% capital loss. Should this fall outside the risk capacity of the<br />
investor, this document automatically does not cater to the investor’s investment requirements and profile. It is mandatory to go through Disclaimer section.<br />
16