World Disasters Report 2010 - International Federation of Red Cross ...
World Disasters Report 2010 - International Federation of Red Cross ...
World Disasters Report 2010 - International Federation of Red Cross ...

Create successful ePaper yourself
Turn your PDF publications into a flip-book with our unique Google optimized e-Paper software.
The <strong>International</strong> <strong>Federation</strong><br />
<strong>of</strong> <strong>Red</strong> <strong>Cross</strong> and <strong>Red</strong> Crescent Societies<br />
would like to express its gratitude to the<br />
following for committing to and<br />
supporting this publication:<br />
Swedish <strong>International</strong><br />
Development Cooperation<br />
Agency<br />
<strong>Red</strong> Crescent Society <strong>of</strong> the United Arab Emirates
A global humanitarian organization<br />
The <strong>International</strong> <strong>Federation</strong> <strong>of</strong> <strong>Red</strong> <strong>Cross</strong> and <strong>Red</strong> Crescent Societies is the world’s largest<br />
humanitarian organization, providing assistance without discrimination as to nationality, race,<br />
religious beliefs, class or political opinions. The <strong>International</strong> <strong>Federation</strong>’s mission is to improve the<br />
lives <strong>of</strong> vulnerable people by mobilizing the power <strong>of</strong> humanity.<br />
Founded in 1919, the <strong>International</strong> <strong>Federation</strong> comprises 186 member <strong>Red</strong> <strong>Cross</strong> and <strong>Red</strong> Crescent<br />
Societies – with an additional number in formation – a secretariat in Geneva and <strong>of</strong>fices strategically<br />
located to support activities around the world. The <strong>Red</strong> Crescent is used in place <strong>of</strong> the <strong>Red</strong> <strong>Cross</strong><br />
in many Islamic countries.<br />
The <strong>International</strong> <strong>Federation</strong> coordinates and directs international assistance to victims <strong>of</strong> natural<br />
and technological disasters, to refugees and in health emergencies. It combines its relief activities<br />
with development work to strengthen the capacities <strong>of</strong> National Societies and through them the<br />
capacity <strong>of</strong> individual people. The <strong>International</strong> <strong>Federation</strong> acts as the <strong>of</strong>ficial representative <strong>of</strong> its<br />
member societies in the international field. It promotes cooperation between National Societies, and<br />
works to strengthen their capacity to carry out effective disaster preparedness, health and social<br />
programmes.<br />
National <strong>Red</strong> <strong>Cross</strong> and <strong>Red</strong> Crescent Societies embody the work and principles <strong>of</strong> the<br />
<strong>International</strong> <strong>Red</strong> <strong>Cross</strong> and <strong>Red</strong> Crescent Movement. National Societies act as auxiliaries to the public<br />
authorities <strong>of</strong> their own countries in the humanitarian field and provide a range <strong>of</strong> services including<br />
disaster relief, health and social programmes. During wartime, National Societies assist the affected<br />
civilian population and support the army medical services where appropriate.<br />
The unique network <strong>of</strong> National Societies – which covers almost every country in the world – is the<br />
<strong>International</strong> <strong>Federation</strong>’s principal strength. Cooperation between National Societies gives the<br />
<strong>International</strong> <strong>Federation</strong> greater potential to develop capacities and assist those most in need. At a<br />
local level, the network enables the <strong>International</strong> <strong>Federation</strong> to reach individual communities.<br />
Together, the National Societies comprise 97 million volunteers and 300,000 employees, who<br />
provide assistance to some 233 million beneficiaries each year.<br />
The <strong>International</strong> Committee <strong>of</strong> the <strong>Red</strong> <strong>Cross</strong> (ICRC) is an impartial, neutral and independent<br />
organization whose exclusively humanitarian mission is to protect the lives and dignity <strong>of</strong> victims <strong>of</strong><br />
war and internal violence and to provide them with assistance. It directs and coordinates the<br />
international relief activities conducted by the Movement in situations <strong>of</strong> conflict. It also endeavours<br />
to prevent suffering by promoting and strengthening humanitarian law and universal humanitarian<br />
principles. Established in 1863, the ICRC is at the origin <strong>of</strong> the <strong>International</strong> <strong>Red</strong> <strong>Cross</strong> and <strong>Red</strong><br />
Crescent Movement.<br />
Together, all the components <strong>of</strong> the <strong>International</strong> <strong>Red</strong> <strong>Cross</strong> and <strong>Red</strong> Crescent Movement are guided<br />
by the same seven Fundamental Principles: humanity, impartiality, neutrality, independence,<br />
voluntary service, unity and universality. In the same manner, all <strong>Red</strong> <strong>Cross</strong> and <strong>Red</strong> Crescent<br />
activities have one central purpose: to help those who suffer without discrimination and thus<br />
contribute to peace in the world.<br />
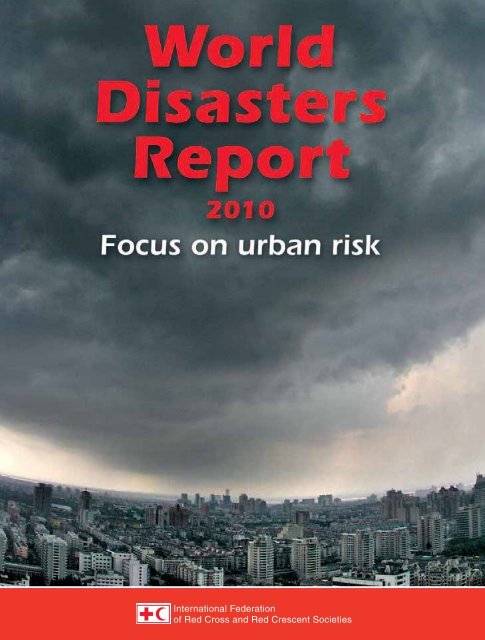
Cover photo: Storm cloud hangs over Hangzhou City before the coming <strong>of</strong> typhoon Haitang in<br />
east China's Zhejiang province. Storm cloud hangs over Hangzhou City before the coming <strong>of</strong><br />
typhoon Haitang in east China's Zhejiang province July 19, 2005. Typhoon Haitang swirled towards<br />
China's southeast coast on Tuesday after killing up to six people in Taiwan, injuring 30 and wreaking<br />
damage estimated at US$41 million. CHINA OUT REUTERS/China Newsphoto.
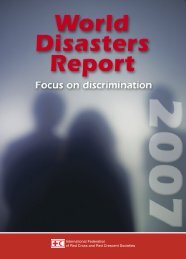
<strong>World</strong><br />
<strong>Disasters</strong><br />
<strong>Report</strong><br />
<strong>2010</strong><br />
Focus on urban risk
2<br />
All rights reserved. Except for quotation in a review <strong>of</strong> the work, no part <strong>of</strong> this publication<br />
may be reproduced, stored in a retrieval system, or transmitted, in any form or<br />
by any means, electronic, mechanical, photocopying, recording or otherwise, without<br />
the prior permission <strong>of</strong> the <strong>International</strong> <strong>Federation</strong> <strong>of</strong> <strong>Red</strong> <strong>Cross</strong> and <strong>Red</strong> Crescent<br />
Societies. This publication is copyright, but may be reproduced without fee for teaching<br />
purposes but not for resale. Formal permission is required for all such uses. For<br />
copying in any other circumstances, or for re-use in other publications, or for translation<br />
or adaptation, prior written permission must be obtained from the publisher.<br />
The opinions expressed in this publication do not necessarily represent the <strong>of</strong>ficial<br />
policy <strong>of</strong> the <strong>International</strong> <strong>Federation</strong> <strong>of</strong> <strong>Red</strong> <strong>Cross</strong> and <strong>Red</strong> Crescent Societies or <strong>of</strong><br />
individual National <strong>Red</strong> <strong>Cross</strong> or <strong>Red</strong> Crescent Societies. The designations used do<br />
not imply the expression <strong>of</strong> any opinion on the part <strong>of</strong> the <strong>International</strong> <strong>Federation</strong> or<br />
National Societies concerning the legal status <strong>of</strong> a territory or <strong>of</strong> its authorities.<br />
© <strong>International</strong> <strong>Federation</strong> <strong>of</strong> <strong>Red</strong> <strong>Cross</strong> and <strong>Red</strong> Crescent Societies, <strong>2010</strong><br />
ISBN 978-92-9139-156-1<br />
Editor: Denis McClean<br />
Main contributors: Sean Deely, David Dodman, Jorgelina Hardoy, Cassidy Johnson,<br />
David Satterthwaite, Amy Serafin and Richard Waddington<br />
Design and production team: Sébastien Calmus, Jean-Charles Chamois,<br />
Benoit Matsha-Carpentier, Sue Pfiffner and Josephine Shields Recass<br />
Editorial board: George Deikun, Arjun Katoch, Helena Molin-Valdes,<br />
Cristina Rumbaitis del Rio and Jo Wells<br />
Reviewers: Yasemin Aysan, Patricia Danzi, Angela Gussing, Kamal Kishore,<br />
Mohammed Omer Mukhier and Graham Saunders<br />
We would also like to thank David Satterthwaite who served as Chief Editor during<br />
the initial stages, and all those who assisted contributors during research for this issue<br />
Typesetting by Michel Schnegg, Geneva, Switzerland<br />
Printed by Imprimerie Chirat, Lyons, France<br />
Contact details:<br />
<strong>International</strong> <strong>Federation</strong> <strong>of</strong> <strong>Red</strong> <strong>Cross</strong> and <strong>Red</strong> Crescent Societies<br />
17, Chemin des Crêts, P.O. Box 372<br />
CH-1211 Geneva 19, Switzerland<br />
Tel.: +41 22 730 4222. Fax: +41 733 0395<br />
E-mail: secretariat@ifrc.org; wdr@ifrc.org<br />
Web: www.ifrc.org<br />
To order the <strong>World</strong> <strong>Disasters</strong> <strong>Report</strong>, please contact wdr@ifrc.org.
Contents<br />
<strong>International</strong> <strong>Federation</strong> <strong>of</strong> <strong>Red</strong> <strong>Cross</strong><br />
and <strong>Red</strong> Crescent Societies inside front cover<br />
Acknowledgements 2<br />
Introduction 7<br />
Focus on urban risk<br />
Chapter 1 Avoiding the urbanization <strong>of</strong> disasters 10<br />
Table 1.1 Growth in the world’s urban and rural population<br />
(millions <strong>of</strong> inhabitants) 12<br />
Figure 1.1 Distribution <strong>of</strong> fatalities and economic loss<br />
from tropical cyclones per year 13<br />
Box 1.1 Urban myths and misconceptions 19<br />
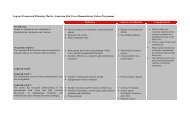
Table 1.2 What different aspects <strong>of</strong> urban poverty imply<br />
for everyday and disaster risk 21<br />
Box 1.2 Can Haiti build back better? 23<br />
Chapter 2 Urban disaster trends 30<br />
Figure 2.1 Growth in urban population globally and by region 32<br />
Figure 2.2 The change in the average population size<br />
<strong>of</strong> the world’s 100 largest cities, 1800 to 2000 33<br />
Figure 2.3 Changes in the proportion <strong>of</strong> GDP for low-<br />
and middle-income nations, 1950–2005 33<br />
Table 2.1 Large disaster events over the period 2000–<strong>2010</strong><br />
impacting on cities 35<br />
Box 2.1 Tropical Storm Ketsana and urban food insecurity 38<br />
<strong>World</strong> <strong>Disasters</strong> <strong>Report</strong> <strong>2010</strong> – Focus on urban risk<br />
3
4<br />
Figure 2.4 Hazard risk index for large cities, as defined<br />
by Munich Re Group 39<br />
Figure 2.5 Port cities with highest exposed population in 2005<br />
to one-in-100-year, surge-induced flood events 41<br />
Table 2.2 Port cities with population over 1 million estimated<br />
to have highest increased population exposure<br />
to surge-induced floods, 2005 to projected 2070 42<br />
Figure 2.6 Geographic distribution and frequency <strong>of</strong> registered<br />
flooding events between 1950 and 1990 in Cali, Colombia 43<br />
Box 2.2 Fires and fire risks in Imizamo Yethu, Hout Bay, South Africa 44<br />
Box 2.3 The vulnerability gap in Istanbul, Turkey 45<br />
Chapter 3 Starting over: Community rights<br />
and post-disaster response 52<br />
Box 3.1 The Philippines Homeless People’s <strong>Federation</strong>’s role<br />
in community-driven disaster response 56<br />
Box 3.2 Inclusive equitable cities 59<br />
Box 3.3 Housing, land and property rights and post-disaster<br />
shelter programming 64<br />
Chapter 4 Urban violence 72<br />
Box 4.1 Violence and young people in urban settings 78<br />
Table 4.1 Measuring inequality 81<br />
Box 4.2 <strong>Red</strong> <strong>Cross</strong> <strong>Red</strong> Crescent action 87<br />
Chapter 5 Urban risk to health 94<br />
Box 5.1 Hunger is back with a vengeance 98<br />
Box 5.2 Hi-tech rescue in a mega-city 106<br />
Box 5.3 Safety on the urban road 108
Chapter 6 Urbanization and climate change risk 114<br />
Box 6.1 Key organizations and concepts in climate change 116<br />
Table 6.1 Climate change impacts on urban areas 117<br />
Box 6.2 Cooperating on flood risk in Saint-Louis, Senegal 120<br />
Table 6.2 Gender and climate vulnerability 122<br />
Box 6.3 Urban flooding in Ireland 124<br />
Box 6.4 After the storm 126<br />
Table 6.3 Examples <strong>of</strong> climate change and disaster preparedness<br />
goals and actions 129<br />
Box 6.5 Building resilience as a strategy for climate change<br />
adaptation and disaster risk reduction 131<br />
Chapter 7 Urban governance and disaster<br />
risk reduction 138<br />
Box 7.1 Disaster preparedness and climate change adaptation<br />
in Durban, South Africa 141<br />
Box 7.2 Latin American cities expand over high-risk areas 143<br />
Box 7.3 Good governance and disaster risk reduction in Aceh 148<br />
Annexes<br />
Annex 1 Disaster data 160<br />
Table 1 Total number <strong>of</strong> reported disasters, by continent,<br />
by year and by level <strong>of</strong> human development (2000 to 2009) 166<br />
Table 2 Total number <strong>of</strong> people reported killed, by continent,<br />
by year and by level <strong>of</strong> human development (2000 to 2009) 167<br />
<strong>World</strong> <strong>Disasters</strong> <strong>Report</strong> <strong>2010</strong> – Focus on urban risk<br />
5
6<br />
Table 3 Total number <strong>of</strong> people reported affected, by continent,<br />
by year and by level <strong>of</strong> human development (2000 to 2009),<br />
in thousands 168<br />
Table 4 Total number <strong>of</strong> disaster estimated damage, by continent,<br />
by year and by level <strong>of</strong> human development (2000 to 2009)<br />
– in millions <strong>of</strong> US dollars (2009 prices) 169<br />
Table 5 Total number <strong>of</strong> reported disasters, by type <strong>of</strong> phenomenon<br />
and by year (2000 to 2009) 170<br />
Table 6 Total number <strong>of</strong> people reported killed, by type<br />
<strong>of</strong> phenomenon and by year (2000 to 2009) 171<br />
Table 7 Total number <strong>of</strong> people reported affected, by type<br />
<strong>of</strong> phenomenon and by year (2000 to 2009), in thousands 172<br />
Table 8 Total amount <strong>of</strong> disaster damage, by type <strong>of</strong> phenomenon<br />
and by year (2000 to 2009) – in millions <strong>of</strong> US dollars<br />
(2009 prices) 173<br />
Table 9 Total number <strong>of</strong> reported disasters, by type<br />
<strong>of</strong> phenomenon, by continent and by level <strong>of</strong> human<br />
development (2000 to 2009) 174<br />
Table 10 Total number <strong>of</strong> people reported killed, by type<br />
<strong>of</strong> phenomenon, by continent and by level <strong>of</strong> human<br />
development (2000 to 2009) 176<br />
Table 11 Total number <strong>of</strong> people reported affected, by type<br />
<strong>of</strong> phenomenon, by continent and by level <strong>of</strong> human<br />
development (2000 to 2009), in thousands 178<br />
Table 12 Total amount <strong>of</strong> estimated disaster damage, by type<br />
<strong>of</strong> phenomenon, by continent and by level <strong>of</strong> human<br />
development (2000 to 2009) – in millions <strong>of</strong> US dollars<br />
(2009 prices) 180<br />
Table 13 Total number <strong>of</strong> people reported killed and affected<br />
by disasters by country and territory (1990 to 1999;<br />
2000 to 2009; and 2009) 182
Annex 2 Making cities resilient: A ten-point<br />
checklist for local governments 190<br />
Index 200<br />
Fundamental Principles inside back cover<br />
<strong>World</strong> <strong>Disasters</strong> <strong>Report</strong> <strong>2010</strong> – Focus on urban risk<br />
7
8<br />
The urban risk divide:<br />
A 21st century challenge<br />
The signs <strong>of</strong> our vulnerability to urban risk are everywhere.<br />
An earthquake can bring hospitals, schools and homes tumbling down with unspeakably<br />
tragic consequences. A volcano can throw city airports into chaos. Flood waters<br />
can turn well-kept streets into detritus-strewn canals. The drug trade can turn an inner<br />
city into a war zone. An epidemic can spread rapidly through a crowded slum.<br />
As the pendulum <strong>of</strong> human development swings increasingly away from the countryside<br />
to the city, we see that rapid urbanization and population growth are combining<br />
to create enormous new challenges for the humanitarian community and pushing us<br />
out <strong>of</strong> our comfort zone to deal with a strange new urban world.<br />
When it comes to the impact <strong>of</strong> natural disasters, well-run cities can be among the<br />
safest places on earth. They can also be the best places to raise a family, for schooling,<br />
healthcare and employment. You can expect to live longer in a city.<br />
Cities can also be the most dangerous places on earth for those who live in an urban<br />
environment where the authorities have little presence and where the will and the<br />
resources are lacking to ensure basic social services, food security, policing, running<br />
water, sewerage and respect for building codes.<br />
This urban risk divide is a major challenge for humankind in the 21st century if we are<br />
to ensure that the worldwide movement from the countryside to cities does not fuel a<br />
growth in sickness and deaths from the re-creation <strong>of</strong> 19th century-like public health<br />
hazards exacerbated by exposure to risks generated by climate change and the threat<br />
<strong>of</strong> pandemics.<br />
The stresses and strains <strong>of</strong> urban living can be compounded immeasurably for those<br />
who end up living on the peripheries <strong>of</strong> cities in low- and middle-income countries,<br />
barely surviving on one US dollar or less a day.<br />
Despite the heartbeat <strong>of</strong> commerce and other signs <strong>of</strong> vibrant life which pulsate<br />
through many informal urban settlements, slum life can be nasty, brutal and short for<br />
many inhabitants as they lose out in a Darwinian struggle for survival against disease,<br />
malnutrition, illiteracy, crime and natural disasters.<br />
It is this urban ‘underclass’ that should concern the humanitarian community most.<br />
Their numbers are almost 1 billion and they are growing at the rate <strong>of</strong> 10 million
annually despite commendable efforts to reach the Millennium Development Goal on<br />
shelter in some parts <strong>of</strong> the world.<br />
Before the tide <strong>of</strong> urbanization leaves us behind, the humanitarian community needs<br />
to bring about a sea-change in how we respond to these vulnerable people, and how we<br />
engage with governments who are struggling to understand what is happening in their<br />
cities and finding it difficult to resource an adequate response.<br />
This year’s <strong>World</strong> <strong>Disasters</strong> <strong>Report</strong> does not have all the answers but it does have sound<br />
advice on how the urban risk divide between the developing world and the developed<br />
world can be reduced. It also highlights how, in a globalized world, a deficiency on one<br />
side <strong>of</strong> the world can create problems for us all.<br />
Urbanization can be a strong bulwark against the worst that climate change is throwing<br />
at us. Where there is good urban governance, you find economies <strong>of</strong> scale in terms<br />
<strong>of</strong> risk reduction and response capacities. Where there is good urban governance, you<br />
will also find citizens who are empowered and active in their communities because<br />
they have security <strong>of</strong> tenure and their housing, land and property rights are respected.<br />
The challenge for humanitarian actors is to find new and concrete ways <strong>of</strong> engaging<br />
with local authorities and vulnerable communities to ensure that risk reduction<br />
is all encompassing and not simply focused on the obvious and on the post-disaster<br />
clean-up.<br />
It is clear from many examples in this report that urban communities are capable <strong>of</strong><br />
finding their own solutions, asserting their rights and playing a full role in post-disaster<br />
recovery and risk reduction but that many need external support which is appropriate<br />
to their circumstances.<br />
One man’s flood drain is another man’s home. This paradox – the elimination <strong>of</strong> one<br />
risk to replace it with another – must encourage us to engage intelligently with communities<br />
struggling to survive along the fault lines <strong>of</strong> urban risk. In the long term, if we<br />
are looking after the vulnerable in our cities, we are looking after ourselves.<br />
Bekele Geleta<br />
Secretary General<br />
<strong>World</strong> <strong>Disasters</strong> <strong>Report</strong> <strong>2010</strong> – Introduction<br />
9
CHAPTER 1<br />
10
Avoiding the urbanization<br />
<strong>of</strong> disasters<br />
The early part <strong>of</strong> <strong>2010</strong> saw two <strong>of</strong> the worst earthquakes <strong>of</strong> recent times strike separate<br />
parts <strong>of</strong> the Americas. An 8.8 magnitude earthquake hit Chile, a country which had<br />
just joined the OECD (Organisation <strong>of</strong> Economic Co-operation and Development)<br />
club <strong>of</strong> wealthier nations, and caused widespread damage to property but the death<br />
toll was counted in hundreds. It followed an earthquake <strong>of</strong> slightly lesser magnitude in<br />
January which struck Port-au-Prince, the capital <strong>of</strong> the region’s poorest country, Haiti,<br />
and resulted in more than 200,000 deaths according to best estimates and left more<br />
than 1 million people homeless. While the concentration <strong>of</strong> people in urban centres<br />
can greatly reduce or increase disaster impacts, the disparity in the impact <strong>of</strong> these two<br />
earthquakes is in part explained by the differences in disaster preparedness and the<br />
quality <strong>of</strong> housing, infrastructure and services.<br />
Far more attention needs to be given to urban risk in a world which is urbanizing<br />
rapidly and where, for the first time, over half the world’s population lives in cities and<br />
towns. More than 1 billion people today live in appalling conditions in urban areas<br />
and their numbers are growing. And it is mostly this population – whose basic needs<br />
are not always provided for – that is at most risk from cyclones, floods, earthquakes,<br />
infectious diseases, crime, fires, and transport and industrial accidents. This underlines<br />
the need for a radical rethink in how the international community addresses urban<br />
risk. Few governments or non-governmental organizations (NGOs) work successfully<br />
with low-income groups to improve their living conditions and there is evidence to<br />
suggest that poverty thresholds are unrealistically low when estimating the full extent<br />
<strong>of</strong> deprivation in urban settings.<br />
A disaster-prone urban future can be avoided. Trend is not destiny. But as the world’s<br />
population becomes increasingly concentrated in large cities, we are seeing an urbanization<br />
<strong>of</strong> disasters and disaster risk. This presents rapidly evolving challenges for international<br />
agencies, NGOs, and central and local governments in how they approach<br />
disaster response in an urban setting, particularly in low-income countries where<br />
endemic poverty underpins vulnerability to disaster events. Nonetheless, there are<br />
cities in Africa, Asia and Latin America where disaster risks have been dramatically<br />
reduced as the proportion <strong>of</strong> the population living in homes and neighbourhoods with<br />
basic infrastructure and services has increased rather than decreased, and where local<br />
governments have learned to map disaster risk and to act on it in partnership with local<br />
communities. Instances <strong>of</strong> good practice show that it usually comes down to the quality<br />
and effectiveness <strong>of</strong> urban government and it is just as <strong>of</strong>ten achieved without the<br />
support <strong>of</strong> large institutional donors who have no real dialogue with poor communities<br />
living in informal settlements (<strong>of</strong>ten called ‘slums’ or ‘shanty towns’).<br />
<strong>World</strong> <strong>Disasters</strong> <strong>Report</strong> <strong>2010</strong> – Focus on urban risk<br />
Photo opposite page:<br />
The February <strong>2010</strong><br />
earthquake in Chile,<br />
which also triggered<br />
a tsunami, caused<br />
much devastation<br />
to infrastructure, but<br />
with an estimated<br />
490 deaths, fatalities<br />
were far fewer than in<br />
the January quake in<br />
Haiti.<br />
© Carola Solis/<br />
Chilean <strong>Red</strong> <strong>Cross</strong><br />
11
12<br />
The United Nations (UN) Population Division’s projections suggest that almost all<br />
the world’s population growth in the next few decades will be in urban areas in low-<br />
and middle-income nations (see Table 1.1). Much <strong>of</strong> this population growth is currently<br />
in informal settlements where housing conditions are generally very poor and<br />
even the most rudimentary protective infrastructure is <strong>of</strong>ten lacking. A high proportion<br />
<strong>of</strong> this urban growth is in cities at risk from the increased frequency and intensity<br />
<strong>of</strong> extreme weather events and storm surges that climate change is bringing or is likely<br />
to bring.<br />
Table 1.1 Growth in the world’s urban and rural population<br />
(millions <strong>of</strong> inhabitants)<br />
1950 1970 1990 Projected for <strong>2010</strong>* Projected for 2030*<br />
<strong>World</strong>’s urban population 737 1,332 2,275 3,495 4,965<br />
High-income nations 427 652 818 925 1,016<br />
Low- and middle-income nations 310 680 1,456 2,570 3,949<br />
Africa 33 86 204 412 759<br />
Asia 237 485 1,015 1,770 2,669<br />
Europe 281 412 509 530 550<br />
Latin America and the Caribbean 69 164 314 471 603<br />
Northern America 110 171 214 286 351<br />
Oceania 8 14 19 25 31<br />
<strong>World</strong>’s rural population 1,798 2,367 3,020 3,412 3,426<br />
Source: United Nations (2008)<br />
* The figures for <strong>2010</strong> are projected because no data are available yet from the new round <strong>of</strong> censuses held in 2009<br />
and <strong>2010</strong> or planned for 2011. The projections for 2030 may overstate urban population growth in Africa; poor economic<br />
performance and / or conflict have slowed urbanization there and this will have to change if the region is to urbanize rapidly.<br />
But a city can be among the safest places when a storm, flood or earthquake hits.<br />
This can be seen in the many extreme weather events or earthquakes in high-income<br />
nations (all <strong>of</strong> which are highly urbanized) that have no, or very few, fatalities. Most<br />
extreme weather events in high-income nations cause no fatalities. For those that do,<br />
high-quality buildings and infrastructure usually keep down deaths and injuries, and<br />
rapid, good-quality emergency responses limit the impact <strong>of</strong> injuries. Of course, we<br />
cannot measure what has been avoided – the floods that did not happen as the drainage<br />
system coped; the fire disasters and building collapses prevented by good-quality<br />
buildings and emergency response; the industrial, mining and transport disasters<br />
avoided by the application <strong>of</strong> sensible standards and safety measures. But without the<br />
investment in physical capital and institutions, the situation would have been much<br />
worse (although many <strong>of</strong> the measures that avoid disasters were taken in response to<br />
previous disasters).<br />
Part <strong>of</strong> what can be avoided can be seen in the distribution <strong>of</strong> fatalities from disasters.<br />
Figure 1.1 shows the extent to which deaths from cyclones are concentrated
in low-income nations even though a high proportion <strong>of</strong> the population exposed to<br />
cyclones lives in high-income nations. In viewing the dramatic differences in fatalities<br />
between the different categories <strong>of</strong> nations, it should be remembered that low-income<br />
nations are the countries that are the least urbanized while almost all upper-middle and<br />
all high-income nations are predominantly urban.<br />
Japan has more people exposed to tropical cyclones than the Philippines. However,<br />
if both countries were affected by a cyclone <strong>of</strong> the same magnitude, past experience<br />
suggests that mortality in the Philippines would be 17 times higher than in Japan.<br />
This does not mean that cities in high-income nations are always safer, as was shown<br />
by the deaths and devastation in New Orleans after Hurricane Katrina, but relative<br />
to the intensity <strong>of</strong> the disaster, fatalities are much less common. <strong>Disasters</strong> from fires<br />
and from transport and industrial accidents are much less common in cities in highincome<br />
nations than in low- and middle-income nations (although this certainly was<br />
not the case historically as many <strong>of</strong> today’s wealthiest cities experienced disastrous fires<br />
or industrial accidents in the past).<br />
Figure 1.1<br />
Distribution <strong>of</strong> fatalities and economic loss from tropical cyclones per year<br />
%<br />
100<br />
90<br />
80<br />
70<br />
60<br />
50<br />
40<br />
30<br />
20<br />
10<br />
0<br />
81.3<br />
3.1<br />
Low-income<br />
nations<br />
16.4 16.8<br />
Lower-middle<br />
income nations<br />
5.9<br />
0.9<br />
Upper-middle<br />
income nations<br />
1.3<br />
74.1<br />
High-income<br />
nations<br />
Source: Based on figures from UNISDR (2009)<br />
In high-income countries, Japan has the largest number <strong>of</strong> people exposed,<br />
followed by the Republic <strong>of</strong> Korea and the United States.<br />
People killed<br />
Economic loss<br />
When an earthquake hits a city, it can be a very dangerous place to be – as was seen<br />
in Port-au-Prince in January, in Bam, Iran in 2003 or in Turkey’s Marmara region in<br />
1999. But this need not be so. For instance, in July 2007, a large earthquake struck the<br />
<strong>World</strong> <strong>Disasters</strong> <strong>Report</strong> <strong>2010</strong> – Focus on urban risk<br />
13
CHAPTER 1<br />
14<br />
north-western part <strong>of</strong> the Niigata region in Japan. Although it was the most costly disaster<br />
in the world for that year, only 11 deaths and 100 injuries were reported. Again,<br />
this is not always the case as, even in Japan, the complex web <strong>of</strong> causal relations means<br />
that the general rule does not always apply, as shown by the 1995 Kobe earthquake<br />
which claimed 6,400 lives and injured 15,000 people.<br />
With more than half the world’s population now living in urban areas, this edition<br />
<strong>of</strong> the <strong>World</strong> <strong>Disasters</strong> <strong>Report</strong> looks at where cities and smaller urban areas are centres<br />
<strong>of</strong> risk for disasters and where they are not. It will also consider why this is so – and<br />
the extent to which disaster risk can be reduced or removed in urban areas and what<br />
measures contribute to this. This will be discussed within the context <strong>of</strong> a world that<br />
is urbanizing rapidly.<br />
Why focus on urban areas?<br />
This report’s focus on urban areas does not mean that urban and rural disasters should<br />
be considered separately. Most disasters impact rural and urban areas. There are too<br />
many links between both areas which are relevant to disasters – for instance, disasters<br />
in rural areas bring disruptions to urban centres to which they supply food, fuel, water<br />
or other goods, while disasters in urban areas disrupt the suppliers <strong>of</strong> goods and services<br />
that farmers and rural populations use.<br />
But urban areas need separate consideration because their very character – the concentration<br />
<strong>of</strong> population, homes and other buildings, transport infrastructure and<br />
industry – presents both problems and opportunities for disaster risk reduction and<br />
humanitarian assistance. In low-income and most middle-income nations, there is also<br />
more ‘government’ in urban than in rural areas, as urban populations and enterprises<br />
are subject to more rules and regulations, and state institutions are more likely to be<br />
present. Of course, such government activities should reduce disaster risk but in reality,<br />
as will be discussed later, they may <strong>of</strong>ten exacerbate it. There are also more market pressures<br />
in urban areas, especially in large or successful cities where low-income groups<br />
struggle to find accommodation and health services they can afford and are at risk<br />
from price rises or falling incomes. Thus, there is a need for finance if households are<br />
to protect themselves.<br />
Urban populations also need some consideration simply for their scale:<br />
�� By <strong>2010</strong>, there were 2.5 billion urban dwellers in low- and middle-income<br />
nations; this is roughly the same as the world’s total population in 1950<br />
�� Africa is usually considered to be predominantly rural but its urban population is<br />
now much larger than that <strong>of</strong> North America<br />
�<br />
� Most <strong>of</strong> the world’s largest cities are in low- and middle-income nations; this<br />
is unprecedented historically as most large cities have been in the wealthiest<br />
nations.
The last few decades have also brought a very large increase in the number <strong>of</strong> urban<br />
dwellers living in poverty, mostly in low- and middle-income nations. This is most<br />
evident in the poor-quality and overcrowded housing and the lack <strong>of</strong> provision for<br />
the basic infrastructure and services which should protect them from environmental<br />
health hazards and help prevent disasters. Although precise numbers are lacking,<br />
an overall view <strong>of</strong> UN estimates suggests that around 1 billion urban dwellers live<br />
in poor-quality, overcrowded housing in slums or informal settlements with this rising<br />
to 1.4 billion by 2020 unless governments and international agencies become far<br />
more successful in supporting housing improvements for low-income groups. The<br />
UN Human Settlements Programme (UN-Habitat) recently published revised figures<br />
stating that the “absolute number” <strong>of</strong> slum dwellers in the developing world has actually<br />
increased from 776.7 million in 2000 to some 827.6 million in <strong>2010</strong>. This assessment<br />
is accompanied by a claim that during the same decade, a total <strong>of</strong> 227 million<br />
people have moved out <strong>of</strong> slum conditions, which means that the Millennium Development<br />
Goal target has been surpassed 2.2 times. However, an inquiry by the <strong>World</strong><br />
<strong>Disasters</strong> <strong>Report</strong> elicited the response that this number is partly based on a redefinition<br />
<strong>of</strong> international sanitation standards which retrospectively excluded families that have<br />
access to a slab-pit latrine which in itself may have very little impact on their health<br />
and well-being.<br />
Other UN estimates show a massive deficit in provision for water and sanitation. Estimates<br />
for 2000 suggested at least 680 million urban dwellers lacked adequate provision<br />
for water supplies and at least 850 million lacked provision for toilets or latrines to a<br />
quality that reduced health risks. Since 2000, the urban population in low- and middle-income<br />
nations has increased by more than 500 million. As few governments have<br />
worked successfully with their low-income urban population to improve conditions,<br />
this also means there are now hundreds <strong>of</strong> millions more urban dwellers living in poverty<br />
and lacking adequate provision for water and sanitation. Other estimates suggest a<br />
lower proportion <strong>of</strong> the urban population in low- and middle-income nations are poor,<br />
but these take little or no account <strong>of</strong> housing conditions and <strong>of</strong>ten do not factor into<br />
the poverty lines the full costs <strong>of</strong> non-food needs in many cities. Set a poverty line unrealistically<br />
low and it can suggest there is almost no poverty in cities where a high proportion<br />
<strong>of</strong> the population lives in very poor-quality housing in informal settlements.<br />
Urban poverty and disaster risk are <strong>of</strong>ten closely intertwined. Accidents or outbreaks <strong>of</strong><br />
disease that kill or seriously injure people and / or damage or destroy property are classified<br />
as disasters if they exceed certain thresholds for the number killed (typically ten or<br />
more) or seriously injured (typically 100 or more). In all urban areas, there are many<br />
accidents that kill or seriously injure fewer people than this, such as most road traffic<br />
accidents and accidental fires. Urban poverty can dramatically increase premature<br />
deaths and serious injuries due to dangerous, overcrowded housing lacking infrastructure<br />
and services. For instance, the lack <strong>of</strong> access roads may stop fire engines from getting<br />
to the site <strong>of</strong> an accidental fire, which has spread owing to housing clustered close<br />
<strong>World</strong> <strong>Disasters</strong> <strong>Report</strong> <strong>2010</strong> – Focus on urban risk<br />
15
CHAPTER 1together<br />
16<br />
and made <strong>of</strong> flammable materials. Or the absence <strong>of</strong> drainage infrastructure<br />
may turn heavy rainfall into a disastrous flood.<br />
The links between urban poverty and disaster risk are likely to be increased by climate<br />
change. Tens <strong>of</strong> millions <strong>of</strong> urban dwellers face, or will soon face, life-threatening risks<br />
from the increased intensity <strong>of</strong> storms, flooding and heatwaves that climate change is<br />
bringing, with associated threats to their livelihoods, their asset bases (including housing),<br />
environmental quality and future prosperity. Here, it is largely those people and<br />
nations that have contributed least to global warming which face the greatest risks.<br />
Climate change is driven by greenhouse gas emissions which have brought benefits to<br />
affluent individuals and societies yet most <strong>of</strong> the burdens fall on low-income (rural and<br />
urban) individuals and societies. Without global agreements that succeed in reducing<br />
greenhouse gas emissions dramatically in the next few decades, the number and scale<br />
<strong>of</strong> extreme weather events, coastal flooding and serious constraints on agriculture and<br />
water supplies will increase and much <strong>of</strong> this will be in urban and rural areas that lack<br />
the capacity to adapt. However, good practice in urban development and government<br />
can also contribute much to disaster risk reduction and climate change adaptation. But<br />
to focus only on the current and likely impact <strong>of</strong> climate change is to miss a very large<br />
preventable disaster burden that has long been present in urban areas and that remains<br />
independent <strong>of</strong> climate change.<br />
Urbanization and disaster risk<br />
Being vulnerable should not <strong>of</strong> itself generate disaster risk. So why is it that, in most<br />
nations and urban centres, deaths, injuries and loss <strong>of</strong> homes from disasters are greater<br />
among vulnerable groups? If risks are removed – for instance, the installation <strong>of</strong> decent<br />
drains that cope with heavy rainfall – vulnerability to those risks is no longer a problem.<br />
Vulnerability is not the same as lack <strong>of</strong> income but lack <strong>of</strong> income may also mean lack<br />
<strong>of</strong> access to safe housing with good provision for water and sanitation, healthcare, education<br />
and capacity to recover. And this, <strong>of</strong> course, is what increases risks for vulnerable<br />
groups. In cities where a high proportion <strong>of</strong> the population lives in poverty, under-5<br />
mortality rates can be 15 to 20 times what they should be. Again, it has to be stressed that<br />
vulnerable groups are not at risk if the hazards to which they are vulnerable are removed.<br />
Women are <strong>of</strong>ten the mainstays <strong>of</strong> community organization and collective action reducing<br />
disaster risk, and the young can be resilient to disasters with proper support.<br />
In high-income nations, the concentration <strong>of</strong> people, buildings, motor vehicles and<br />
industries (and their wastes) in cities is not generally associated with higher disaster<br />
risks because this same concentration also means many economies <strong>of</strong> scale and proximity<br />
for the comprehensive web <strong>of</strong> infrastructure and services that reduce disaster risks<br />
and disaster impacts. Urban populations in these nations take it for granted that they<br />
will be protected from disasters, including extreme weather, floods, fires and technological<br />
accidents.
But only a very small proportion <strong>of</strong> urban centres in low- and middle-income nations<br />
have a comparable web <strong>of</strong> institutions, infrastructure, services and regulations, although<br />
there are very large variations between urban areas in these nations as regards the extent<br />
<strong>of</strong> both provision and coverage. For instance, the proportion <strong>of</strong> urban populations living<br />
in legal homes that were constructed in accordance with appropriate building regulations<br />
varies from 10–20 per cent to close to 100 per cent. The proportion <strong>of</strong> the population<br />
living in homes adequately served by sanitation, waste-water removal and storm<br />
drains also varies enormously – most urban centres in Africa and Asia have no sewers and<br />
for many <strong>of</strong> those that do, these serve only a very small proportion <strong>of</strong> the population. No<br />
family in urban areas in high-income nations, however poor, expects to have to walk several<br />
hundred metres to collect water from a communal standpipe shared with hundreds<br />
<strong>of</strong> others, to have no toilet in their home or to have no service to collect household waste.<br />
It is common that between one-third and one-half <strong>of</strong> the population <strong>of</strong> cities in low-<br />
and middle-income nations lives in informal settlements. And this is not just the case<br />
in cities with little economic success – around half the population <strong>of</strong> Mumbai and<br />
Nairobi, both <strong>of</strong> which are successful economically, lives in informal settlements. It is<br />
also common in such cities for the local authorities and utilities to refuse to extend to<br />
informal settlements (or to be prevented from doing so by law or regulation) all the<br />
infrastructure and services that do so much to reduce disaster risk. There are no statistics<br />
on the proportion <strong>of</strong> the urban population covered by good-quality fire services or<br />
rapid response to serious injuries or illnesses (including ambulances and hospitals able<br />
to provide rapid treatment), but the inadequacy or complete absence <strong>of</strong> such services<br />
is evident in many informal settlements. Only 1 per cent <strong>of</strong> households and businesses<br />
in low-income countries and 3 per cent in middle-income countries have catastrophe<br />
insurance, compared to 30 per cent in high-income nations.<br />
Urban myths<br />
The discussion <strong>of</strong> urbanization is still full <strong>of</strong> myths (see Box 1.1). It is <strong>of</strong>ten seen as ‘the<br />
problem’ (nations being ‘too urbanized’, cities growing ‘too fast’, ‘too many migrants’<br />
flooding the city) when it is associated with economic success. All high-income nations<br />
are predominantly urbanized and most <strong>of</strong> their rural population are ‘urbanized’ in that<br />
they no longer work in agriculture and a high proportion <strong>of</strong> them commute to urban<br />
areas. All low- and middle-income nations that have had the greatest economic success<br />
have urbanized; most <strong>of</strong> those that have not had economic success are among the<br />
world’s least urbanized nations. There are worries about ‘mega-cities’ with more than<br />
10 million inhabitants but there are relatively few <strong>of</strong> them (17 in 2000, the last year<br />
for which census data were available for most cities) and they are concentrated in the<br />
world’s largest economies. There is an economic logic to where urbanization and large<br />
city development is taking place – and also good evidence to show that in successful<br />
economies that are urbanizing and where the competence <strong>of</strong> city governments is<br />
strengthened, urban development decentralizes to community and urban district levels.<br />
<strong>World</strong> <strong>Disasters</strong> <strong>Report</strong> <strong>2010</strong> – Focus on urban risk<br />
17
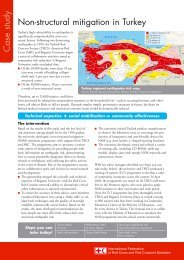
A young boy leans<br />
over a balcony<br />
overlooking an<br />
informal settlement<br />
in Cape Town,<br />
South Africa.<br />
© IFRC<br />
18<br />
The crisis <strong>of</strong> urban poverty, rapidly growing informal settlements and growing numbers<br />
<strong>of</strong> urban disasters arises from the failure <strong>of</strong> governments to adapt their institutions<br />
to urbanization. It stems also in part from the failure <strong>of</strong> aid agencies to help<br />
them to do so – most aid agencies have inadequate or no urban policies and have<br />
long been reluctant to support urban development at a sufficient scale. Governments<br />
fail to stop urban disasters when they fail to help local government structures in cities<br />
and metropolitan areas to provide the web <strong>of</strong> institutions, infrastructure and services<br />
noted above. In so many cities, disaster risk is produced over time by the failure <strong>of</strong> city<br />
governments to ensure that neighbourhoods are not built with bad-quality housing<br />
and on dangerous sites without adequate infrastructure. Often this failure is linked to<br />
their weak financial status, lack <strong>of</strong> trained staff and lack <strong>of</strong> capacity due to the refusal<br />
<strong>of</strong> central and provincial governments to provide them with resources commensurate<br />
with their responsibilities. Perhaps the most important issue that runs through all the<br />
chapters in this report is that city and municipal governments should be working with<br />
their low-income populations and other vulnerable groups to take disaster risk out <strong>of</strong><br />
urban development and expansion. We have enough examples to illustrate that this is<br />
possible, despite the constraints that city governments face.<br />
If national and international databases on disasters become more precise and comprehensive<br />
as to the impact on individual cities, it is certain that the observed trends would
einforce the view that disaster risk increases in badly governed cities and decreases in<br />
well-governed cities. It would show that cities with rapid population growth and ensuing<br />
economic growth introduce measures to reduce disaster risk, while cities with slow<br />
population growth or even population decline still have high disaster risk as they have<br />
fewer resources to invest in reducing disaster risk.<br />
Observed trends would also show that many city governments increase disaster risk as<br />
they ignore the population living in informal settlements or as they bulldoze these settlements,<br />
destroying the homes, assets and livelihoods <strong>of</strong> tens <strong>of</strong> thousands <strong>of</strong> people<br />
but providing no alternatives – either to those who are displaced or to low-income<br />
groups in general. Low-income groups do not want to live in poor-quality housing in<br />
dangerous, crime-ridden settlements lacking infrastructure, law and order and other<br />
services. They do so because only in such areas can they find affordable accommodation<br />
within reach <strong>of</strong> income-earning opportunities.<br />
Box 1.1 Urban myths and misconceptions<br />
1. “Cities are parasitic, growing everywhere<br />
without the economy to support them.” In<br />
general, the more urbanized a nation, the<br />
stronger and more productive its economy.<br />
The nations with the greatest economic success<br />
over the last few decades are generally<br />
those that have urbanized most rapidly;<br />
most <strong>of</strong> those with the smallest increase in<br />
their level <strong>of</strong> urbanization are those with the<br />
least economic success.<br />
2. “Africa is the most rapidly urbanizing region<br />
and it is urbanizing without economic<br />
growth.” Asia is the most rapidly urbanizing<br />
region, driven by urbanization in its<br />
most successful economies. Africa’s rate<br />
<strong>of</strong> urbanization has slowed because many<br />
African nations have had little or no economic<br />
growth in recent years and are urbanizing<br />
slowly or may even have stopped<br />
urbanizing.<br />
3. “Mega-cities are growing rapidly and will<br />
dominate the urban future.” There are relatively<br />
few mega-cities (17 in 2000, the<br />
most recent year for which census data are<br />
available), they concentrate less than 5 per<br />
cent <strong>of</strong> the world’s population and many<br />
have more people moving out than in, as<br />
smaller cities within their nation attract more<br />
new investment.<br />
4. “More than half the world’s population lives<br />
in cities.” More than half the world’s population<br />
lives in urban centres, not cities, and a<br />
large part <strong>of</strong> this is in small market towns or<br />
other urban centres too small to be considered<br />
a city.<br />
5. “The speed <strong>of</strong> urban change in poorer nations<br />
is unprecedented with new cities mushrooming<br />
everywhere.” Many high-income<br />
nations had periods with faster increases in<br />
their levels <strong>of</strong> urbanization than those taking<br />
place in recent decades in most low- and<br />
middle-income nations. There are relatively<br />
few new large cities; most large cities in<br />
Asia, North Africa and Latin America (and<br />
Europe) have been important cities for centuries.<br />
Several <strong>of</strong> the world’s fastest-growing<br />
large cities over the last 100 years are in<br />
the United States.<br />
<strong>World</strong> <strong>Disasters</strong> <strong>Report</strong> <strong>2010</strong> – Focus on urban risk<br />
19
6. “Urban development is opposed to rural<br />
development.” Much <strong>of</strong> the demand that<br />
produces rural incomes comes from urban<br />
populations and urban enterprises. Many<br />
higher-paying jobs in rural areas (including<br />
<strong>of</strong>f-farm work) come from urban demand.<br />
Successful farmers depend on urban-based<br />
facilities and services – markets, banks,<br />
processing plants, cold-storage facilities,<br />
supply and repair <strong>of</strong> machinery and agricultural<br />
inputs. Rural populations <strong>of</strong>ten<br />
depend on their local urban centre for access<br />
to hospitals, secondary schools, post<br />
<strong>of</strong>fices and most consumer goods and services.<br />
Many low-income rural households<br />
20<br />
have their incomes boosted by remittances<br />
from a family member working in urban<br />
areas.<br />
7. “Large and rapidly growing cities have the<br />
worst environmental problems.” Large cities<br />
<strong>of</strong>ten have better standards <strong>of</strong> environmental<br />
health than most other urban centres in<br />
their nation (and most rural areas). Wellgoverned<br />
cities have the world’s best quality<br />
<strong>of</strong> life (and highest life expectancies).<br />
It is not the size and speed at which a<br />
city grows that determines environmental<br />
problems but the quality <strong>of</strong> its government<br />
and its relations with its low-income population.<br />
�<br />
Disaster impacts in rural and urban areas<br />
<strong>Disasters</strong> have long had their largest impacts in rural areas in terms <strong>of</strong> deaths, serious<br />
injuries and impoverishment. In part, this was simply because most people lived and<br />
worked in rural areas but this is no longer the case. It was also partly because most <strong>of</strong><br />
those with the least resilience to disasters lived in rural areas. This is changing with<br />
the growth in what can be termed the ‘vulnerability gap’ in urban areas and as it does,<br />
it brings with it a need to consider why more disaster risk is in urban areas and what<br />
this implies for both development and disaster risk reduction. The vulnerability gap is<br />
produced by two factors: the lack <strong>of</strong> knowledge and financial capacity (and sometimes<br />
willingness) <strong>of</strong> urban authorities to reduce risks and vulnerabilities; and a high proportion<br />
<strong>of</strong> urban households and communities limited in their capacity to reduce risk<br />
by inadequate incomes, limited political influence, high land prices (<strong>of</strong>ten driven up<br />
by speculation) and corrupt practices in land-use management that combine to force<br />
people to live in high-risk areas.<br />
The priorities for disaster risk reduction depend on how disaster risk is viewed. If<br />
disaster risk is viewed in terms <strong>of</strong> economic impacts, the list <strong>of</strong> ‘vulnerable cities’ is<br />
dominated by wealthy cities in high-income nations. So in the index <strong>of</strong> risk to multihazards<br />
in large cities developed by Munich Re, 17 <strong>of</strong> the 20 cities at highest risk are<br />
in high-income countries. This makes sense if gauging the risk for insurers and thus<br />
the value <strong>of</strong> exposed assets but it makes very limited sense in terms <strong>of</strong> identifying cities<br />
where populations are particularly at risk from disasters.<br />
Cities in low-income nations do face very high levels <strong>of</strong> risk – not because <strong>of</strong> the<br />
monetary value <strong>of</strong> exposed assets, but due to the inadequacies in their infrastructure,<br />
the poor quality <strong>of</strong> the housing for much <strong>of</strong> the population and the weakness <strong>of</strong> city
institutions. Poor people have a lot to lose when disaster strikes. Better mapping <strong>of</strong><br />
smaller urban disasters would illustrate clearly the large impact they have on vulnerable<br />
households.<br />
Table 1.2 What different aspects <strong>of</strong> urban poverty imply for everyday and disaster risk<br />
Aspect <strong>of</strong> urban poverty Implications for everyday risk Implications for disaster risk<br />
Inadequate and <strong>of</strong>ten unstable<br />
income and thus inadequate<br />
consumption <strong>of</strong> necessities,<br />
including food and, <strong>of</strong>ten, safe and<br />
sufficient water. Often, problems <strong>of</strong><br />
indebtedness, with debt repayments<br />
significantly reducing income available<br />
for necessities. Inability to pay<br />
for insurance.<br />
Inadequate, unstable or risky<br />
asset base (e.g., property, skills,<br />
savings, social networks)<br />
for individuals, households<br />
or communities.<br />
Poor-quality and <strong>of</strong>ten insecure,<br />
hazardous and overcrowded<br />
housing (<strong>of</strong>ten rented) located<br />
on dangerous sites such as flood<br />
plains, steep slopes and s<strong>of</strong>t or<br />
unstable ground.<br />
Inadequate provision <strong>of</strong> ‘public’<br />
infrastructure (piped water,<br />
sanitation, drainage, roads, footpaths,<br />
etc.), which increases the health burden<br />
and <strong>of</strong>ten the work burden.<br />
Inadequate provision <strong>of</strong> basic<br />
services – day care, schools,<br />
vocational training, healthcare,<br />
emergency services, public transport,<br />
communications, policing and good<br />
information on safe building practices.<br />
Limited or no safety net to ensure<br />
basic consumption can be maintained<br />
when income falls; also to ensure<br />
access to housing, healthcare and<br />
other necessities when these can no<br />
longer be paid for (or fully paid for).<br />
Lack <strong>of</strong> influence over what<br />
government does, including<br />
what it does in post-disaster<br />
responses.<br />
Limited influence over external<br />
civil society actors such as<br />
international aid agencies<br />
during disaster risk reduction<br />
and response.<br />
Very limited capacity to pay for<br />
housing which in urban areas<br />
means living in the worst-quality and<br />
most overcrowded homes in illegal<br />
settlements on dangerous sites lacking<br />
provision for infrastructure and services<br />
– so very high levels <strong>of</strong> environmental<br />
health risk.<br />
Very limited capacity to cope with<br />
stresses or shocks in everyday life<br />
– including rising prices or falling<br />
incomes, injuries and illnesses.<br />
High risk levels from physical accidents,<br />
fires, extreme weather and infectious<br />
diseases – with risks <strong>of</strong>ten increased<br />
by overcrowding.<br />
High levels <strong>of</strong> risk from contaminated<br />
water, inadequate sanitation, house<br />
flooding from lack <strong>of</strong> drainage.<br />
Unnecessarily high health burden from<br />
diseases and injuries because <strong>of</strong> lack<br />
<strong>of</strong> healthcare and emergency response.<br />
Very limited capacity to cope with<br />
stresses or shocks in everyday life<br />
– including rising prices or falling<br />
incomes, injuries and diseases.<br />
Low-income survivors <strong>of</strong>ten not<br />
allowed to move back to their former<br />
settlement and rebuild their homes and<br />
livelihoods.<br />
Lack <strong>of</strong> local input can lead to<br />
inappropriate development investments<br />
or missed opportunities to reduce<br />
risk and to build more secure local<br />
economies and livelihoods.<br />
<strong>World</strong> <strong>Disasters</strong> <strong>Report</strong> <strong>2010</strong> – Focus on urban risk<br />
In most cities and many urban centres<br />
in low- and middle-income nations,<br />
most low-cost housing is on dangerous<br />
sites, e.g., at high risk from flooding<br />
or landslides. The lack <strong>of</strong> public<br />
provision for infrastructure and services<br />
adds to such risks, particularly<br />
for flooding.<br />
Very limited capacity to cope with<br />
disaster events when they occur<br />
including lacking assets that are not<br />
damaged or destroyed by the disaster<br />
and having no insurance.<br />
Housing is <strong>of</strong>ten <strong>of</strong> poor quality<br />
so at risk from storms/high winds,<br />
earthquakes, landslides, floods, fires<br />
and disease transmission which may<br />
cause epidemics.<br />
Lack <strong>of</strong> protective infrastructure against<br />
flooding. Lack <strong>of</strong> roads, footpaths and<br />
drains inhibiting evacuation when<br />
disaster threatens or happens.<br />
Lack <strong>of</strong> healthcare and emergency<br />
services that should provide rapid<br />
response to disaster (and should have<br />
had a role in reducing disaster risk<br />
and in disaster preparedness).<br />
Very limited capacity to recover from<br />
disaster, for instance to afford food<br />
and water, rebuild homes and<br />
livelihoods. Lack <strong>of</strong> documentation<br />
<strong>of</strong>ten means not getting post-disaster<br />
support.<br />
Little external support for low-income<br />
groups and their organizations to<br />
rebuild in ways that reduce<br />
disaster risk.<br />
<strong>International</strong> humanitarian actors can<br />
overwhelm local government and civil<br />
society organizations alike. Lack <strong>of</strong><br />
partnership inhibits good governance.<br />
21
CHAPTER 1<br />
22<br />
Housing and urban disasters<br />
The <strong>of</strong>ficial statistics on disaster impacts suggest that the damage to, or destruction<br />
<strong>of</strong>, housing (and other assets) is far more serious in high-income nations. But this is<br />
misleading in that damage to or destruction <strong>of</strong> housing is usually far more serious<br />
in low- and middle-income nations in terms <strong>of</strong> the number <strong>of</strong> households affected<br />
and how much they are affected. This does not translate into a large monetary loss<br />
because most <strong>of</strong> the homes destroyed or damaged were not worth much in monetary<br />
terms or their monetary value is simply ignored because they are informal dwellings.<br />
This is so even though the house is not only the most valuable asset for those<br />
affected but also their home, and they receive little or no compensation when it is<br />
damaged or destroyed. Of course, they also have no insurance so they do not figure<br />
in any calculation <strong>of</strong> insurance payments. This is how disasters create or greatly<br />
exacerbate poverty.<br />
Each year, millions <strong>of</strong> households have their homes damaged or destroyed by disasters.<br />
For instance, in 2007 there were extensive floods throughout South and South-East<br />
Asia and in many nations in West and East Africa, while Hurricane Felix triggered<br />
floods in Nicaragua. This pattern was repeated in 2008, from the hurricane season in<br />
the Caribbean, to cyclones in Myanmar and Bangladesh and the devastating Sichuan<br />
earthquake in China. In 2009, millions were affected by the earthquake in Sumatra,<br />
Indonesia, and the floods in India and the Philippines.<br />
Greater consideration is needed <strong>of</strong> the role that housing plays in urban areas for lowincome<br />
groups such as the hundreds <strong>of</strong> thousands <strong>of</strong> slum dwellers rendered homeless<br />
by the January <strong>2010</strong> earthquake in Haiti. The value and importance <strong>of</strong> housing to<br />
such groups far exceeds its monetary value. What seems to outsiders to be no more<br />
than a shack built mostly <strong>of</strong> temporary materials is actually the home with all its key<br />
attributes for family and social life, privacy and safety, and is the primary defence for<br />
those living there against most environmental health risks. It may also be the place<br />
<strong>of</strong> work for some household members and is <strong>of</strong>ten the household’s most treasured<br />
asset. As family members build or improve their home, they increase the value <strong>of</strong><br />
their asset and its capacity to protect them from hazards. It is also the means by which<br />
they get access to income and services – and in urban areas, its location in relation to<br />
income-earning opportunities and services is <strong>of</strong>ten more important for low-income<br />
households than its size, quality or legality. This explains why such a high proportion<br />
<strong>of</strong> informal settlements are on flood plains or steep slopes at risk <strong>of</strong> landslides, because<br />
these are the only land sites within a city close to centres <strong>of</strong> employment that lowincome<br />
groups can occupy.<br />
Urban areas present two very specific challenges for housing. The first is that in low-<br />
and middle-income nations, land prices for housing are usually much higher than<br />
in rural areas. There are also <strong>of</strong>ten far more <strong>of</strong>ficial rules and regulations governing<br />
the acquisition and use <strong>of</strong> land for housing, which usually restricts land available and
Box 1.2 Can Haiti build back better?<br />
All eyes are on Haiti to see if some good can<br />
come <strong>of</strong> the tragedy which overtook the country<br />
on 12 January <strong>2010</strong> when its capital, Portau-Prince,<br />
was shaken to its foundations by an<br />
earthquake that killed 230,000 people and left<br />
some 1.5 million people homeless, according<br />
to Haitian government figures. Can the impoverished<br />
nation ‘build back better’ in the years to<br />
come? Can it, in collaboration with the international<br />
humanitarian community, restore not just<br />
its physical infrastructure but also rejuvenate its<br />
urban governance and risk reduction capability?<br />
In a country that has a slum prevalence<br />
rate <strong>of</strong> 70 per cent, there had been previous<br />
attempts to coordinate urban planning projects<br />
between the Haitian government and international<br />
aid agencies. But these efforts failed.<br />
According to the 2009 UN-Habitat report<br />
Strategic Citywide Spatial Planning, “Lack <strong>of</strong><br />
coordination between the implementing agencies<br />
has been one major reason, but the lack <strong>of</strong><br />
public participation, weak accountability and<br />
transparency, low staff capacity and the centralized<br />
system have contributed to the inertia.”<br />
That inertia hopefully evaporated with the<br />
12 January cataclysm. The long-term question<br />
now is how the government and its international<br />
partners can implement a post-quake plan comprehensive<br />
enough to cover the needs <strong>of</strong> not just<br />
the affected population but the entire nation in<br />
the years to come. While short-term relief goals<br />
were met – including the provision <strong>of</strong> temporary<br />
shelter materials and food – the long-term shelter<br />
needs are complicated by unresolved issues<br />
concerning land ownership, urban density and<br />
debris clearance to allow families to return to<br />
the sites <strong>of</strong> their original homes.<br />
Designed to hold 250,000 people, Portau-Prince<br />
grew to become one <strong>of</strong> the most<br />
densely populated cities in Latin America. Its<br />
2 million people consumed nearly all <strong>of</strong> Haiti’s<br />
resources. A mass influx to the capital began<br />
in the early 1980s following the swine flu alert<br />
worldwide and the subsequent slaughter <strong>of</strong><br />
more than 2,000 native ‘Creole’ pigs – the<br />
peasants’ emergency cash-in-hand.<br />
There they built homes with no regulatory<br />
oversight, creating new slum areas and further<br />
weakening a fragile environment. This unplanned<br />
growth hindered the immediate rescue efforts<br />
because there were no access roads between<br />
streets, just a patchwork <strong>of</strong> unmarked ‘corridors’.<br />
The capital’s eight municipalities which,<br />
before the quake, shared responsibility for city<br />
management with numerous central government<br />
bodies, were even less sure <strong>of</strong> their roles<br />
and mandates after the quake.<br />
“It was, in effect, the collapse <strong>of</strong> what<br />
was already a house <strong>of</strong> cards,” said Charles<br />
Clermont, who leads the government-appointed<br />
commission charged with housing and relocation.<br />
“We didn’t even have communication. On<br />
top <strong>of</strong> that, we had to figure out how to communicate<br />
with the international community. They<br />
have their own rules <strong>of</strong> the game and we had<br />
to figure out how to understand each other.”<br />
Much <strong>of</strong> the success <strong>of</strong> the reconstruction<br />
and recovery effort depends on involving<br />
and engaging the Haitian people themselves.<br />
Quake survivors pulled people from the rubble<br />
moments after it happened but they need to<br />
work together now and in the years ahead for<br />
the long-term good <strong>of</strong> their communities. Haiti<br />
is limping from emergency to temporary shelter<br />
to reconstruction, a process that could take<br />
several years before all the people affected by<br />
the quake are re-housed. Some say it will take<br />
five years; others say 25. �<br />
<strong>World</strong> <strong>Disasters</strong> <strong>Report</strong> <strong>2010</strong> – Focus on urban risk<br />
23
CHAPTER 1<br />
24<br />
further increases its price. This is why so much <strong>of</strong> the urban population in low- and<br />
middle-income nations lives on land that is illegally occupied or illegally subdivided<br />
(i.e., the land-use plan did not get <strong>of</strong>ficial approval). High land prices also put pressure<br />
on local municipalities to open high-risk areas for construction. The second challenge<br />
is that housing is not only ‘the home’ but also the ‘access to income’ and ‘access to<br />
services’, and for those with limited incomes, the house’s location in relation to where<br />
its occupants work and children can go to school is as important, or more important,<br />
than the quality <strong>of</strong> the house and the security <strong>of</strong> the tenure.<br />
The pavement dwellers in Mumbai who construct tiny ‘houses’ on the pavement do so<br />
because their incomes are so low that they cannot afford the cost <strong>of</strong> commuting from<br />
the cheapest ‘proper housing’ they could afford. The problem is not unemployment as<br />
most are employed. They are also not ‘recent migrants lacking knowledge <strong>of</strong> the city’<br />
as some have sought to portray them – most pavement dwellers have been in the city<br />
for many years. The problem is the gap between their incomes and the cost <strong>of</strong> housing<br />
in locations with good access to employment. This is compounded by their lack <strong>of</strong><br />
access to credit and the lack <strong>of</strong> incremental housing options (housing that can be built<br />
or extended over time) that are affordable. The same is true in Dharavi, the informal<br />
city <strong>of</strong> some 600,000 inhabitants which originally formed on the outskirts <strong>of</strong> Mumbai<br />
but which, as the city grew, became a valuable inner-city location. Housing conditions<br />
in Dharavi are very poor but at the same time, it provides a very good location with<br />
regard to income-earning opportunities and cheap accommodation.<br />
This point has great relevance for any post-disaster reconstruction because most <strong>of</strong><br />
those whose homes are damaged or destroyed want to return to the same location due<br />
to the access it provides both to income-earning opportunities and services, and to<br />
their social networks with neighbours. To relocate those made homeless by a disaster<br />
to ‘safe’ places far from where they have income-earning opportunities simply compounds<br />
still further the disaster’s impact and most will not stay there. It also has great<br />
relevance for any initiative to improve housing conditions because most households in<br />
an informal settlement are far better served by in-situ upgrading than by moving them<br />
to new housing in a new – almost always worse – location. In Haiti, as this report goes<br />
to press, there is much discussion <strong>of</strong> decentralizing urban development so the highdensity<br />
informal settlements in and around Port-au-Prince are not rebuilt. But such<br />
a decentralization will only work if underpinned by a decentralization <strong>of</strong> livelihood<br />
and income-earning opportunities – which is unlikely to happen. Households need a<br />
choice: some may wish to leave owing to the risks and trauma to their families, while<br />
others prefer to remain in, or return to, the areas where they had previously made their<br />
homes. And it should not be only those with pro<strong>of</strong> <strong>of</strong> land and housing ownership that<br />
get help for rebuilding.<br />
A final complication for disaster response is that the very poor quality <strong>of</strong> so much<br />
housing prior to the disaster, including inadequate infrastructure and the fact that it
was ‘illegal’, makes reconstruction very difficult. There is rarely a map <strong>of</strong> the settlement<br />
showing plots and plot boundaries. There is <strong>of</strong>ten little infrastructure to repair.<br />
The sites are frequently difficult or impossible to reach with trucks or any construction<br />
equipment as there are no paved roads and they are <strong>of</strong>ten built on challenging terrain<br />
(on swamps or hills). In most informal settlements, there is no register <strong>of</strong> who owns<br />
each plot and most <strong>of</strong> the population has no formal documentation. And there is the<br />
complication that many are tenants and their ‘landlords’ (who may also be occupying<br />
the land illegally) want to retain control <strong>of</strong> any reconstruction. If the informal settlement<br />
is on land that has become valuable, a further complication is that developers<br />
want to displace the population from it and governments <strong>of</strong>ten support them in evicting<br />
the residents.<br />
External agencies also wish to obtain adequate accommodation for those whose homes<br />
have been damaged or destroyed – but they are rarely very good at dealing with all the<br />
complications mentioned above. And in most instances, they will face opposition from<br />
middle- and upper-income groups, government agencies, landlords and <strong>of</strong>ten developers<br />
regarding the solutions that work best to enable low-income groups to reconstruct<br />
their homes and settlements. We know the good principles on which housing reconstruction<br />
should be based – the greater the control <strong>of</strong> local residents, both individually<br />
and as a community, the more successful the support is likely to be. The <strong>International</strong><br />
<strong>Federation</strong> <strong>of</strong> <strong>Red</strong> <strong>Cross</strong> and <strong>Red</strong> Crescent Societies has specified key principles: “It is<br />
increasingly recognized that the meeting <strong>of</strong> shelter needs in the aftermath <strong>of</strong> disaster<br />
should be seen as a process <strong>of</strong> ‘sheltering’ undertaken by the affected household with<br />
varying types <strong>of</strong> material, technical, financial and social assistance as appropriate rather<br />
than simply the provision <strong>of</strong> a pre-determined shelter ‘product’.” Even if governments<br />
understand this important principle, it does not mean they will allow it to be implemented<br />
on the ground. Governments may prefer to control the emergency shelter<br />
finance that is being made available but their record in housing provision is poor. Topdown<br />
housing provision tends to be expensive, <strong>of</strong>ten <strong>of</strong> inadequate quality, with insufficient<br />
flexibility to take on board community requirements, and in a disadvantageous<br />
location if resettlement is involved.<br />
What you do after a disaster<br />
To state the obvious, disaster response should centre on the needs and priorities <strong>of</strong><br />
the survivors – and others who are negatively impacted. In low- and middle-income<br />
nations, very few home-owners will have insurance to help fund rebuilding or reconstruction<br />
and most people will have very limited savings or assets to tide them over<br />
until they can get back to paid work. So helping them to re-establish sources <strong>of</strong> income<br />
and livelihoods rapidly is a high priority. In most instances, a high proportion will<br />
want to return to their damaged or destroyed settlements and there re-establish their<br />
homes and their own organizations. They need to feel supported as they do so – supported<br />
to meet, to network, to give space for their community organizations, <strong>of</strong>ten<br />
<strong>World</strong> <strong>Disasters</strong> <strong>Report</strong> <strong>2010</strong> – Focus on urban risk<br />
25
CHAPTER 1<br />
26<br />
to share their grief and in their own time begin to participate in rebuilding. These<br />
responses have to strengthen and support the survivors’ own organizations. They have<br />
to keep women at the centre <strong>of</strong> these associations, even though this is <strong>of</strong>ten difficult<br />
as priorities and actions are dominated by more aggressive and well-connected groups.<br />
This is not easy. People have been affected in many different ways and may have different<br />
priorities; they may see other affected groups as competitors in seeking funds<br />
or support from different external organizations. Good practice means involving local<br />
people right at the outset <strong>of</strong> any discussion <strong>of</strong> rebuilding and in managing the shift<br />
from relief to reconstruction.<br />
The shift from immediate response to reconstruction in an urban environment is never<br />
easy. Rarely does this help those most affected with their two most pressing priorities:<br />
supporting the survivors to rebuild their homes and their livelihoods. After a disaster,<br />
the needs for medical treatment, healthcare, food and water, and <strong>of</strong>ten temporary<br />
accommodation are so obvious. But the disaster does not undo the <strong>of</strong>ten antagonistic<br />
relationships between local governments and the urban poor and their informal communities<br />
and livelihoods. Disaster relief agencies cannot address the root causes <strong>of</strong> why<br />
so much <strong>of</strong> a city’s population was so heavily impacted – because they lived in illegal<br />
settlements with poor-quality homes on dangerous and disaster-prone sites to which<br />
the government had refused to provide infrastructure and services. Disaster relief agencies<br />
<strong>of</strong>ten fail to secure safer, well-located land sites for housing where those who lost<br />
their homes in informal settlements can build; such sites are too valuable and those<br />
in government and higher-income groups would not support this. All they can <strong>of</strong>fer<br />
are sites far away that do not have good access to income-earning opportunities. So all<br />
the inequalities and difficulties that faced the urban poor prior to the disaster remain<br />
to constrain post-disaster responses. As the Asian Coalition for Housing Rights has<br />
noted, unless disaster aid quickly learns to work with the untitled, the unregistered,<br />
the unlisted and the undocumented, it can support and even reinforce the inequalities<br />
that existed prior to the disaster.<br />
Strengthening and supporting local action for<br />
disaster risk reduction in urban areas<br />
Good development, good disaster risk reduction and good adaptation to climate<br />
change are all intensely local with many links and complementarities between them.<br />
They need effective local institutions that are accountable to citizens including those<br />
living in informal settlements. It all amounts to a difficult challenge for the international<br />
agencies that fund development and will be difficult for those assigned the<br />
responsibilities <strong>of</strong> funding climate change adaptation. All such agencies are under pressure<br />
to keep down staff costs and to have exit strategies. All such funding agencies are<br />
only as effective as the local intermediaries that they fund. The strong emphasis <strong>of</strong> this<br />
year’s <strong>World</strong> <strong>Disasters</strong> <strong>Report</strong> is on supporting community-level initiatives because in<br />
almost all low-income and most middle-income nations, this is the only way to ensure
that the needs and priorities <strong>of</strong> those most at risk from disaster are addressed. But large<br />
development assistance agencies frequently do not know how to support communitylevel<br />
organizations – indeed, <strong>of</strong>ten they never talk to them; they were set up to channel<br />
large sums to national governments, not to support the myriad community and local<br />
government initiatives that can reduce disaster risk and that need modest external<br />
support.<br />
Where city and municipal governments have sufficient capacity, focus on their lowincome<br />
households and have good relations with their citizens, the possibilities for<br />
disaster risk reduction are greatly enhanced. These cities and municipalities provide<br />
us with the evidence that an urbanizing world need not ‘urbanize’ disaster risks. Most<br />
disaster risk reduction is within their conventional urban management roles – for<br />
instance, in land-use management, in strategic urban planning and in setting and<br />
enforcing regulations for land use, buildings and infrastructure. So it is the competence<br />
and capacity <strong>of</strong> city and municipal governments to work with and support their lowincome<br />
populations that defines whether urbanization is associated with disaster risk.<br />
It is down to the governments <strong>of</strong> high-income nations to agree to the greenhouse gas<br />
emission reductions that are needed to avoid ‘dangerous climate change’; <strong>of</strong> course, this<br />
depends too on low-carbon development paths for successful low- and middle-income<br />
nations but their governments will not agree to these unless high-income nations demonstrate<br />
their commitments. And, again, it is down to the competence and capacity <strong>of</strong><br />
city and municipal governments to work with and support their low-income populations<br />
that will define whether the climate change impacts that cannot be avoided do<br />
actually result in urban disasters.<br />
This report has enough examples <strong>of</strong> good practice from low- and middle-income<br />
nations to show that urban disaster risk reduction is possible but these are still the exceptions.<br />
Good local land-use management supported by good local risk assessments can<br />
transform urban plans into disaster reduction plans as unsafe sites are avoided or made<br />
safe. Good upgrading programmes for informal settlements that are well informed in<br />
risk reduction measures can dramatically reduce disaster risk. A framework <strong>of</strong> support<br />
from higher levels <strong>of</strong> government and international agencies is required. Learning networks<br />
need to be nurtured for city authorities, urban pr<strong>of</strong>essionals and citizen groups.<br />
Overall, this needs a sea-change in the preparedness and capacity <strong>of</strong> most bilateral aid<br />
agencies to work in urban areas with urban organizations and local authorities.<br />
This chapter, including Box 1.1, was written by David Satterthwaite, Senior Fellow, <strong>International</strong><br />
Institute for Environment and Development (IIED). Box 1.2 was written by<br />
Kathie Klarreich, a freelance journalist and Haiti specialist.<br />
<strong>World</strong> <strong>Disasters</strong> <strong>Report</strong> <strong>2010</strong> – Focus on urban risk<br />
27
CHAPTER 1<br />
28<br />
Sources and further information<br />
Asian Coalition for Housing Rights (ACHR). Tsunami: How Asia’s Precarious Coastal<br />
Settlements are Coping after the Tsunami. Housing by People in Asia 16. Bangkok:<br />
ACHR, 2005.<br />
Bapat, M. Poverty Lines and Lives <strong>of</strong> the Poor; Underestimation <strong>of</strong> Urban Poverty, the<br />
case <strong>of</strong> India. Working paper. London: <strong>International</strong> Institute for Environment and<br />
Development (IIED), 2009.<br />
Cairncross, S. and Alvarinho, M. ‘The Mozambique floods <strong>of</strong> 2000; health impacts<br />
and response’ in Few, R. and Matthies, F. (eds.), Flood Hazards and Health. London:<br />
Earthscan Publications, 2006.<br />
Centre for the Epidemiology <strong>of</strong> <strong>Disasters</strong>. EM-DAT database. Available online: www.<br />
emdat.be.<br />
Dodman, D., Hardoy, J. and Satterthwaite, D. ‘Urban Development and Intensive<br />
and Extensive Risk’, background paper for United Nations <strong>International</strong> Strategy<br />
for Disaster <strong>Red</strong>uction (UNISDR), Global Assessment <strong>Report</strong> on Disaster Risk<br />
<strong>Red</strong>uction: Risk and Poverty in a Changing Climate, Geneva: UNISDR, 2009.<br />
Douglas, I. et al. ‘Unjust waters: climate change, flooding and the urban poor in Africa’<br />
in Environment and Urbanization, Vol. 20, No. 1, pp. 187–206, 2008.<br />
Hardoy, J.E., Mitlin, D. and Satterthwaite, D. Environmental Problems in an<br />
Urbanizing <strong>World</strong>: Finding Solutions for Cities in Africa, Asia and Latin America.<br />
London: Earthscan Publications, 2001.<br />
<strong>International</strong> <strong>Federation</strong> <strong>of</strong> <strong>Red</strong> <strong>Cross</strong> and <strong>Red</strong> Crescent Societies (IFRC). Global<br />
Shelter Programme. Geneva: IFRC, 2009.<br />
Martinez, J. et al. ‘Trends in urban and slum indicators across developing world cities,<br />
1990–2003’ in Habitat <strong>International</strong>, Vol. 32, pp. 86–108, 2008.<br />
Munich Re Group. Natural <strong>Disasters</strong> according to Country Income Groups, 1980-2004.<br />
Munich: Munich Re NatCatSERVICE, 2005.<br />
Patel, S. ‘Reflections about disasters and the poor: Exploring possibilities to address<br />
preparedness and management by communities <strong>of</strong> the urban poor’, unpublished<br />
background paper, <strong>2010</strong>.<br />
Potts, D. ‘The Slowing <strong>of</strong> Sub-Saharan Africa’s Urbanization: Evidence and<br />
Implications for Urban Livelihoods’ in Environment and Urbanization, Vol. 21,<br />
No. 1, pp. 253–9, 2009.
Ravallion, M., Chen, S. and Sangraula, P. New Evidence on the Urbanization <strong>of</strong> Global<br />
Poverty. Policy Research Working Paper WPS4199. Washington DC: <strong>World</strong> Bank,<br />
2007. Available online: www-wds.worldbank.org / external / default / main?pagePK=<br />
64193027&piPK=64187937&theSitePK=523679&menuPK=64187510&search<br />
MenuPK=64187283&theSitePK=523679&entityID=000158.<br />
Roberts, D. ‘The Disaster Management Municipal Adaptation Plan in Durban’, background<br />
paper for the <strong>World</strong> <strong>Disasters</strong> <strong>Report</strong>: Focus on urban risk, <strong>2010</strong>.<br />
Sabry, S. Poverty Lines in Greater Cairo: Under-estimating and Misrepresenting Poverty.<br />
Poverty <strong>Red</strong>uction in Urban Areas Series Working Paper 21. London: IIED, 2009.<br />
Satterthwaite, D. ‘Urban myths and the mis-use <strong>of</strong> data that underpin them’, in<br />
Beall, J., Guha-Khasnobis, B. and Kanbur, R. (eds.), Beyond the Tipping Point:<br />
Development in an Urban <strong>World</strong>. Oxford: Oxford University Press, <strong>2010</strong>.<br />
Satterthwaite, D. The Transition to a Predominantly Urban <strong>World</strong> and its Underpinnings.<br />
Human Settlements Discussion Paper. London: IIED, 2007.<br />
Society for the Promotion <strong>of</strong> Area Resource Centres (SPARC). “We the Invisible”; a<br />
Census <strong>of</strong> Pavement Dwellers. Mumbai: SPARC Mumbai, 1985.<br />
United Nations. <strong>World</strong> Urbanization Prospects: the 2007 Revision. CD-ROM edition,<br />
data in digital form (POP / DB / WUP / Rev.2007). New York: UN Department <strong>of</strong><br />
Economic and Social Affairs, Population Division, 2008.<br />
UN Human Settlements Programme (UN-Habitat). State <strong>of</strong> the <strong>World</strong>’s Cities <strong>2010</strong>/2011<br />
– Bridging The Urban Divide. London and Washington DC: UN-Habitat, <strong>2010</strong>.<br />
UN-Habitat. Strategic Citywide Spatial Planning. Nairobi: UN-Habitat, 2009.<br />
UN-Habitat. Water and Sanitation in the <strong>World</strong>’s Cities; Local Action for Global Goals.<br />
London: Earthscan Publications, 2003.<br />
UNISDR. Global Assessment <strong>Report</strong> on Disaster Risk <strong>Red</strong>uction: Risk and Poverty in a<br />
Changing Climate. Geneva: UNISDR, 2009.<br />
<strong>World</strong> <strong>Disasters</strong> <strong>Report</strong> <strong>2010</strong> – Focus on urban risk<br />
29
CHAPTER 2<br />
30
Urban disaster trends<br />
It is well known that more than half the world’s population lives in urban areas. Perhaps<br />
less well known is that most <strong>of</strong> the world’s urban population and most <strong>of</strong> its largest<br />
cities are now in low- and middle-income nations where an estimated 2.6 billion urban<br />
dwellers, out <strong>of</strong> an estimated 3.5 billion worldwide, live. This is unprecedented since,<br />
for millennia, most <strong>of</strong> the urban population and most <strong>of</strong> the largest cities have been in<br />
the wealthiest nations. With one in three <strong>of</strong> the world’s total population now living in<br />
cities and towns in low- and middle-income nations, attention should focus on how<br />
well these cities and towns protect their inhabitants and enterprises from disasters. It<br />
should be borne in mind that even though the United Nations Human Settlements<br />
Programme (UN-Habitat) claimed earlier this year that 227 million people no longer<br />
meet the limited criteria for defining slum dwellers, it still acknowledged that their<br />
numbers had increased from 776.7 million in 2000 to 827.6 million in <strong>2010</strong>, and<br />
these people are among the most vulnerable to a wide range <strong>of</strong> urban risks stemming<br />
from natural hazards, disease and inadequate support services in areas such as transport<br />
and health.<br />
One <strong>of</strong> the key elements to reduce disaster risk is to better understand how urban areas<br />
are at risk and how these patterns <strong>of</strong> risk differ from rural areas. Part <strong>of</strong> this risk pr<strong>of</strong>ile<br />
requires a detailed knowledge <strong>of</strong> past disaster-related events in the city in question,<br />
showing the spatial distribution <strong>of</strong> losses and damages. However, this information is<br />
available at the urban level in only a handful <strong>of</strong> cities. A part <strong>of</strong> the capability <strong>of</strong> governments<br />
and people to reduce risk and vulnerability is influenced by the availability<br />
<strong>of</strong> accurate information about the risks to their city and, at present, there is a great<br />
deficiency with regard to accurate monitoring and reporting <strong>of</strong> urban disaster trends.<br />
Urban growth and its relation to disasters<br />
Figure 2.1 shows the growth in the world’s urban population from 1950 to <strong>2010</strong> and<br />
then what the United Nations (UN) projects for 2030. The projections suggest that,<br />
from <strong>2010</strong> to 2030, almost all the growth in the world’s population will be in urban<br />
centres in low- and middle-income nations and that Asia will undergo massive urban<br />
growth. For many nations, the most recent data are from censuses held around 2000,<br />
as the results from the new round <strong>of</strong> censuses that took place in or around <strong>2010</strong> are<br />
not yet available. So some <strong>of</strong> the projections may prove to be too high if, for instance,<br />
urban populations grow more slowly due to rates <strong>of</strong> natural increase decreasing more<br />
rapidly than expected or if economic stagnation or decline reduces or stops rural-tourban<br />
migration. But even if this happens, the scale <strong>of</strong> the change in less than a century<br />
is phenomenal:<br />
�<br />
� A global urban population that grew from 737 million in 1950 to around 3.5<br />
billion today and to an expected 5 billion by 2030.<br />
<strong>World</strong> <strong>Disasters</strong> <strong>Report</strong> <strong>2010</strong> – Focus on urban risk<br />
Photo opposite page:<br />
Slum dwellers in the<br />
cities <strong>of</strong> low- and<br />
middle-income nations<br />
are among the most<br />
vulnerable to risks<br />
stemming from natural<br />
hazards, disease and<br />
inadequate support<br />
services. Rocinha,<br />
shown here, is the<br />
largest favela, or slum,<br />
in the Brazilian megacity,<br />
Rio de Janeiro,<br />
and is home to an<br />
estimated 250,000<br />
people.<br />
© Benoit<br />
Matsha-Carpentier/IFRC<br />
31
CHAPTER 2<br />
32<br />
�� A shift from most <strong>of</strong> the urban population being in high-income nations (1950)<br />
to most <strong>of</strong> the urban population being in low- and middle-income nations (<strong>2010</strong><br />
and beyond).<br />
�� Africa with 4 per cent <strong>of</strong> the world’s urban population in 1950 and 15 per cent<br />
by 2030.<br />
�� Asia with 32 per cent <strong>of</strong> the world’s urban population in 1950 and 55 per cent<br />
by 2030.<br />
Figure 2.1<br />
Growth in urban population globally<br />
and by region<br />
Population (millions)<br />
5,000<br />
4,500<br />
4,000<br />
3,500<br />
3,000<br />
2,500<br />
2,000<br />
1,500<br />
1,000<br />
500<br />
0<br />
1950 1970 1990 <strong>2010</strong> 2030<br />
Source: UN Population Division (2005)<br />
North America<br />
Latin America and<br />
the Caribbean<br />
Europe<br />
Asia<br />
Africa<br />
Low- and<br />
middle-income nations<br />
High-income nations<br />
<strong>World</strong><br />
Two aspects <strong>of</strong> the rapid growth in the world’s urban population are the increase in the<br />
number <strong>of</strong> large cities and the historically unprecedented size <strong>of</strong> the largest cities. Just two<br />
centuries ago, there were only two ‘million-cities’ (cities with 1 million or more inhabitants)<br />
– London and Beijing (then called Peking). By 1950, there were 75; by 2008, 431. A large<br />
and increasing proportion <strong>of</strong> these million-cities are in Africa, Asia and Latin America. The<br />
average size <strong>of</strong> the world’s largest cities has also increased dramatically as Figure 2.2 illustrates.<br />
While there are examples <strong>of</strong> cities over the last two millennia that had populations <strong>of</strong><br />
1 million or more inhabitants, the city or metropolitan area with several million inhabitants<br />
is a recent phenomenon – London being the first to reach this size, in the second half <strong>of</strong> the<br />
19th century. By 2000, there were 17 ‘mega-cities’ with more than 10 million inhabitants.<br />
However, the economic transformations that underpin these statistics on rapid urban<br />
change are just as impressive – the six-fold increase in the size <strong>of</strong> the world economy<br />
between 1950 and <strong>2010</strong> and the fact that most <strong>of</strong> this increase came from the growth<br />
in industrial production and services largely located in urban areas. There is a strong<br />
economic logic underpinning rapid urbanization (see Figure 2.3). Today, around 97per<br />
cent <strong>of</strong> the world’s gross domestic product (GDP) is generated by industry and services,
about 65 per cent <strong>of</strong> the world’s economically active population works in industry and<br />
services and a very high proportion <strong>of</strong> all industry and services are in urban areas. Most<br />
<strong>of</strong> the world’s largest cities are in the world’s largest economies.<br />
Figure 2.2<br />
The change in the average population size <strong>of</strong> the world’s 100<br />
largest cities, 1800 to 2000<br />
Population (millions)<br />
7<br />
6<br />
5<br />
4<br />
3<br />
2<br />
1<br />
0<br />
0.18<br />
0.28<br />
0.73<br />
2.00<br />
6.30<br />
1800 1850 1900 1950 2000<br />
Source: Satterthwaite (2007)<br />
Figure 2.3<br />
Changes in the proportion <strong>of</strong> GDP for low- and middle-income nations,<br />
1950–2005<br />
%<br />
100<br />
90<br />
80<br />
70<br />
60<br />
50<br />
40<br />
30<br />
20<br />
10<br />
0<br />
1950 1955 1960 1965 1970 1975 1980 1985 1990 1995 2000 2005<br />
Source: Satterthwaite (2007)<br />
% GDP from industry<br />
and services<br />
% labour force in industry<br />
and services<br />
% level <strong>of</strong> urbanization<br />
There is a very large deficit in provision for the infrastructure and services that reduce<br />
disaster risk for much <strong>of</strong> the population in Latin America, Africa and Asia. But much <strong>of</strong><br />
the reason for this is institutional failure and governance failure. Although rapid urban<br />
<strong>World</strong> <strong>Disasters</strong> <strong>Report</strong> <strong>2010</strong> – Focus on urban risk<br />
33
CHAPTER 2<br />
34<br />
growth is <strong>of</strong>ten seen as a problem, it is generally the nations with the best economic performance<br />
that have urbanized most in the last 50 years. All the world’s wealthiest nations<br />
are predominantly urbanized; almost all the world’s poorest nations are predominantly<br />
rural. In addition, there is <strong>of</strong>ten an association between rapid urban change and better<br />
standards <strong>of</strong> living. Not only is most urbanization associated with stronger economies<br />
but, generally, the more urbanized a nation, the higher the average life expectancy and the<br />
literacy rate, and the stronger the democracy, especially at local level. Of course, beyond<br />
all these quantitative measures, cities are also centres <strong>of</strong> culture and <strong>of</strong> social and political<br />
innovation. Mega-cities may appear chaotic but most have life expectancies and provision<br />
for piped water, sanitation, schools and healthcare that are well above their national average<br />
– even if the aggregate statistics for each mega-city can hide a significant proportion<br />
<strong>of</strong> their population living in very poor conditions. Some <strong>of</strong> world’s fastest-growing cities<br />
over the last 50 years also have the best standards <strong>of</strong> living within their nation.<br />
Looking over the trends <strong>of</strong> large-scale disasters <strong>of</strong> the last decade from the Centre for<br />
Research on the Epidemiology <strong>of</strong> <strong>Disasters</strong> (CRED) database (EM-DAT), it seems that<br />
regions <strong>of</strong> the world that are more urbanized tend to have fewer deaths from natural disasters,<br />
but higher economic losses. This is understandable, given that urban areas concentrate<br />
high-value assets and that well-governed cities, especially those in high-income<br />
countries, should enormously reduce deaths and serious injuries – even if it is <strong>of</strong>ten less<br />
easy to guard against economic losses. It is noteworthy that cyclones, floods and earthquakes<br />
produce massive economic costs in Europe and Japan but very few deaths. Both<br />
Europe and Japan are highly urbanized, Europe has 72 per cent <strong>of</strong> the population living<br />
in cities and Japan, 66 per cent. In 2007, 65 disasters reported in Europe accounted for<br />
1 per cent <strong>of</strong> the deaths worldwide but 27 per cent <strong>of</strong> the economic damages. In 2007,<br />
Japan had the highest reported economic damages for one single earthquake event on<br />
16 July, costing US$ 12.5 billion whereas nine people were reportedly killed. In Africa,<br />
northern Africa has 21 per cent <strong>of</strong> the continent’s population and is the only highly<br />
urbanized region (51 per cent <strong>of</strong> its population lives in cities). In 2007, northern Africa<br />
had 12 per cent <strong>of</strong> the disasters that affected the continent, 6 per cent <strong>of</strong> affected persons,<br />
yet 45 per cent <strong>of</strong> economic damages for all <strong>of</strong> Africa. In the period from 2000 to<br />
2006, northern Africa had 13 per cent <strong>of</strong> disasters, 1 per cent <strong>of</strong> affected persons, yet<br />
75 cent <strong>of</strong> damages recorded for the continent as a whole.<br />
Identifying ‘urban’ disasters and their impacts<br />
Cities, with their concentration <strong>of</strong> people, buildings, infrastructure and economic activities,<br />
are the locus <strong>of</strong> both large and small-scale disasters. A look at the major disasters over<br />
the last ten years highlights that large-scale disasters, which affect a whole region, usually<br />
have an urban component to them (see Table 2.1). Some disasters could also be called<br />
‘urban’ disasters, since the great majority <strong>of</strong> damages are concentrated in city centres. This<br />
is made evident by the recent earthquake in Port-au-Prince, Haiti and Hurricane Katrina<br />
in New Orleans, where urban areas sustained most <strong>of</strong> the losses and damages.
With the exception <strong>of</strong> the South Asian tsunami in 2004, many <strong>of</strong> the deaths and losses<br />
from earthquakes have been in cities. Of all large disasters, seismic events have killed<br />
the greatest number <strong>of</strong> people in recent years, averaging 50,184 people per year from<br />
2000 to 2008. Flood events have affected the largest numbers <strong>of</strong> people, averaging<br />
Table 2.1 Large disaster events over the period 2000–<strong>2010</strong> impacting on cities<br />
Popular<br />
name<br />
Haiti<br />
earthquake<br />
Sichuan<br />
earthquake<br />
Cyclone<br />
Nargis<br />
Java<br />
earthquake<br />
Kashmir<br />
earthquake<br />
Hurricane<br />
Katrina<br />
Mumbai<br />
floods<br />
South Asian<br />
tsunami<br />
Bam<br />
earthquake<br />
European<br />
heatwave<br />
Dresden<br />
floods<br />
Gujurat<br />
earthquake<br />
Main<br />
countries<br />
affected<br />
Haiti<br />
Date <strong>of</strong><br />
event<br />
12 January<br />
<strong>2010</strong><br />
Type <strong>of</strong><br />
hazard<br />
China 12 May 2008 Earthquake<br />
Myanmar 2 May 2008<br />
Main cities<br />
affected<br />
Total<br />
number <strong>of</strong><br />
deaths<br />
Total<br />
number <strong>of</strong><br />
affected<br />
<strong>World</strong> <strong>Disasters</strong> <strong>Report</strong> <strong>2010</strong> – Focus on urban risk<br />
35<br />
Total<br />
damages<br />
US$<br />
Earthquake Port-au-Prince 222,570 3,400,000 n / a<br />
Tropical<br />
cyclone<br />
Beichuan,<br />
Dujiangyan,<br />
Shifang,<br />
Mianzhu,<br />
Juyuan,<br />
Jiangyou,<br />
Mianyang,<br />
Chengdu,<br />
Qionglai,<br />
Deyang<br />
87,476 45,976,596 85 billion<br />
Yangon 138,366 2,420,000 4 billion<br />
Indonesia 27 May 2006 Earthquake Yogyakarta 5,778 3,177,923 3.1 billion<br />
Pakistan<br />
United States<br />
8 October<br />
2005<br />
29 August<br />
2005<br />
Earthquake Muzaffarabad 73,338 5,128,000 5.2 billion<br />
Tropical<br />
cyclone<br />
New Orleans 1,833 500,000 125 billion<br />
India 26 July 2005 Flood Mumbai 1,200 20,000,055 3.3 billion<br />
Indonesia, Sri<br />
Lanka, India,<br />
Thailand,<br />
Malaysia,<br />
Maldives,<br />
Myanmar<br />
Iran<br />
Italy, France,<br />
Spain,<br />
Germany,<br />
Portugal,<br />
Switzerland<br />
Germany<br />
India<br />
26 December<br />
2004<br />
26 December<br />
2003<br />
Earthquake<br />
and tsunami<br />
Banda Aceh,<br />
Chennai<br />
(some<br />
damages)<br />
226,408 2,321,700 9.2 billion<br />
Earthquake Bam 26,796 267,628 500 million<br />
Summer 2003 Extreme heat Various 72,210 Not reported Not reported<br />
11 August<br />
2002<br />
26 January<br />
2001<br />
Flood Dresden 27 330,108 11.6 billion<br />
Earthquake<br />
Bhuj,<br />
Ahmedabad<br />
20,005 6,321,812 2.6 billion<br />
Source: EM-DAT: The OFDA / CRED <strong>International</strong> Disaster Database (www.emdat.net), Université catholique de Louvain –<br />
Brussels – Belgium. Complied by author.
CHAPTER 2<br />
36<br />
99 million people per year between 2000 and 2008. While we do not know how many<br />
people affected by floods live in urban areas, we can understand that it must be a significant<br />
proportion.<br />
While it is possible to identify certain disasters as urban disasters, it becomes more<br />
complicated to assess what proportion <strong>of</strong> the total losses <strong>of</strong> a disaster are in urban areas<br />
and what proportion are outside the urban areas. At the global or regional scale, we<br />
have little sense <strong>of</strong> what proportion <strong>of</strong> deaths and injuries are within urban centres.<br />
For instance, Cyclone Nargis caused an estimated 140,000 deaths in Myanmar and<br />
had serious impacts in urban centres including Yangon, but we have little idea <strong>of</strong> what<br />
proportion <strong>of</strong> these impacts were in urban areas.<br />
Precise information about impacts in urban areas for a disaster that affected a region is<br />
not widely reported, yet it is important in order to understand who, and what, has been<br />
affected. Consider, for example, the 1988 floods in Bangladesh, which inundated 52 per<br />
cent <strong>of</strong> the country. This flood also impacted Dhaka, the nation’s capital, which then had<br />
about 6 million residents. Flood waters covered 85 per cent <strong>of</strong> the city for several weeks.<br />
For two weeks Dhaka was completely cut <strong>of</strong>f, with depths <strong>of</strong> inundation ranging from<br />
0.3 to more than 4.5 metres. Across the country, 45 million people, <strong>of</strong> a total population<br />
<strong>of</strong> 110 million, were affected by the floods. It is estimated that between 2.2 and 4<br />
million <strong>of</strong> the affected were in Dhaka, or some 30 to 60 per cent <strong>of</strong> the city’s population.<br />
The total death toll is reported to have been around 2,379 deaths for all the affected<br />
regions with 150 deaths in Dhaka. Ten years later, in 1998, floods again affected Dhaka,<br />
covering large portions <strong>of</strong> the city for a two-month period. An estimated 918 people<br />
died in the 1998 floods, but the number <strong>of</strong> deaths, if any, that occurred in the capital<br />
was not reported. We do know that 30 per cent <strong>of</strong> housing in the Dhaka metropolitan<br />
area sustained damage, and that almost 32 per cent <strong>of</strong> damages were to houses <strong>of</strong> the<br />
very poor, while 36 per cent <strong>of</strong> houses belonging to lower-middle class and poor people<br />
were damaged. In one sense, distinguishing between rural and urban deaths and injuries<br />
might be considered inappropriate in that disaster risk reduction should seek to prevent<br />
them all. But this lack <strong>of</strong> a more spatially precise idea <strong>of</strong> where deaths and injuries occur<br />
also hinders an understanding <strong>of</strong> where and how risk reduction should take place.<br />
Cities are affected by a wide range <strong>of</strong> disaster events, which extend beyond our conception<br />
<strong>of</strong> ‘natural’ hazards. In African Cities <strong>of</strong> Hope and Risk, Ben Wisner and Mark<br />
Pelling used the data available from CRED to identify 166 urban disasters affecting<br />
28 African cities between 1997 and 2008. They identified natural hazards such as<br />
urban drought, earthquakes, windstorms, floods and extreme temperatures. Floods<br />
are most represented in the data, accounting for one-third <strong>of</strong> the total 3.3 million<br />
people affected by urban disasters in Africa. However, disasters in cities are also largely<br />
technological hazards. A review <strong>of</strong> urban disasters shows the wide range <strong>of</strong> disasters<br />
that occur in African cities, such as aircraft crashes, fires and explosions, ferry-boat<br />
sinkings, subsidence and sink holes, illegal dumping <strong>of</strong> hazardous materials, shack
fires and traffic accidents. Building collapses, documented from a media review, show<br />
that in a two-year period (from 2006 to 2008), nine building collapses killed at least<br />
100 people. Cities are also the locus <strong>of</strong> social hazards such as violent crime, riots and<br />
terrorism, as well as public health hazards such as HIV / AIDS, which has a higher incidence<br />
in cities. Epidemics are a major disaster affecting people in African cities, and<br />
it was found that 300,000 people were affected by urban epidemics over the period,<br />
linked to poor water quality, inadequate sanitation and flooding.<br />
Food insecurity is another type <strong>of</strong> disaster event that is now recognized as seriously affecting<br />
urban dwellers. Urban food insecurity may be a cumulative effect caused by other<br />
disaster events (see Box 2.1 on food security and Tropical Storm Ketsana) or it may be<br />
caused by international economic conditions, such as the rise in food and fuel prices that<br />
peaked in mid-2008. Large-scale disasters, especially flooding and droughts, may reduce<br />
food availability in cities, however urban food insecurity is, for the most part, considered<br />
to be a food access problem, rather than a food availability problem. Generally food is<br />
available in cities, but the poor cannot afford to buy it, either because prices are too high<br />
or their incomes have decreased due to lack <strong>of</strong> work. UN-Habitat’s data on malnutrition<br />
in urban areas collected between 1990 and 2007 show that serious malnutrition has been<br />
widespread in urban slums <strong>of</strong> Africa, Asia, Latin America and the Caribbean. In 2007, in<br />
the Democratic Republic <strong>of</strong> the Congo, 41 per cent <strong>of</strong> children from poor urban areas<br />
<strong>World</strong> <strong>Disasters</strong> <strong>Report</strong> <strong>2010</strong> – Focus on urban risk<br />
More than 56 per<br />
cent <strong>of</strong> the population<br />
<strong>of</strong> the Philippines,<br />
including inhabitants<br />
<strong>of</strong> the capital, Manila,<br />
live on the island <strong>of</strong><br />
Luzon. In September<br />
2009, Tropical Storm<br />
Ketsana brought<br />
torrential rain to the<br />
area, causing the<br />
worst floods in more<br />
than 40 years.<br />
© IFRC<br />
37
38<br />
were malnourished, compared with 16 per cent in non-slum urban areas. Since income in<br />
urban areas is strongly tied to the opportunity for work, disasters can quickly impact on a<br />
family’s wages and purchasing power for food. Furthermore, since people in cities spend a<br />
disproportionate amount <strong>of</strong> their income on other expenses, such as rent, utilities, transport<br />
and education, this leaves an insufficient budget for food. Research in Bangladesh<br />
during the recent commodities crisis shows that in March 2007, daily labourers in urban<br />
areas were able to purchase 5 to 7 kilograms <strong>of</strong> rice for one day <strong>of</strong> work, yet one year later,<br />
the same day’s work purchased only 3.7 to 5 kg <strong>of</strong> rice, the main staple food.<br />
Box 2.1 Tropical Storm Ketsana and urban food insecurity<br />
Tropical Storm Ketsana struck the Philippines on<br />
26 September 2009 with torrential rains, the<br />
heaviest in more than 40 years, causing severe<br />
flooding and massive population displacement<br />
in urban areas, but also in the surrounding countryside.<br />
The joint UN rapid needs assessment<br />
indicated that Luzon, a highly populated island<br />
in the north <strong>of</strong> the country, inhabited by 56 per<br />
cent <strong>of</strong> the total population <strong>of</strong> the Philippines,<br />
had been the hardest hit. More than 2.2 million<br />
people were reported directly affected by the<br />
typhoon and approximately 736,000 people<br />
Four visions <strong>of</strong> urban risk<br />
were displaced (390,000 staying in 561 evacuation<br />
centres and 346,581 with host families).<br />
Most households lost their assets and livelihoods.<br />
Estimates indicate that more than 36,728 hectares<br />
<strong>of</strong> rice fields and 541 hectares <strong>of</strong> plantations<br />
<strong>of</strong> high-value commercial crops in central<br />
Luzon were damaged by the heavy rains and<br />
flooding caused by the storm. Tropical Storm Ketsana<br />
destroyed about US$ 33 million worth <strong>of</strong><br />
roads and bridges, with Metro Manila and central<br />
Luzon the worst hit, leading to major disruption<br />
<strong>of</strong> food supplies and spikes in food prices. �<br />
The definition <strong>of</strong> what constitutes a disaster, and whether small and everyday disaster<br />
events are included, is important in portraying an accurate vision <strong>of</strong> risk in cities. More<br />
problematic is trying to compare disaster risk across cities and across urban areas in<br />
different countries. For this, information is most readily available for large cities, and<br />
in fact large cities and mega-cities have been the subject <strong>of</strong> several efforts to understand<br />
global urban risk. The DesInventar database, which now includes several countries,<br />
<strong>of</strong>fers some detailed information that can contribute to a better understanding <strong>of</strong> risk<br />
at the urban district level, but the approach needs to be more widely adopted in order<br />
to provide a more sophisticated understanding <strong>of</strong> risk across cities.<br />
Vision one: Asset exposure to multi-hazards<br />
in large cities<br />
Munich Re Group’s NatCat database was used to prepare a natural hazard risk index<br />
for 50 <strong>of</strong> the world’s largest (over 2 million population) and most economically important<br />
cities (city GDP as a percentage <strong>of</strong> a country’s GDP). The index analysed 30
large cities in low- and middle-income nations and 20 large cities in high-income<br />
nations (see Figure 2.4). This index, which was intended as the basis for discussion,<br />
was the first international index for cities to take a multi-hazard perspective including<br />
earthquakes, windstorms, floods, volcanic eruption, bush fires and winter damage.<br />
It is composed <strong>of</strong> three variables: exposure to hazards; vulnerability <strong>of</strong> the built environment;<br />
and value <strong>of</strong> exposed property. Vulnerability is based on an estimation <strong>of</strong><br />
the vulnerability <strong>of</strong> the predominant form <strong>of</strong> residential construction to hazards, the<br />
standard <strong>of</strong> preparedness and safeguards including building regulations, urban planning<br />
in respect <strong>of</strong> specific hazards and flood protection, as well as building density.<br />
The values <strong>of</strong> exposed property are estimated using the average values per household<br />
and the GDP for commerce and industry.<br />
Figure 2.4<br />
Hazard risk index for large cities, as defined by Munich Re Group<br />
Tokyo<br />
San Francisco<br />
Los Angeles<br />
Osaka, Kobe, Kyoto<br />
Miami<br />
New York<br />
Hong Kong<br />
Manila, Quezon<br />
London<br />
Paris<br />
Chicago<br />
Mexico City<br />
Washington, Baltimore<br />
Seoul<br />
Beijing<br />
Ruhr area, Germany<br />
Shanghai<br />
Randstad, Netherlands<br />
Moscow<br />
Frankfurt<br />
Milan<br />
Bogota<br />
Dhaka<br />
Sydney<br />
Mumbai<br />
Bangkok<br />
Santiago de Chile<br />
Istanbul<br />
Medellin<br />
Teheran<br />
Bangalore<br />
Calcutta<br />
Buenos Aires<br />
Johannesburg<br />
Lima<br />
Athens<br />
Jakarta<br />
Singapore<br />
Karachi<br />
Sao Paulo<br />
Rio de Janeiro<br />
Cairo<br />
Berlin<br />
Delhi<br />
Madrid<br />
Alexandria<br />
Bagdad<br />
Lagos<br />
St Petersburg<br />
Abidjan<br />
0 100 200 300 400 500 600 700 800<br />
Total risk index<br />
Source: Munich Re Group (2004)<br />
<strong>World</strong> <strong>Disasters</strong> <strong>Report</strong> <strong>2010</strong> – Focus on urban risk<br />
39
CHAPTER 2<br />
40<br />
The index is most heavily influenced first <strong>of</strong> all by values <strong>of</strong> exposed assets and their<br />
degree <strong>of</strong> vulnerability. Figure 2.4 shows that Tokyo is, by far, the city at highest risk,<br />
followed by San Francisco. Of the 20 highest-risk cities in the index, 17 are in highincome<br />
countries. This makes sense given that the index is trying to gauge the risk for<br />
insurers and thus the value <strong>of</strong> exposed assets, which is greater in high-income countries<br />
and is an important factor in understanding the potential for economic losses in a<br />
disaster.<br />
The index shows that for large disasters, the economic costs are <strong>of</strong>ten much higher<br />
in high-income nations and much <strong>of</strong> this will be in urban areas, but this is not<br />
an indicator <strong>of</strong> how many people faced serious economic losses and did not have<br />
insurance. The index does not at all convey the reality that very large numbers <strong>of</strong><br />
low-income urban dwellers can lose their homes and most or all their assets from<br />
disasters; the total monetary value <strong>of</strong> this is small but the hardships on individuals<br />
and families are immense.<br />
Vision two: Flood exposure in port cities<br />
An index published by the Organisation for Economic Co-operation and Development<br />
ranks 136 port cities <strong>of</strong> over 1 million population with high exposure to one-in-100year,<br />
surge-induced flood events. It looks at the exposure <strong>of</strong> population and assets, in<br />
2005 and those predicted in 2070. Future predictions account for population growth,<br />
urbanization, ground subsidence and climatic changes.<br />
Population growth and investment in urban infrastructure are the most important<br />
drivers for increase in exposure to surge-induced floods. This is especially true in developing<br />
regions, which are expected to have large growth. Overall, without any increase<br />
in water levels, asset exposure could grow eight-fold. Climate changes, as predicted<br />
by the Fourth Assessment <strong>Report</strong> <strong>of</strong> the Intergovernmental Panel on Climate Change,<br />
including increased storm intensity and sea-level rise, also influence increased exposure.<br />
The influence <strong>of</strong> human-induced subsidence due to shallow groundwater extraction<br />
is especially important in deltaic cities that are rapidly developing.<br />
The index overwhelmingly shows that cities in Asia have the highest exposure to surgeinduced<br />
flooding now and in the future. Of the 20 cities with the highest population<br />
exposure in 2005, half are in low- and middle-income nations in Asia. In real numbers,<br />
out <strong>of</strong> the total 38.5 million people currently exposed, 65 per cent <strong>of</strong> them live in<br />
Asian cities. Figure 2.5 shows the top 20 world port cities with exposed populations<br />
in 2005. In the 2070s, the index predicts that 17 out <strong>of</strong> the 20 cities with the highest<br />
population exposure will be in present-day low- and middle-income countries and<br />
14 out <strong>of</strong> 20 <strong>of</strong> the cities will be in Asia (four in China and two in Bangladesh). Asia’s<br />
increasing dominance in terms <strong>of</strong> population and asset exposure is a result <strong>of</strong> increased<br />
urbanization and economic growth during the period, compared with other regions.
Figure 2.5<br />
Port cities with highest exposed population in 2005 to one-in-100-year,<br />
surge-induced flood events<br />
New Orleans<br />
1.12m<br />
Miami<br />
2m<br />
Rotterdam<br />
0.75m<br />
Abidjan<br />
0.51m<br />
Amsterdam<br />
0.83m<br />
Alexandria<br />
1.33m<br />
Mumbai<br />
2.78m<br />
New York<br />
1.54m Kolkata<br />
1.92m<br />
Bangkok<br />
0.90m<br />
Dhaka<br />
0.84m<br />
Guangzhou,<br />
Guangdong<br />
2.71m<br />
Shanghai<br />
2.35m<br />
Shenzen<br />
0.70m<br />
Haiphong<br />
0.79m<br />
Tianjin<br />
0.95m<br />
Ho Chi Minh City<br />
1.93m<br />
Nagoya<br />
0.69m<br />
<strong>World</strong> <strong>Disasters</strong> <strong>Report</strong> <strong>2010</strong> – Focus on urban risk<br />
Tokyo<br />
1.11m<br />
Osaka–Kobe<br />
1.37m<br />
As a result <strong>of</strong> projected growth and climatic change over the period, many smaller<br />
cities will also experience very rapid increases in population exposure, for example,<br />
Mogadishu in Somalia and Conakry in Guinea are expected to see population exposure<br />
increased by 12-fold (see Table 2.2). Of the 15 cities that will see the highest<br />
population exposure increase, six <strong>of</strong> them are in sub-Saharan Africa and eight are in<br />
Asia. One needs to view these findings with caution, however, because the projections<br />
for urban growth over the period may be totally distorted. Some countries, especially<br />
those in sub-Saharan Africa, may not have had a census for over 20 years. For example,<br />
Mogadishu is within a failed state, yet the index envisages it growing hugely.<br />
Nonetheless, while absolute exposure is low in some <strong>of</strong> these cities, a rapid increase in<br />
exposure to flooding can lead to increases in small-scale disasters. The potential for losses<br />
at the household level in these cities is especially acute in the fast-growing and low-lying<br />
informal settlements lacking adequate flood protection and drainage infrastructure.<br />
Furthermore, Dhaka, Chittagong and Khulna in Bangladesh, Yangon in Myanmar and<br />
Ningbo in China are all expected to experience high absolute exposure, meaning that<br />
these cities will also be at risk for large-scale flooding disasters, which could impact on<br />
large portions <strong>of</strong> the city, damaging infrastructure and economic activities.<br />
Source: Nicholls et al. (2008)<br />
41
Table 2.2 Port cities with population over 1 million estimated to have highest increased<br />
population exposure to surge-induced floods, 2005 to projected 2070<br />
City Country<br />
42<br />
Population<br />
2005 (000s)<br />
Population<br />
exposed 2005<br />
(000s)<br />
Population<br />
exposed 2070<br />
(000s)<br />
Increase<br />
Quingdao China 2,817 88 1,851 2,103%<br />
Luanda Angola 2,766 1 18 1,800%<br />
Dhaka Bangaldesh 12,430 844 11,135 1,319%<br />
Mogadishu Somalia 1,320 9 115 1,278%<br />
Conakry Guinea 1,425 41 496 1,210%<br />
Chittagong Bangladesh 4,114 255 2,866 1,124%<br />
Ningbo China 1,810 299 3,305 1,105%<br />
Dar-es-Salaam Tanzania 2,676 36 351 975%<br />
Yangon Myanmar 4,107 510 4,965 974%<br />
Karachi Pakistan 11,608 49 473 965%<br />
Douala Cameroon 1,761 11 101 918%<br />
Lagos Nigeria 10,886 357 3,229 904%<br />
Kulna Bangladesh 1,495 441 3,641 826%<br />
N’ampo Republic <strong>of</strong> Korea 1,102 22 181 823%<br />
Port-au-Prince Haiti 2,129 1 8 800%<br />
Source: Nicholls et al. (2008)<br />
Vision three: City-level data for multi-hazards<br />
The DesInventar database <strong>of</strong>fers a finer scale <strong>of</strong> data, with greater information at the<br />
local level, portraying a more detailed reality <strong>of</strong> risk facing cities and urban dwellers<br />
including small-scale events and everyday hazards.<br />
Using the city-level database from Cali, Colombia and plotting the events geographically,<br />
it is possible to see how the location <strong>of</strong> flooding events changes over time (see Figure 2.6).<br />
The details from Cali (analysed by Colombia’s Seismic Observatory <strong>of</strong> the South-West or<br />
OSSO) show how the pattern <strong>of</strong> flooding events is related to informal urban expansion<br />
in low-lying areas along the rivers, and to subsequent improvements in infrastructure<br />
over time. In Cali, risk patterns for small flood events expand concentrically from the<br />
centre <strong>of</strong> the city outwards to the periphery following the expansion <strong>of</strong> informal settlements.<br />
Additionally, small pockets <strong>of</strong> risk may be found in central areas ignored by<br />
formal urbanization, such as riverbanks and steep slopes.<br />
Case studies <strong>of</strong> cities in Argentina, Costa Rica and Mexico also support the findings<br />
from Cali, showing how extensive risk is generated through urban expansion and closely<br />
linked to increased run-<strong>of</strong>f from new urban development, chronic underinvestment in<br />
city-wide storm and surface drainage, location <strong>of</strong> informal settlements in flood-prone<br />
areas and inadequate water management for wider watersheds. It is likely that urban
expansion is driving risk in many Asian and African cities, too – and quite possibly even<br />
more strongly than in the above examples from Latin America, since a much lower proportion<br />
<strong>of</strong> the population in Asian and African cities have infrastructure and services.<br />
Figure 2.6<br />
Geographic distribution and frequency <strong>of</strong> registered<br />
flooding events between 1950 and 1990 in Cali, Colombia<br />
1950–59<br />
1970–79<br />
1960–69<br />
1980–89<br />
Source: OSSO (2008)<br />
Record<br />
Between<br />
2 and 5<br />
Between<br />
6 and 10<br />
Between<br />
11 and 20<br />
Between<br />
21 and 50<br />
Vision four: Settlement-scale data for fire disasters<br />
Another vision <strong>of</strong> urban risk is <strong>of</strong>fered by the Monitoring, Mapping and Analysis<br />
<strong>of</strong> Disaster Incidents in South Africa (MANDISA) database, which has records for<br />
18,504 fire events in Cape Town, South Africa from January 1995 to the end <strong>of</strong> 2004.<br />
The database, unique to Cape Town, provides an extremely detailed picture <strong>of</strong> fire risk,<br />
and shows us the massive extent <strong>of</strong> small-scale disaster events that are usually not part<br />
<strong>World</strong> <strong>Disasters</strong> <strong>Report</strong> <strong>2010</strong> – Focus on urban risk<br />
43
CHAPTER 2<br />
Box 2.2 Fires and fire risks in Imizamo Yethu, Hout Bay,<br />
South Africa<br />
A fire in February 2004 in Imizamo Yethu,<br />
an informal settlement in Hout Bay, destroyed<br />
1,200 homes and left some 5,000 people<br />
homeless. The settlement was created in<br />
1990 when forestry land was converted into<br />
an 18-hectare site for 429 housing plots with<br />
services. Imizamo Yethu means ‘through our<br />
44<br />
<strong>of</strong> urban risk calculations, yet have a devastating effect on households affected by the<br />
fire. It also <strong>of</strong>fers an unprecedented opportunity for a better understanding <strong>of</strong> a city’s<br />
risk pr<strong>of</strong>ile and is an extremely useful resource for defining priorities for risk reduction.<br />
Most <strong>of</strong> the fire incidents in the database are localized small and medium events, with<br />
over half destroying ten houses or less. Nonetheless, it is estimated that the fires affected<br />
40,000 people in informal settlements over the period in 8,554 events. The cost <strong>of</strong> these<br />
small events is also considerable, not only for the households which lose their house and<br />
belongings in the fires, but also for the emergency and social services <strong>of</strong> Cape Town. For<br />
example, in Joe Slovo, an informal settlement <strong>of</strong> Cape Town, it was estimated that the<br />
fires in 2000 cost 702,989 South African rand (worth US$ 91,000 in February <strong>2010</strong>).<br />
Two-thirds <strong>of</strong> these losses represented direct losses to the households and the rest were<br />
borne by fire services, social services and the South African <strong>Red</strong> <strong>Cross</strong> Society.<br />
Historically, devastating fires were common in cities – fires destroyed much <strong>of</strong> London<br />
in 1666, Chicago in 1871 and Thessaloniki in 1917, for example – but large fires in<br />
residential areas are no longer commonplace in cities in high-income nations. Fires figure<br />
prominently among the disasters that take place in informal settlements – although<br />
most may not get recorded, in part because there is no emergency fire service or, if there<br />
is one, it will not serve informal settlements or cannot access them. The reasons for<br />
fires are obvious: the use <strong>of</strong> candles and kerosene lamps for lighting (due to a lack <strong>of</strong><br />
electricity); the use <strong>of</strong> wood-, charcoal- or paraffin-fuelled cookers; overcrowded houses<br />
made <strong>of</strong> flammable materials; the high density <strong>of</strong> population within settlements; the<br />
lack <strong>of</strong> firebreaks; and, frequently, the lack <strong>of</strong> piped water supplies to help fight fires. It<br />
was found that fire incidents in Cape Town peak over the summer and holiday months<br />
<strong>of</strong> November, December and January due to hot, dry and windy summer conditions<br />
coupled with holiday season activity such as increased alcohol consumption and people<br />
travelling away from home. Fires also peak again in the winter month <strong>of</strong> August due to<br />
people bringing stoves inside to warm their houses. Box 2.2 gives the example <strong>of</strong> a fire<br />
disaster in an informal settlement in Hout Bay (close to Cape Town) and explains why<br />
serious fire disasters are commonplace in many informal settlements.<br />
collective struggle’. It is a mix <strong>of</strong> brick houses<br />
and shacks. It has piped water, mostly through<br />
public taps – but the supply is irregular and at<br />
the time <strong>of</strong> this fire, there had been no water<br />
in the piped system for the previous 24 hours.<br />
The fire brigade was called but only half an<br />
hour after the fire started (many people did not
know the phone number) and the fire engines<br />
could not access some areas because there<br />
were no roads or because people had put their<br />
possessions in the road.<br />
The settlement has had other serious fires<br />
– for instance, before the February 2004 fires,<br />
there had been fires which destroyed between<br />
40 and 90 buildings in 1995, 1997, 2001<br />
and 2003. In 2008, about 23 houses were<br />
burnt down in February, 60 in August, 200 in<br />
late November and 200 in early December.<br />
The vulnerability gap: How trends in disasters fit<br />
within a broader picture <strong>of</strong> risk and vulnerability<br />
One thing these different visions <strong>of</strong> urban risk have in common is that risk we are<br />
experiencing in cities both today and in the future are produced over time, through<br />
the economic processes <strong>of</strong> urban development and various decisions taken at different<br />
times by the authorities and the citizens. What we see as risk in cities, such as growth in<br />
informal or illegal settlements, inadequate infrastructure or services, building on sites<br />
at risk from high winds, floods or landslides, or building with flammable materials, is<br />
actually caused by a ‘vulnerability gap’. On one side <strong>of</strong> the gap is the lack <strong>of</strong> knowledge<br />
or financial capacity and sometimes willingness <strong>of</strong> urban authorities to reduce vulnerabilities.<br />
Priorities in cities for economic growth, urban expansion and the fact that the<br />
well-<strong>of</strong>f in cities may not be overly vulnerable to disasters thwart efforts to reduce risk.<br />
On the other side <strong>of</strong> the vulnerability gap are the poor urban communities, who do<br />
what they can to reduce their vulnerability, but ultimately are limited in their financial<br />
and political capability to reduce the risk they face.<br />
Box 2.3 shows how in Istanbul, Turkey this vulnerability gap has emerged over time to<br />
produce a city highly vulnerable to earthquakes and flood hazards. As in Istanbul, this<br />
vulnerability gap in cities can eventually be narrowed as governments understand better<br />
the risks and develop the capability to take actions to reduce vulnerability in ways<br />
that are accountable to everyone in the city.<br />
Box 2.3 The vulnerability gap in Istanbul, Turkey<br />
Istanbul, the largest city and centre <strong>of</strong> production<br />
in Turkey, is highly vulnerable to earthquakes,<br />
landslides and flood hazards. This<br />
The initial causes <strong>of</strong> these fires are <strong>of</strong>ten<br />
not clear but the widespread use <strong>of</strong> candles for<br />
lighting and open fires or dangerous paraffin<br />
stoves for cooking and heating is clearly part<br />
<strong>of</strong> the reason. The close physical proximity <strong>of</strong><br />
buildings and the many that are made <strong>of</strong> flammable<br />
materials help explain why fires spread<br />
from house to house – although many <strong>of</strong> the<br />
more severe fires here and in other informal<br />
settlements in Cape Town are also associated<br />
with high winds. �<br />
vulnerability is partly a factor <strong>of</strong> Istanbul’s<br />
location, lying just north <strong>of</strong> the seismically active<br />
Anatolian fault line, but it is the precarious and<br />
<strong>World</strong> <strong>Disasters</strong> <strong>Report</strong> <strong>2010</strong> – Focus on urban risk<br />
45
fast-growing urban environment created over<br />
recent years due to the absence <strong>of</strong> strategic<br />
planning and informal development that has<br />
resulted in elevated risk. In 1950, Istanbul<br />
had a population <strong>of</strong> 1.16 million; today it is<br />
home to 12.5 million people and produces<br />
one-quarter <strong>of</strong> the country’s GDP. Since the<br />
1999 Izmit earthquake, which killed more than<br />
17,000 people and impacted partly on the<br />
eastern edges <strong>of</strong> Istanbul, the city has been well<br />
aware that another devastating earthquake will<br />
happen and the next time possibly with even<br />
greater impact and closer to Istanbul.<br />
In addition to earthquakes, flooding is also<br />
becoming a problem. Throughout the city, industries,<br />
residences and even major transport<br />
arteries are located on riverbeds and riverbanks.<br />
Small-scale flood events are a regular<br />
occurrence, and local news channels periodically<br />
report that one or two people have died<br />
in flash floods. In September 2009, the heaviest<br />
rainfall recorded in Istanbul in 80 years caused<br />
flash flooding leading to the deaths <strong>of</strong> at least<br />
40 people and to US$ 550 million in damages.<br />
The bodies <strong>of</strong> seven women were discovered<br />
in Bagcilar, a working-class suburb. They had<br />
drowned in a minibus that was taking them to<br />
jobs at a textile factory.<br />
The vulnerability <strong>of</strong> Istanbul to multiple hazards<br />
today, in <strong>2010</strong>, is a result <strong>of</strong> decisions<br />
and actions about urban development made<br />
over the last 60 years. Looking at the example<br />
<strong>of</strong> housing production in Istanbul shows us how<br />
a vulnerability gap is produced over time.<br />
Starting from the first waves <strong>of</strong> immigration<br />
into Istanbul in the 1940s and continuing<br />
through the 1980s, housing was produced<br />
through informal building, called gecekondu<br />
(meaning ‘built overnight’). Different versions<br />
<strong>of</strong> amnesty laws throughout the years (1949,<br />
1953, 1963, 1966, 1976, 1983) effectively<br />
gave many occupiers the ‘right to use’ <strong>of</strong> the<br />
46<br />
land, and municipalities provided services to<br />
these areas and undertook upgrading <strong>of</strong> public<br />
infrastructure. In 1984, a law was passed that<br />
allowed the building <strong>of</strong> gecekondu areas up<br />
to four storeys, which dramatically transformed<br />
the landscape <strong>of</strong> the city from single-storey<br />
garden plots built by families themselves to<br />
multi-storey apartment buildings built by smallscale<br />
developers. Today, it is estimated that<br />
70 per cent <strong>of</strong> the housing stock is either illegal<br />
or legalized and much housing has been built<br />
with no supervision for earthquake building<br />
codes. If a 7.5 magnitude earthquake (similar<br />
to the one in 1999) were to occur, it is estimated<br />
that <strong>of</strong> approximately 800,000 buildings<br />
in Istanbul, 25 per cent would have moderate<br />
damage, 10 per cent would have extensive<br />
damage and 5 per cent could be expected to<br />
collapse completely.<br />
In the past ten years, since the great earthquake<br />
<strong>of</strong> 1999, the government has undertaken<br />
several initiatives to try and reduce the<br />
earthquake risk in Istanbul, including urban<br />
master plans for earthquake risk reduction,<br />
legislative changes regarding building supervision,<br />
mandatory earthquake insurance and<br />
mandates for municipalities to undertake urban<br />
regeneration projects to replace vulnerable<br />
buildings. Thus, on one side <strong>of</strong> the vulnerability<br />
gap, the political will and the expertise for<br />
risk reduction are now present in Istanbul, yet<br />
the capacity for implementation is still lacking<br />
as these government initiatives have had little<br />
impact on the ground thus far.<br />
The other side <strong>of</strong> the gap – people’s ability<br />
to reduce risk – is limited by many factors,<br />
including their perception <strong>of</strong> risk, their knowledge<br />
<strong>of</strong> earthquake-safe building techniques,<br />
complicated ownership structures and financial<br />
constraints. For example, to make existing<br />
buildings safer, authorities have proposed<br />
retro fitting to meet earthquake safety standards.
However, the incentive for owners to retr<strong>of</strong>it is<br />
very low for an earthquake that may or may<br />
not happen over the next 50 years. The cost<br />
for retr<strong>of</strong>itting is high and amounts to little financial<br />
return in terms <strong>of</strong> increased property<br />
value or rental value; furthermore, multiple<br />
owners must agree and the building must be<br />
vacated for several months.<br />
The Greater Municipality <strong>of</strong> Istanbul<br />
has also started to earmark gecekondu<br />
areas for rehabilitation, under the Greater<br />
Municipalities Law (Law No. 5216, 2004),<br />
which gives authority for the “vacating and<br />
demolishing <strong>of</strong> dangerous buildings and all<br />
Conclusion<br />
other ‘non-conforming’ structures”. This has<br />
led to forced evictions and massive threats<br />
<strong>of</strong> eviction across the city, where gecekondu<br />
areas will be bulldozed and rebuilt by the<br />
Mass Housing Adminstration, leading to the<br />
likely displacement <strong>of</strong> poor urban dwellers.<br />
While relocation into new earthquake-safe<br />
areas is planned, the new houses – even though<br />
subsidized – are too far away from jobs for<br />
most people to afford, so people are left homeless.<br />
Thus rehabilitation may physically reduce<br />
the vulnerability <strong>of</strong> the built environment <strong>of</strong> the<br />
city, yet it is dramatically increasing people’s<br />
level <strong>of</strong> poverty and exclusion. �<br />
Urban vulnerability is generated differently at the scales <strong>of</strong> the individual, household,<br />
community and city. City-scale investments, for example, in flood drainage may succeed<br />
in protecting core functions but can also generate vulnerability for the poor. In<br />
Delhi, a lack <strong>of</strong> foresight has led to the construction <strong>of</strong> storm drains during a housing<br />
crisis and, not surprisingly, the colonization <strong>of</strong> drains by landless informal settlers. The<br />
drains now generate flood risk among the poor while helping protect the wider city<br />
from flooding. Identifying and reducing vulnerability is no easy task in an era <strong>of</strong> rapid<br />
urbanization.<br />
Historically, the focus at city level has always been on physical over social infrastructure.<br />
This is beginning to change as city authorities recognize the importance <strong>of</strong> social<br />
safety nets (including support for the elderly and homeless), access to good-quality<br />
health and education, and implementation <strong>of</strong> building standards.<br />
The commoditization <strong>of</strong> urban life means that, in contrast to more rural contexts,<br />
money is required to meet even the most basic <strong>of</strong> needs – water, food and shelter.<br />
This restricts the ability <strong>of</strong> the vulnerable poor to accumulate assets and to protect<br />
themselves from hazard. It also makes it difficult to recover from disaster, magnifying<br />
impact where the loss <strong>of</strong> accumulated assets, such as a dwelling, can set back household<br />
development irretrievably.<br />
However, looking at the trends for the future, we see that increasing urbanization also<br />
brings the potential to reduce the losses from disasters in the long term even though it<br />
may increase disaster losses in the short term. Rapid urbanization, <strong>of</strong> the kind that is<br />
happening in parts <strong>of</strong> Asia and Africa, will, in the short run, most likely increase losses<br />
<strong>World</strong> <strong>Disasters</strong> <strong>Report</strong> <strong>2010</strong> – Focus on urban risk<br />
47
This informally<br />
built settlement in<br />
Karadolap, Istanbul, is<br />
slated to be bulldozed<br />
and replaced with<br />
formally built houses.<br />
In part, the reason<br />
for this is an effort to<br />
reduce earthquake<br />
risk, but this will<br />
displace long-time<br />
residents <strong>of</strong> the area,<br />
as most <strong>of</strong> them will<br />
not be able to afford<br />
to purchase the new<br />
houses in this area.<br />
© Cassidy Johnson<br />
48<br />
from disasters. This is partly because urbanization is happening at such a fast rate that<br />
governments are not able to keep pace in managing disaster risk. Floods, earthquakes<br />
and the impacts <strong>of</strong> climate change are likely to cause more deaths and damages in<br />
rapidly growing cities with high exposure to natural and public health hazards. Industrial<br />
growth will bring with it more technological hazards. However, once urban areas<br />
become more consolidated, and likely more wealthy, it will be possible for governments<br />
to implement risk reduction measures to protect people. This is assuming that<br />
governments will want to act in good faith and in a way that is accountable to all urban<br />
residents, wealthy and poor.<br />
The availability <strong>of</strong> information on urban disasters is still quite poor. At present, it is not<br />
possible to understand the number <strong>of</strong> urban disasters, the extent <strong>of</strong> disaster impacts on<br />
urban areas or how trends in urban disasters differentiate between global regions. The<br />
problem <strong>of</strong> climate change and how it will affect cities shows some promise for better<br />
regional data on urban risk. However, the pr<strong>of</strong>ile <strong>of</strong> hazards that are studied under<br />
climate change are limited and do not include the full range that would encompass a<br />
disaster’s perspective.
The focus on assets, especially higher-level indicators like economic or insured losses,<br />
as a major factor in determining disaster risk is providing a deceptive view <strong>of</strong> how disasters<br />
are actually impacting on people, especially poor households in cities. If we are<br />
to look at risk at the household level and affecting the urban poor, the types <strong>of</strong> events<br />
that would seriously impact on people’s lives and their ability to recover such as assets<br />
lost, days <strong>of</strong> work and school missed, increased expenditure on food and prevalence <strong>of</strong><br />
sickness, we would get a different risk picture with poor urban dwellers at highest risk.<br />
More detailed understanding <strong>of</strong> urban risks is needed at two levels. First <strong>of</strong> all, at the<br />
scale <strong>of</strong> the individual city, where more data are needed such as that provided by the<br />
MANDISA database. Second, a disaggregated view <strong>of</strong> risk should also be pursued at<br />
the urban district level as per the DesInventar model, to improve analysis <strong>of</strong> small,<br />
everyday disasters in order to better understand more subtle but important variations<br />
in risk which, in turn, will enable more appropriate disaster risk reduction measures<br />
to be put in place around <strong>of</strong>ten ‘unseen’ or unrecorded events. This can be invaluable<br />
for urban programming and provide a full perspective on the extent <strong>of</strong> hazards<br />
faced by the urban poor or those living in informal settlements. Third, more precise<br />
reporting is needed at the national and international levels to understand how largescale<br />
disasters impact on urban areas. For example, more precise information in the<br />
CRED database about the location <strong>of</strong> the event, including which urban areas the<br />
event impacted.<br />
Chapter 2 was written by Cassidy Johnson, Development Planning Unit, Bartlett School<br />
<strong>of</strong> the Built Environment, University College London with contributions from David Satterthwaite,<br />
Senior Fellow, <strong>International</strong> Institute for the Environment and Development,<br />
London, and Mark Pelling, Reader in Human Geography, King’s College London. She also<br />
wrote Box 2.3. Box 2.1 was written by I. Sanogo and N. Ifeanyi, <strong>World</strong> Food Programme<br />
Food Security Analysis Service, Rome. Box 2.2 was written by David Satterthwaite.<br />
<strong>World</strong> <strong>Disasters</strong> <strong>Report</strong> <strong>2010</strong> – Focus on urban risk<br />
49
CHAPTER 2<br />
50<br />
Sources and further information<br />
Advisory Group on Forced Evictions. <strong>Report</strong> to the Executive Director <strong>of</strong> the UN-Habitat<br />
Programme. Mission to Istanbul, Republic <strong>of</strong> Turkey, June 8 to 11th 2009.<br />
Bull-Kamanga, L. et al. ‘From everyday hazard to disasters: the accumulation <strong>of</strong> risk in<br />
urban areas’ in Environment and Urbanization, Vol. 15, No. 1, pp. 193–204, 2003.<br />
Cowan, B. Alleviation <strong>of</strong> Poverty through the Provision <strong>of</strong> Local Energy Services;<br />
Identification and Demonstration <strong>of</strong> Selected Energy Best Practices for Low-income<br />
Urban Communities in South Africa. Cape Town: Energy Research Centre, 2008.<br />
Centre for Research on the Epidemiology <strong>of</strong> <strong>Disasters</strong> (CRED). Emergency Events<br />
Database (EM-DAT). Louvain, Belgium: CRED, Catholic University <strong>of</strong> Louvain.<br />
Available online: www.emdat.be.<br />
DesInventar. Disaster Management Information System. Available online:<br />
www. desinventar.net.<br />
Disaster Mitigation for Sustainable Livelihoods Programme (DiMP). Evaluation <strong>of</strong><br />
the Fire Mitigation Programme in Joe Slovo Informal Settlement, Cape Town. <strong>Report</strong><br />
prepared for the Ukuvuka Operation Fire Stop Programme. Cape Town: University<br />
<strong>of</strong> Cape Town, 2002.<br />
Erdik, M. and Eser, D. ‘Earthquake Risk and its Mitigation in Istanbul’ in Natural<br />
Hazards, Vol. 44, pp. 181–197, 2008.<br />
Green, R. ‘Informal Settlements and Natural Hazard Vulnerability in Rapid Growth<br />
Cities’ in Bosher, L. (ed.), Hazards and the Built Environment: Attaining Built-in<br />
Resilience. Oxford: Taylor and Francis, 2008.<br />
Huq, S. and Alam, M. ‘Flood Management and Vulnerability <strong>of</strong> Dhaka City’ in<br />
Kreimer, A. et al. (eds.), Building Safer Cities: The Future <strong>of</strong> Disaster Risk. Disaster<br />
Risk Management Series No. 3. Washington DC: The <strong>World</strong> Bank, 2003.<br />
Intergovernmental Panel on Climate Change (IPCC). ‘Climate Change 2007: Impacts,<br />
Adaptation and Vulnerability. Contribution <strong>of</strong> Working Group II to the Fourth<br />
Assessment <strong>Report</strong> <strong>of</strong> the IPCC’ in Parry, M.L. et al. (eds.) Fourth Assessment <strong>Report</strong><br />
<strong>of</strong> the IPCC. Cambridge: Cambridge University Press, 2007.<br />
MacGregor, H.N. et al. Hazard Pr<strong>of</strong>ile and Vulnerability Assessment for Informal<br />
Settlements: An Imizamo Yethu Case Study with special reference to the Experience <strong>of</strong><br />
Children. Cape Town: DiMP, University <strong>of</strong> Cape Town, 2005.<br />
Munich Re Group. NatCat database. Available online: www.munichre.com/en/<br />
reinsurance/business/non-life/georisks/natcatservice/default.aspx.<br />
Munich Re Group. Mega cities – Mega risks: Trends and Challenges for Insurance and<br />
Risk Management. Munich: Munich Re, 2004.
Munich Re Group. Topics Annual Review: Natural Catastrophes 2002. Munich: Munich<br />
Re, 2002. Available online: www.munichre.co.jp/public/PDF/Topics_2002_<br />
NaturalHazardIndex.pdf.<br />
Nicholls, R.J. et al. ‘Ranking Port Cities with High Exposure and Vulnerability to Climate<br />
Extremes: Exposure Estimates’ in Environment Working Papers, No. 1. Paris: OECD,<br />
2008. Available online: www.olis.oecd.org/olis/2007doc.nsf/linkto/env-wkp(2007)1.<br />
Organisation for Economic Co-operation and Development (OECD). OECD Territorial<br />
Reviews, Istanbul, Turkey. Paris: OECD, 2008.<br />
Observatorio Sismológico del Sur-Occidente (OSSO). ‘Urbanización, Marginalización<br />
y Prefiguración de Desastres en Ciudades “Medianas” de Países en Desarrollo Cali,<br />
Colombia’. Background paper for Global Assessment <strong>Report</strong> on Disaster Risk <strong>Red</strong>uction,<br />
May 2009. Geneva: UNISDR, 2008.<br />
Pharoah, R. ‘Fire risk in informal settlements in Cape Town, South Africa’ in Pelling,<br />
M and Wisner, B. (eds.), Disaster Risk <strong>Red</strong>uction: Cases from Urban Africa. London:<br />
Earthscan Publications, 2009.<br />
Potts, D. ‘The slowing <strong>of</strong> sub-Saharan Africa’s urbanization: evidence and implications for<br />
urban livelihoods’ in Environment and Urbanization, Vol. 21, No. 2, pp. 253–259, 2009.<br />
Rashid, S.F. ‘The Urban Poor in Dhaka City: Their Struggles and Coping Strategies<br />
during the Floods <strong>of</strong> 1998’ in <strong>Disasters</strong>, Vol. 24, No. 3, pp. 240–253, 2000.<br />
Sanogo, I. and Ifeanyi, N. Livelihood and Food Security in Urban Emergencies. A Synthesis <strong>of</strong><br />
Selected WFP Practices. Draft document. Rome: WFP Food Security Analysis Service, 2009.<br />
Satterthwaite, D. ‘The Transition to a Predominantly Urban <strong>World</strong> and its Underpinnings’<br />
in Human Settlements Discussion Paper Series Urban Change – 4. London: <strong>International</strong><br />
Institute for Environment and Development, 2007.<br />
United Nations Human Settlements Programme (UN-Habitat). State <strong>of</strong> the <strong>World</strong>’s<br />
Cities <strong>2010</strong>/2011 – Bridging The Urban Divide. Geneva, 2009.<br />
United Nations <strong>International</strong> Strategy for Disaster <strong>Red</strong>uction (UNISDR). Global<br />
Assessment <strong>Report</strong> on Disaster Risk <strong>Red</strong>uction. Geneva: UNISDR, 2009.<br />
United Nations Population Division. <strong>World</strong> Urbanization Prospects: the 2005 Revision.<br />
CD-ROM Edition data in digital form (POP/DB/WUP/Rev.2005). New York:<br />
UN Population Division, Department <strong>of</strong> Economic and Social Affairs, 2005.<br />
<strong>World</strong> Food Programme (WFP) and UN Children’s Fund (UNICEF). Bangladesh Household<br />
Food Security and Nutrition Assessment 2009 <strong>Report</strong>. Dhaka: WFP and UNICEF, 2009.<br />
Wisner, B. and Pelling, M. ‘African Cities <strong>of</strong> Hope and Risk’ in Pelling, M and Wisner,<br />
B. (eds.), Disaster Risk <strong>Red</strong>uction: Cases from Urban Africa. London: Earthscan<br />
Publications, 2009.<br />
<strong>World</strong> <strong>Disasters</strong> <strong>Report</strong> <strong>2010</strong> – Focus on urban risk<br />
51
CHAPTER 3<br />
52
Starting over:<br />
Community rights and<br />
post-disaster response<br />
When a large disaster occurs, the initial responses from governments and from better-<strong>of</strong>f<br />
households unaffected by the disaster are usually admirable. But rarely does this carry<br />
over to help those most affected with their two most pressing priorities: reconstructing<br />
their homes and livelihoods. While most national and international disaster relief agencies<br />
have become increasingly effective in the much-needed rapid response to disasters,<br />
they are less effective in developing longer-term responses that allow the survivors to<br />
rebuild their homes and livelihoods. They focus on what they can do for the victims,<br />
not what needs to be done by them. After a disaster, the needs for medical treatment,<br />
healthcare, food and water, and <strong>of</strong>ten temporary accommodation are obvious, as is the<br />
need for specialist help to find and help free many <strong>of</strong> those trapped in the wreckage. This<br />
is what both national and international disaster relief agencies are set up to do. But the<br />
stage after this is more difficult particularly where all well-located land sites are valuable<br />
and where most <strong>of</strong> those who are most impacted live or lived in informal settlements.<br />
The disaster does not remove what are <strong>of</strong>ten antagonistic relationships between local<br />
governments and the urban poor and their informal settlements. Disaster relief agencies<br />
can provide relief but they cannot address the root cause <strong>of</strong> why so much <strong>of</strong> the<br />
city’s population was so heavily affected, i.e., because they lived in illegal settlements<br />
with poor-quality homes on dangerous sites to which the government had failed to<br />
provide infrastructure and services. Disaster relief agencies cannot get safer land sites<br />
for housing where those who lost their homes in informal settlements can build –<br />
such sites are too valuable and those in government and higher-income groups would<br />
not support this. If the people who lost their homes are allowed to occupy public<br />
spaces after the disaster (parks and school buildings, for instance), the local government<br />
usually wants them to move on after a certain period <strong>of</strong> time in order to return<br />
the spaces to their designated uses. Local governments may want to prevent people<br />
living in informal settlements from returning there and rebuilding. Indeed, disasters<br />
can provide possibilities for well-connected developers and businesses to acquire sites<br />
that were previously occupied by informal settlements as was evident in many coastal<br />
communities devastated by the 2004 Indian Ocean tsunami. The obvious and essential<br />
principle <strong>of</strong> allowing those most affected to be at the centre <strong>of</strong> decisions about<br />
where, and how, to rebuild is ignored. <strong>Disasters</strong> do not <strong>of</strong>ten change attitudes within<br />
government agencies in regard to the needs and rights <strong>of</strong> the inhabitants <strong>of</strong> informal<br />
settlements. However, as some examples given later in this chapter show, disasters can<br />
provide the opportunity to catalyse a change in relations with longer-term benefits for<br />
the urban poor.<br />
<strong>World</strong> <strong>Disasters</strong> <strong>Report</strong> <strong>2010</strong> – Focus on urban risk<br />
Photo opposite page:<br />
Terrain Golf, a sports<br />
club in Pétionville,<br />
Haiti, was turned<br />
into a refugee camp<br />
almost overnight after<br />
the 12 January quake.<br />
It is managed by the<br />
J/P Haitian Relief<br />
Organization, set up<br />
by the actor Sean<br />
Penn.<br />
© José Manuel Jimenez /<br />
IFRC<br />
53
CHAPTER 3<br />
54<br />
Even if urban poor groups have some assets undamaged by the disaster, these can be<br />
quickly eroded by having to pay for consumption needs and through loss <strong>of</strong> livelihoods<br />
or sources <strong>of</strong> income, so all the inequalities and difficulties that the urban poor faced<br />
before the disaster remain to constrain the post-disaster response. Having a home in an<br />
informal settlement usually means lacking land tenure and any <strong>of</strong>ficial documentation<br />
<strong>of</strong> ‘ownership’ <strong>of</strong> the land and house. It also <strong>of</strong>ten means living in a settlement with no<br />
infrastructure, such as piped water supplies, sewers, drains and paved roads, because local<br />
governments refuse to provide these to ‘illegal’ settlements. It is this lack <strong>of</strong> infrastructure<br />
that greatly increases the impact <strong>of</strong> the disaster event. Most informal settlements have<br />
little or no public provision for healthcare or emergency services, which further limits<br />
needed responses to disasters. After a disaster, the lack <strong>of</strong> tenure and documentation,<br />
combined with an absence <strong>of</strong> links to local government, compounds the constraints on<br />
response. Disaster relief and support for rebuilding <strong>of</strong>ten depend on pro<strong>of</strong> <strong>of</strong> residence<br />
and identity cards, which also explains why many do not move to safer sites when warned<br />
about an approaching storm or flood as they fear they will not be allowed to return home.<br />
The Asian Coalition for Housing Rights has noted that, unless disaster aid quickly learns<br />
to work with the untitled, the unregistered, the unlisted and the undocumented, it can<br />
support and even reinforce the inequalities that existed prior to the disaster.<br />
Local governments may allow people whose homes were destroyed to settle in temporary<br />
camps but would never sanction these as places where they can stay and rebuild<br />
permanent homes. They <strong>of</strong>ten do not permit them to return to their former settlement<br />
but they are also unwilling to provide them with alternative land sites (or if they do,<br />
these are peripheral sites with little or no infrastructure, far from their previous homes,<br />
social networks and places where they work). There may be good reasons for not wanting<br />
them to return to their former sites because these are so much at risk (from floods<br />
or cyclones, for instance) and post-disaster reconstruction could provide an opportunity<br />
to allow those affected to get safer sites on which to rebuild. However, they almost<br />
never get appropriate new sites and they are hardly ever consulted about the appropriateness<br />
<strong>of</strong> new locations. Fine words about ‘rebuilding a new, safe city’ and ‘decentralizing’<br />
to avoid the previous high concentration <strong>of</strong> informal settlements usually become<br />
distant camps and reconstruction sites where no one wants to live.<br />
Alfredo Stein, commenting on the reconstruction plan in Haiti to move people away<br />
from the capital and drawing on his work in post-Hurricane Mitch reconstruction,<br />
said, “You are going to be constructing ghettos that are far away from where people<br />
will need to restore their economic lives.” The estate agent’s mantra ‘location, location,<br />
location’ is actually even more relevant for low-income groups. Stein, an expert<br />
on urban planning based at the Global Urban Research Centre at the University <strong>of</strong><br />
Manchester, notes that planners must assume that people will return to their homesites<br />
and work closely with them to rebuild. If their former site is destroyed or too<br />
dangerous for them to rebuild on, then they must be included in real discussions about<br />
what would be appropriate relocation sites given government capacity to act rapidly
on this. However, it is complicated to get them new land sites that they can afford and<br />
that meet their needs as regards livelihoods. Host communities, for instance, may not<br />
want them in their neighbourhoods, or the legal and institutional obstacles may be<br />
insuperable.<br />
Despite these difficulties, there is now a rich experience <strong>of</strong> community-driven responses<br />
to disasters in urban areas upon which this chapter draws as it examines the experiences<br />
<strong>of</strong> community groups following a disaster. The complexity <strong>of</strong> needs and constraints<br />
created by the institutional framework in urban areas means that successful engagement<br />
with the state is critical in securing a pro-poor response, and this chapter explains<br />
how this can be achieved.<br />
Experiences with community-driven responses<br />
to disasters<br />
Drawing on the experience <strong>of</strong> many communities and local non-governmental organizations<br />
(NGOs) after disasters, one <strong>of</strong> the most important responses is to support<br />
the people affected to meet, network and <strong>of</strong>ten share their grief and, in their own<br />
time, begin to participate in creating solutions. This means involving local people<br />
from the start in any discussion <strong>of</strong> rebuilding and in managing the shift from relief to<br />
reconstruction. If people are living in temporary camps, they should also be engaged<br />
in camp organization and management. Well-organized, representative, community<br />
organizations are also valuable allies for agencies supporting reconstruction as they can<br />
provide much <strong>of</strong> the information base for rebuilding, contribute to the rebuilding and<br />
supervise local builders and contractors (all <strong>of</strong> which are time consuming and difficult<br />
for staff from donor agencies or international NGOs).<br />
Post-disaster responses have to strengthen and support the survivors’ own organizations<br />
and keep women at the centre. This is <strong>of</strong>ten difficult, however, as more aggressive<br />
and well-connected groups frequently dominate priorities and actions. People are<br />
affected in different ways and may have different priorities, and they see other affected<br />
groups as competitors in seeking funds from external organizations.<br />
Visits and exchanges between community organizations have proved important in<br />
many instances to allow survivor groups to learn from other community-driven experiences<br />
and also to show what they are doing or planning. In Banda Aceh, Indonesia,<br />
after the 2004 tsunami, a network <strong>of</strong> community organizations <strong>of</strong> survivors was<br />
needed to cope with what was called the second tsunami – the surge <strong>of</strong> unplanned,<br />
unregulated, uncoordinated international aid that poured into the city, <strong>of</strong>ten bypassing<br />
community structures. With international aid under pressure to spend and to build,<br />
many buildings were put up, but when construction was finished and aid agencies<br />
withdrew, communities were left with no source <strong>of</strong> income, no social cohesion and<br />
little support for the future.<br />
<strong>World</strong> <strong>Disasters</strong> <strong>Report</strong> <strong>2010</strong> – Focus on urban risk<br />
55
56<br />
After the earthquake in the Marathwada region <strong>of</strong> Maharashtra, India in 1993, two<br />
Indian NGOs with long experience in working with grass-roots associations organized<br />
meetings for affected communities in the two most-impacted districts to share<br />
their loss, grieve and also share their experiences <strong>of</strong> how they had saved many people.<br />
This was the first time that women were included in such meetings. It also allowed<br />
them to discuss what they needed and how they could become involved in rebuilding.<br />
A local NGO working with the 20,000 households displaced by a mud volcano disaster<br />
in Sidoarjo, Indonesia in 2006, noted: “Perhaps the most important support from<br />
external donors could have been on-the-ground, long-term support for those affected<br />
to develop their capacities, to agree on and put forward their solutions and then implement<br />
them. It seems that changes in donor structures and staff have actually moved<br />
many donors further away from such an approach.”<br />
Box 3.1 describes the experiences <strong>of</strong> the Philippines Homeless People’s <strong>Federation</strong> in<br />
community-driven responses to five disasters between 2000 and 2008. The federation<br />
is a national network <strong>of</strong> 161 urban poor community associations and savings groups<br />
with more than 70,000 individual members from 18 cities and 15 municipalities.<br />
Members promote community savings in order to build their own financial capacities<br />
and to promote community development and social cohesion.<br />
Box 3.1 The Philippines Homeless People’s <strong>Federation</strong>’s role<br />
in community-driven disaster response<br />
The Philippines’ location within the circum-<br />
Pacific seismic belt means that the country is<br />
regularly affected by earthquakes, volcanic<br />
eruptions, typhoons, storm surges, landslides,<br />
floods and droughts. The link between vulnerability,<br />
and disaster and poverty is strong –<br />
many low-income groups live in high-risk sites<br />
and have poor-quality housing. They also have<br />
less protective infrastructure and fewer resources<br />
to call on after being impacted by disasters.<br />
The Philippines Homeless People’s<br />
<strong>Federation</strong> (HPF) is a national network <strong>of</strong> urban<br />
poor community associations and savings<br />
groups that are engaged in many initiatives<br />
to secure land tenure, build or improve homes<br />
and increase economic opportunity, working<br />
wherever possible in partnership with local<br />
governments. The five disasters listed in the<br />
table below encouraged the HPF to develop<br />
its own policies and practices first for disaster<br />
response, and later for disaster risk reduction.<br />
The HPF was already active in Payatas<br />
when the trash slide happened and had been<br />
implementing a mix <strong>of</strong> community-based development<br />
programmes (savings and loan<br />
schemes, secure tenure initiatives) and welfare<br />
programmes (for the elderly, health, childcare<br />
and rehabilitation <strong>of</strong> children with disabilities)<br />
with support from the Vincentian Missionaries<br />
Social Development Foundation Inc. However,<br />
it recognized its lack <strong>of</strong> knowledge and skills<br />
in how to address disasters.<br />
The HPF’s response to these disasters was<br />
to work with the survivors, helping them to<br />
organize and to influence reconstruction. For<br />
instance, in Barangay Guinsaugon, after the<br />
landslide, they worked with survivors, helping<br />
them to organize (including a survey covering
all those in the evacuation centre), supporting<br />
them in developing savings schemes, organizing<br />
exchange visits to see other communitybased<br />
housing schemes and organizing the<br />
construction <strong>of</strong> 103 temporary housing units<br />
within four months <strong>of</strong> the disaster. The HPF’s<br />
immediate response to the Mount Mayor mudflow<br />
and floods was the dispatch <strong>of</strong> a team<br />
to establish links with all the affected communities<br />
and to help them set up community<br />
organizations. It also supported surveys, organized<br />
exchanges and promoted savings.<br />
These efforts focused on three municipalities<br />
where there were several communities on particularly<br />
dangerous sites, supportive local governments<br />
and communities interested in the<br />
HPF and an absence <strong>of</strong> sustained relief from<br />
aid agencies. Surveys were organized that<br />
The disasters Year Details<br />
Trash slides at the Payatas solid waste dump<br />
in Quezon City (metro Manila)<br />
included families in high-risk areas that had<br />
not been affected by the mudslide and families<br />
living in homes at risk <strong>of</strong> eviction along<br />
the railway tracks. The organized communities<br />
were able to select and acquire resettlement<br />
sites. The importance <strong>of</strong> this experience<br />
“is the pervading belief and commitment <strong>of</strong><br />
affected families and communities to act and<br />
save to recover and to prepare for and evade<br />
future disasters. The communities showed this<br />
through their volunteering efforts and adoption<br />
<strong>of</strong> the savings programme, collectively<br />
saving close to P500,000 [US$ 11,000] in<br />
less than a year. Their willingness to provide<br />
counterparts in terms <strong>of</strong> volunteer work and<br />
savings prompted the federation to support<br />
their land acquisition initiatives,” said Jocelyn<br />
Cantoria, HPF’s regional coordinator. �<br />
2000 Heavy rains from typhoons caused a 15-metre (50ft) slope in the<br />
dump to collapse, burying hundreds <strong>of</strong> homes; 288 people were<br />
killed and several hundred families displaced. Subsequent flash<br />
floods affected the homes and livelihoods <strong>of</strong> many more people.<br />
Landslide in Barangay Guinsaugon 2006 The whole barangay (district) was buried and another 80 barangays<br />
affected. A total <strong>of</strong> 154 deaths were recorded, 968 people reported<br />
missing, 3,742 displaced and 18,862 affected.<br />
Mount Mayor mudflow and floods 2006 Typhoons triggered huge floods, mudslides and avalanches. In<br />
the Bicol region alone, at least 208 people died and another<br />
261 were reported missing. These settlements were recovering<br />
from a previous typhoon.<br />
Fire in the settlement <strong>of</strong> the lower Tipolo<br />
Homeowners Association in Mandaue<br />
2007 246 structures were destroyed leaving 913 people homeless.<br />
Flash flood in Iloilo 2008 In the city <strong>of</strong> Iloilo, 152 <strong>of</strong> its 180 barangays were affected by<br />
heavy rain and flooding. Up to 500 people were killed, 261,335<br />
affected. Many houses were washed away and many households<br />
lost their documentation.<br />
The work <strong>of</strong> the Philippines HPF in responding to disasters identified some constraints<br />
on community-driven responses that are common in most urban areas. These include:<br />
�� The difficulties faced by the affected population to produce documents required<br />
by the government because these were either lost or destroyed by the disaster<br />
�� The common response <strong>of</strong> those affected to wait for others, especially government<br />
agencies, to do things and not to take the lead themselves<br />
<strong>World</strong> <strong>Disasters</strong> <strong>Report</strong> <strong>2010</strong> – Focus on urban risk<br />
57
CHAPTER 3<br />
58<br />
�� The response limitations <strong>of</strong> local governments to provide land needed for temporary<br />
accommodation or permanent relocation and the stringent land-use subdivi-<br />
sion and conversion regulations that inhibit this<br />
�� The lack <strong>of</strong> funds to help with relocation (funding is <strong>of</strong>ten only available for<br />
immediate relief and not for resolving the more fundamental problems)<br />
�� The difficulty in getting <strong>of</strong>ficial permission for necessary actions that <strong>of</strong>ten<br />
require the agreement <strong>of</strong> many different bodies<br />
�� The high price <strong>of</strong> building materials for reconstruction (especially for disasters<br />
with widespread impacts, such as the floods in Iloilo).<br />
Community organizations take the lead<br />
Problems always arise after a disaster in urban areas that need representative community<br />
organizations to manage them, such as who gets the temporary accommodation, who<br />
gets priority for new housing, how to design the ‘reblocking’ (reshaping <strong>of</strong> plot boundaries<br />
to improve access) that is acceptable to both tenants and ‘owners’. In 2007, CARE’s<br />
Kabul Area Shelter and Settlement Project, funded by the United States Agency for<br />
<strong>International</strong> Development’s Office <strong>of</strong> Foreign Disaster Assistance, began with a landusage<br />
survey and the creation <strong>of</strong> community councils to select beneficiaries in clusters<br />
rather than individually. CARE also signed a memorandum <strong>of</strong> understanding with the<br />
Kabul municipality, which linked housing to broader issues <strong>of</strong> land tenure, occupancy<br />
rights and housing security, and partnered with the Afghan Development Association<br />
and the Sanayee Development Organization, two local NGOs. CARE’s report on the<br />
project noted: “Essentially, a successful shelter intervention must include strategies for<br />
good governance that focus on increasing people’s understanding <strong>of</strong> their rights and<br />
responsibilities, as well as enhance the ability <strong>of</strong> authorities to listen to the needs <strong>of</strong> the<br />
people, that encourage all to find solutions to problems that affect everyone.”<br />
Shack/Slum Dwellers <strong>International</strong> (SDI) is a confederation <strong>of</strong> country-level organizations<br />
<strong>of</strong> the urban poor from 28 countries throughout Africa, Asia and Latin America.<br />
According to the SDI affiliates that have responded to disasters, certain factors have<br />
facilitated effective responses. The first is the existence <strong>of</strong> savings groups in the affected<br />
settlements, which helped to provide immediate support for those impacted by the<br />
disasters. The second is the existence <strong>of</strong> community organizations which were able to<br />
help with immediate relief and support the social cohesion needed to take action to<br />
resolve longer-term issues such as rebuilding or relocation (see Box 3.2).<br />
Community-leaders from SDI affiliates <strong>of</strong>ten visit disaster sites and impacted communities<br />
and encourage and support the formation <strong>of</strong> local representative organizations<br />
and savings groups. They also bring their experience with savings management,<br />
organizational development, community surveys and house modelling, developing<br />
life-size models <strong>of</strong> houses to see which design and which materials produce the best<br />
low-cost housing. They support community pr<strong>of</strong>iling and surveys in order to mobilize
those affected, help them get organized, gather necessary data about the disaster site<br />
and support them in showing their capabilities to local government. Where relocation<br />
is necessary, they help highlight the importance <strong>of</strong> being able to get land on suitable,<br />
well-located sites where access to income-earning opportunities is as important<br />
as the site itself. The effectiveness <strong>of</strong> this is much enhanced if there are supportive<br />
local governments and national agencies. Obtaining, when necessary, land or title to<br />
Box 3.2 Inclusive equitable cities<br />
Shack/Slum Dwellers <strong>International</strong> seeks to<br />
build local movements at a neighbourhood<br />
level, primarily around land and basic services.<br />
The network grew from the seven founding<br />
members in 1996 (Cambodia, India, Namibia,<br />
Nepal, South Africa, Thailand and Zimbabwe)<br />
to 16 core affiliates in 2006 (Brazil, Ghana,<br />
Kenya, Malawi, Philippines, Sri Lanka, Tanzania,<br />
Uganda, Zambia) with links to ten more<br />
countries by <strong>2010</strong> (Angola, Argentina, Bolivia,<br />
Egypt, Indonesia, Mozambique, Nigeria,<br />
Pakistan, Sierra Leone and Swaziland). SDI’s<br />
methodology encourages local communities<br />
to design housing solutions to address their<br />
needs, refining these solutions through practice.<br />
It also seeks, in general, to be non-confrontational<br />
in its relations with local authorities<br />
with the understanding that city-wide solutions<br />
to the problems <strong>of</strong> insecure tenure and lack <strong>of</strong><br />
access to services need to be in place.<br />
SDI affiliates have achieved significant success<br />
with secure tenure in India, Kenya, Malawi,<br />
Namibia, Philippines, South Africa, Thailand<br />
and Zimbabwe. Local groups have negotiated<br />
for state subsidies to secure land and basic services<br />
for over 150,000 families. Their experience<br />
highlights the importance <strong>of</strong> strong local<br />
organizations if community solutions are to be<br />
allowed to prevail and if communities are to have<br />
the capacities they need to take up new challenges<br />
once they move to permanent sites and<br />
new homes. In terms <strong>of</strong> disaster preparedness,<br />
there is an increasing awareness in SDI communities<br />
about the work required with local authorities<br />
and local NGOs to minimize disaster-related risk.<br />
The interest <strong>of</strong> tenants and those who claim<br />
to ‘own’ land may differ considerably. The exceptions<br />
are notable because they are rare.<br />
SDI’s Kenyan affiliate, the Kenyan People’s<br />
Homeless <strong>Federation</strong>, supported by local<br />
NGOs, worked with local savings schemes in<br />
Huruma, one <strong>of</strong> Nairobi’s many informal settlements,<br />
to regularize the settlement. A community<br />
survey had identified 1,105 tenants, 1,002<br />
structure owners (i.e., owners <strong>of</strong> the house but<br />
not legal owners <strong>of</strong> the land) and 202 resident<br />
landowners. The residents were unanimous<br />
in seeing security <strong>of</strong> their homes and land as<br />
their biggest need. Hence, when the government<br />
said that they could have legal tenure if<br />
the residents could agree on a land-sharing arrangement,<br />
they negotiated to divide the land.<br />
The outcome was inclusive <strong>of</strong> all groups and<br />
<strong>of</strong>fered the owners sufficient land for them to<br />
accept a compromise.<br />
Communities that come together to address<br />
their need for tenure, infrastructure and ser vices<br />
are more likely to be prepared in the event<br />
<strong>of</strong> a disaster. As the risks <strong>of</strong> climate change<br />
are increasingly recognized, more community<br />
groups want to educate themselves about the<br />
risks attached to their location both to prepare<br />
themselves and to negotiate for appropriate assistance<br />
from the authorities. �<br />
<strong>World</strong> <strong>Disasters</strong> <strong>Report</strong> <strong>2010</strong> – Focus on urban risk<br />
59
CHAPTER 3it<br />
60<br />
(which <strong>of</strong>ten requires high-level political support for a more rapid response from<br />
bureaucracies) and permission to begin rebuilding are particularly urgent. In some disasters,<br />
technical support for affected populations in developing responses (for example,<br />
forming home-owner associations, drafting memoranda <strong>of</strong> understanding with local<br />
governments, designing houses and site layout, and raising funds) proved important.<br />
Building the information base for effective<br />
responses<br />
One obvious first step in reconstruction is surveys <strong>of</strong> settlements and impacted households<br />
in order to assess the damages and to develop a costed plan for rebuilding, but<br />
a key issue is who should be engaged in this process? Is this to be done by external<br />
experts who report to the <strong>of</strong>ficial organizations ‘in charge’ or might it be better done<br />
by involving community organizations and volunteers? In a growing number <strong>of</strong> cases,<br />
community organizations formed by survivors have taken the lead role in these surveys<br />
and, in doing so, have reinforced their opportunities to influence responses. This draws<br />
on the experiences <strong>of</strong> federations <strong>of</strong> slum/shack dwellers in informal settlements in<br />
cities in Asia and Africa which have undertaken careful, detailed surveys and mapping<br />
<strong>of</strong> their settlements to provide the information base for upgrading and for negotiating<br />
with local governments for support.<br />
This documentation, covering every household and providing detailed maps<br />
undertaken by the survivors, helps not only to provide necessary documents for<br />
reconstruction but it also fosters the strong community organization needed to<br />
cope with inappropriate government policies and with the commercial forces<br />
which <strong>of</strong>ten seek to take advantage <strong>of</strong> the disaster. For instance, the surveys help<br />
provide households with documentation <strong>of</strong> the land site they occupy or occupied<br />
prior to the disaster. Community-managed surveys also help build the confidence<br />
and capacity <strong>of</strong> the inhabitants. This is real disaster prevention because it provides<br />
the basis for low-income communities to avoid eviction and to negotiate the right<br />
to rebuild and to get tenure, and thus avoids the catastrophic impact <strong>of</strong> relocation<br />
to inappropriate locations. The surveys and maps also help to ensure that<br />
the government takes the local organizations seriously. An engagement with local<br />
organizations that have information about the population to be assisted changes<br />
the nature <strong>of</strong> the relationship and the potential capacity <strong>of</strong> the local community is<br />
better appreciated.<br />
Starting repairs and reconstruction<br />
A second obvious step is to start with repairs and reconstruction. And, again,<br />
who should undertake this? In Pakistan, after the devastating earthquake in 2005,<br />
there was a legitimate desire within government to make sure that the rebuilding<br />
produced buildings and infrastructure that were more resilient to likely future
disaster events. Governments <strong>of</strong>ten try to ban rebuilding until there is a detailed<br />
assessment <strong>of</strong> damages and until it can set guidelines and standards for rebuilding<br />
– but this can very <strong>of</strong>ten delay essential responses. For those with the least assets,<br />
who need to restart livelihoods and rebuild homes, all delays add to their difficulties.<br />
Community-driven reconstruction can draw on people’s own knowledge and<br />
skills. There are, for instance, <strong>of</strong>ten many skilled artisans and experienced builders<br />
among the affected population who can play an important role in the reconstruction<br />
if given appropriate technical support to ensure they build disaster reliance<br />
into new structures.<br />
It is important for the network <strong>of</strong> affected communities to develop their relations with<br />
local governments and with pr<strong>of</strong>essionals who are part <strong>of</strong> the reconstruction effort.<br />
They need to develop a common understanding among pr<strong>of</strong>essionals, aid organizations,<br />
government departments and other community groups about what should be<br />
done and then use this common understanding to devise ways to deal with problems in<br />
a more collective and coordinated way. This is necessary to avoid a lack <strong>of</strong> coordination<br />
among different organizations and competition among community groups for funds<br />
or recognition. Again, community exchanges are key mechanisms by which everyone<br />
can learn – and slum dwellers’ federations have long learned the value <strong>of</strong> bringing government<br />
agency staff and other pr<strong>of</strong>essionals into these community exchanges. This<br />
also allows successful partnerships between government agencies, pr<strong>of</strong>essionals and<br />
community organizations to be highlighted so, for instance, government staff worried<br />
about allowing more flexible standards for building and infrastructure can visit a site<br />
where local government has successfully followed such an approach.<br />
In urban areas, community-based initiatives to build or improve housing and to install<br />
infrastructure and services have shown their effectiveness in many places but they are<br />
limited by their impossibility to put in place large infrastructure, such as water mains<br />
to supply communities with piped water systems or the trunk sewers and storm drains<br />
into which community-developed systems can feed. Clearing household waste from<br />
streets, gutters, drains and open spaces can be organized by communities but it needs<br />
a larger system to collect and remove it. So community-driven strategies have to forge<br />
linkages and develop partnerships with local governments and this is where a real partnership<br />
between community-managed ‘little pipes’ and government-provided ‘big<br />
pipes’ can achieve risk reduction at scale.<br />
Getting land<br />
It is much easier to rebuild in existing settlements as no new land site has to be acquired<br />
and most existing urban settlements have some infrastructure or at least have trunk<br />
infrastructure (roads, water mains, sewers, drains, electricity cables) close by. But wherever<br />
land is valuable – which means most urban contexts – it is <strong>of</strong>ten more difficult<br />
for affected communities either to get back the land on which they lived prior to the<br />
<strong>World</strong> <strong>Disasters</strong> <strong>Report</strong> <strong>2010</strong> – Focus on urban risk<br />
61
CHAPTER 3<br />
62<br />
disaster or to get safer sites on which to rebuild. ‘Safe’ sites are <strong>of</strong> no use to low-income<br />
households if they are far from former homes and from income-earning opportunities.<br />
Whenever a large-scale disaster hits a city, there is always a temptation to envisage a<br />
reconstruction process that avoids the sites most impacted, especially the informal settlements.<br />
Governments <strong>of</strong>ten respond to disasters by passing new land-use regulations<br />
that prevent rebuilding in many <strong>of</strong> the most affected areas.<br />
One common community-driven response is for community organizations to demonstrate<br />
to governments and, where relevant, international agencies their competence<br />
and capacity in rebuilding. One way to do this is by reoccupying the old sites<br />
and building permanent homes. This is what took place in Gujarat, India, after the<br />
2001 earthquake when the government tried to stop people moving back to ‘unsafe’<br />
places. But when the people who moved back showed evidence <strong>of</strong> their investment<br />
in permanent houses, the government had little choice but to agree with them staying<br />
there. In the immediate aftermath <strong>of</strong> the 2004 tsunami in Banda Aceh, survivors<br />
from 25 coastal settlements moved back in defiance <strong>of</strong> the government relocation<br />
programme. When they proved they were able to rebuild and to establish a plan<br />
to create protective ecological buffers between their settlements and the sea, the<br />
government supported their actions. In the responses to the disasters in Payatas<br />
described in Box 3.1, it was possible to get land for temporary or permanent accommodation<br />
on suitable sites.<br />
The need for ‘flexible’ money for affected<br />
households and communities<br />
There is a need for national and local disaster funds that are able to respond rapidly<br />
and have the capacity to provide support right down to affected individuals and households.<br />
These funds should support both immediate responses and the development <strong>of</strong><br />
longer-term solutions in ways that serve each affected community. Cash support for<br />
affected households has proved effective in many instances and can also stop the erosion<br />
<strong>of</strong> household assets, which is particularly serious for low-income groups.<br />
As noted earlier, key priorities – apart from guaranteeing basic needs (shelter, food,<br />
clean water, sanitation) and avoiding household asset depletion – are supporting livelihoods<br />
and rebuilding. This <strong>of</strong>ten needs administrative streamlining to get faster<br />
responses from bureaucracies in terms <strong>of</strong> approving community-driven plans and helping<br />
to resource them. This is not easy, especially for external funders who respond to<br />
the emergency with neither contacts nor knowledge <strong>of</strong> the areas in which they are<br />
suddenly working. It is difficult for outsiders to know how to support livelihoods and<br />
those most in need. This is more easily done if community organizations, such as local<br />
savings groups, can help. In many nations, national federations <strong>of</strong> slum/shack dwellers<br />
have set up their own national and local funds through which external support for their<br />
work can be channelled.
In urban areas, rebuilding homes and restoring livelihoods are usually closely linked,<br />
as the home provides a safe place for families, access for income earners and, <strong>of</strong>ten,<br />
a site for home-based enterprises. An evaluation <strong>of</strong> responses to the Gujarat earthquake<br />
noted: “People constantly emphasized the need to restore livelihoods rather than<br />
receive relief and expressed some frustration that outsiders did not listen to them on<br />
this point.”<br />
Community-driven initiatives for disaster risk<br />
reduction<br />
Most disasters, including the five listed in Box 3.1, could have been anticipated and<br />
much death and destruction avoided, had surveys <strong>of</strong> settlements in high-risk sites been<br />
undertaken and follow-up action carried out to address problems the surveys highlighted.<br />
Interviews or discussions with those living in informal settlements that flood<br />
point to a range <strong>of</strong> measures that they take in the home to reduce the impact. Obvious<br />
modifications can be made to houses to make them more resistant to disaster. These<br />
include having high or raised cupboards or other types <strong>of</strong> furniture that people can sit<br />
on in case <strong>of</strong> floods, fitting high shelves on which goods can be stored (including food<br />
and water) and keeping all electric wiring and plugs close to the ro<strong>of</strong> (if the house is<br />
connected to a source <strong>of</strong> electricity). In Indore, India, many households had heavy<br />
<strong>World</strong> <strong>Disasters</strong> <strong>Report</strong> <strong>2010</strong> – Focus on urban risk<br />
The Indian state <strong>of</strong><br />
Andhra Pradesh was<br />
hit by one-in-100-year<br />
floods in 2009. After<br />
such a disaster, people<br />
need help not only to<br />
access food, shelter<br />
and clean water, but<br />
also to rebuild homes<br />
and livelihoods.<br />
© Rob Few/IFRC<br />
63
64<br />
metal beds that did not wash away. Stores <strong>of</strong> food and water are essential in places<br />
prone to flooding. Brazilian President Lula da Silva has described how the homes he<br />
lived in as a child were <strong>of</strong>ten flooded. “When our house flooded, I sometimes woke<br />
up at midnight to find my feet in water, cockroaches and rats fighting over space, and<br />
various objects floating around the living room, so I had to get up in the middle <strong>of</strong><br />
the night,” he said. “Our biggest concern was preventing the furniture from getting<br />
ruined. Not that we had much to get ruined… Every time it rained, we used to nail<br />
another piece <strong>of</strong> wood across the doorframe, and dump another truckload <strong>of</strong> earth to<br />
reinforce the barricade. But every time it rained the water level rose further. And the<br />
authorities never did anything.” Houses can be protected against flooding to some<br />
degree by building on stilts, creating drainage ditches nearby, erecting barriers to stop<br />
water coming in (these include temporary measures such as sandbags) or having outlets<br />
so that flood waters flow out.<br />
Community-driven ‘upgrading’ <strong>of</strong> informal settlements is an important aspect <strong>of</strong> disaster<br />
risk reduction, as it improves the quality <strong>of</strong> housing and puts in place the infrastructure<br />
and services that reduce disaster risk. Upgrading slums has become one <strong>of</strong><br />
the most common and effective ways to improve housing conditions in cities in Latin<br />
America and Asia. In nations such as Argentina, Brazil and Thailand, upgrading programmes<br />
have reached a significant proportion <strong>of</strong> the urban population that lives or<br />
used to live in informal settlements. At their best, upgrading programmes on sites at<br />
risk <strong>of</strong> flooding make space for necessary storm drains but also rehouse people who<br />
have to move to make way for infrastructure within the same community.<br />
Box 3.3 Housing, land and property rights<br />
and post-disaster shelter programming<br />
Problems concerning housing, land and property<br />
(HLP) rights and other issues frequently<br />
arise following natural disaster. These are <strong>of</strong>ten<br />
instrumental in determining the extent to<br />
which post-disaster shelter programming succeeds<br />
or fails. HLP issues can determine the<br />
extent to which the rights <strong>of</strong> those affected<br />
by disaster are respected, protected and, ultimately,<br />
fulfilled and enforced. If left without<br />
suitable policy (or sometimes legal) interventions,<br />
such HLP problems can create obstacles<br />
for the implementation <strong>of</strong> shelter programmes.<br />
What works well in a highly urbanized context<br />
may prove entirely ill suited for post-disaster<br />
shelter needs in a rural area <strong>of</strong> a developing<br />
country. Likewise, relocation <strong>of</strong> disaster-affected<br />
communities may be necessary and desired<br />
by certain groups in some contexts, but may<br />
be wholly inappropriate or illegal in many others.<br />
There is a growing realization that HLP<br />
rights perspectives need to be woven into the<br />
international community’s shelter programming<br />
activities. Though HLP rights issues may play<br />
themselves out in different ways, it is possible<br />
to identify the most likely types <strong>of</strong> HLP challenges<br />
to emerge following disaster. These include:<br />
HLP rights issues in informal, customary<br />
or extralegal settlements.<br />
Dwellers residing within informal, customary<br />
or extralegal settlements (those without explicit
ownership or other formalized/legal rights to<br />
reside at a given location) <strong>of</strong>ten bear the brunt<br />
<strong>of</strong> natural disasters and resultant displacement<br />
and damage to property. However, on the<br />
whole, post-disaster HLP policy tends to provide<br />
clearly preferential treatment to formal property<br />
owners, <strong>of</strong>ten to the detriment <strong>of</strong> the rights <strong>of</strong><br />
those within the informal or customary sectors,<br />
thus raising questions <strong>of</strong> equity and rights.<br />
Structural landlessness and homelessness.<br />
Even though pre-disaster landless<br />
and homeless families constitute one <strong>of</strong> the<br />
most vulnerable groups affected by disaster,<br />
these families are frequently excluded or at best<br />
marginalized in relief and recovery processes.<br />
This group can include informal occupants or<br />
squatters on public or private land who are<br />
unable to return to their homes, such as people<br />
living in a coastal buffer zone in post-tsunami<br />
Sri Lanka. They can also be pre-disaster tenants<br />
who were not allowed to return to their<br />
former homes and lands or households headed<br />
by women who were not permitted to purchase<br />
property or not on the same terms as men. In<br />
post-tsunami Aceh, more than 15,000 land<br />
parcels (7,000 hectares) were irretrievably<br />
damaged, with resettlement on public land as<br />
the only available option. Following the 2005<br />
Pakistan earthquake, the failure <strong>of</strong> the authorities<br />
to provide housing assistance to the landless<br />
was identified as a major reason for longterm<br />
displacement and the prolonged existence<br />
<strong>of</strong> temporary shelter settlements.<br />
Land grabbing and illegal/unfair<br />
land acquisition. The unjust acquisition <strong>of</strong><br />
land following a disaster can have a detrimental<br />
impact both on the people whose land is literally<br />
stolen and on humanitarian agencies engaged<br />
in shelter activities. Land grabbing can<br />
take a variety <strong>of</strong> forms ranging from outright<br />
violence (by both public and private actors),<br />
to carefully orchestrated legislative measures<br />
designed to achieve outcomes in the aftermath<br />
<strong>of</strong> disaster that would have been politically infeasible<br />
had the disaster itself not taken place.<br />
Following Hurricane Katrina in New Orleans,<br />
public <strong>of</strong>ficials attempted to undertake a range<br />
<strong>of</strong> planning and zoning measures during the<br />
reconstruction process, which had the actual<br />
effect <strong>of</strong> significantly changing land use and<br />
land and housing ownership patterns – in other<br />
words, a land grab.<br />
Restitution or resettlement? According<br />
to relevant international standards, such<br />
as the United Nations Principles on Housing<br />
and Property Restitution for Refugees and<br />
Displaced Persons (2005), there is, when<br />
conditions so permit, a presumption <strong>of</strong> restitution<br />
and an emerging right to return to one’s<br />
original home for displaced people following<br />
both disaster and conflict. In many instances,<br />
however, restitution can be blocked due to HLP<br />
disputes over a land plot or dwelling, real or<br />
attempted land grabs, the secondary occupation<br />
<strong>of</strong> homes and lands and various other common<br />
post-disaster situations. In post-tsunami<br />
Thailand, HLP restitution rights for communities<br />
living on land informally were secured through<br />
the resolution <strong>of</strong> many HLP disputes by a special<br />
land sub-commission, but in many cases,<br />
the technically extralegal or informal tenure<br />
status held by disaster victims can greatly affect<br />
their rights in post-disaster settings.<br />
Proving who has which HLP rights.<br />
Following the Pisco earthquake in Peru, shelter<br />
programming was affected due to the difficulties<br />
in clarifying the existence <strong>of</strong> property titles<br />
for the land potential beneficiaries were occupying.<br />
The international community developed<br />
procedures to select reconstruction beneficiaries,<br />
which procedures rely on vulnerability criteria<br />
(i.e., the elderly, disabled people, children<br />
and others) and on criteria related to the tenure<br />
<strong>of</strong> the land and properties built on it.<br />
<strong>World</strong> <strong>Disasters</strong> <strong>Report</strong> <strong>2010</strong> – Focus on urban risk<br />
65
Inequitable treatment <strong>of</strong> owners<br />
and non-owners. Although housing, land<br />
or property owners (many <strong>of</strong> whom may have<br />
forms <strong>of</strong> HLP insurance protection) and tenants<br />
and other non-owners are equally affected by<br />
disaster, frequently the latter groups face inequitable<br />
treatment within the HLP sector. Following<br />
the Pisco earthquake, 78 per cent <strong>of</strong> the population<br />
that had title received grants for reconstruction,<br />
while tenants and informal dwellers<br />
generally did not. The same distinctions were<br />
made after the 1995 Kobe earthquake in<br />
Japan, where owners were invariably entitled<br />
to return to their pre-quake homes, whereas tenants<br />
were <strong>of</strong>ten forced to find new housing as<br />
their former neighbourhoods were transformed<br />
into new and more expensive areas. After<br />
Hurricane Katrina, relatively small amounts <strong>of</strong><br />
financial assistance were provided to rebuild<br />
rental units compared to the considerable sums<br />
provided to owner-occupiers to rebuild.<br />
HLP disputes and secondary occupation.<br />
HLP disputes generated by the<br />
secondary occupation <strong>of</strong> homes and lands<br />
are commonplace following disasters. Such<br />
disputes can occur between many different<br />
parties, such as two poor families struggling<br />
over access to a single piece <strong>of</strong> land. More<br />
ominously, disputes between poor communities<br />
and private sector interests, which seek to<br />
control the disputed land for development purposes,<br />
can seriously undermine broader postdisaster<br />
recovery efforts and cause forced and<br />
arbitrary evictions.<br />
Insecure tenure. Inadequate or insecure<br />
HLP tenure can significantly worsen the HLP<br />
prospects <strong>of</strong> disaster-affected populations, as<br />
well as creating considerable challenges for<br />
shelter providers in the aftermath <strong>of</strong> disasters.<br />
Tenure insecurity – or the reduced degree <strong>of</strong><br />
protection against eviction and other threats –<br />
can arise through a wide range <strong>of</strong> pre-existing<br />
CHAPTER 3<br />
66<br />
or post-disaster circumstances. These can relate<br />
to structural weaknesses <strong>of</strong> the HLP rights registration<br />
and record-keeping systems in countries<br />
affected by disaster, a lack <strong>of</strong> clarity between<br />
customary and formal HLP rights frameworks,<br />
systemic bias against non-owners (resulting<br />
in far lesser tenure protection) and the loss,<br />
damage or manipulation <strong>of</strong> land registers and<br />
other methods <strong>of</strong> recording HLP rights. Insecure<br />
tenure can make people reluctant to flee from<br />
their homes and lands when disaster strikes for<br />
fear <strong>of</strong> losing access to them after the event.<br />
In the specific context <strong>of</strong> HLP rights and<br />
disaster, the ‘do no harm’ principle should<br />
mean that humanitarian actors only support<br />
local or national HLP laws and policies that<br />
are consistent with internationally protected<br />
HLP rights. <strong>International</strong> agencies should build<br />
these perspectives into their overall activities<br />
to ensure the broad promotion and protection<br />
<strong>of</strong> HLP rights. It should also mean that humanitarian<br />
institutions consciously ensure that they<br />
are not complicit in any approaches to HLP<br />
issues pursued by national and local governments<br />
that are contrary to international rules<br />
and regulations. In effect, such an approach<br />
would prioritize rights over expediency, strive<br />
to remove the pro-ownership bias that still dominates<br />
many shelter efforts and develop new<br />
internal and external mechanisms to continually<br />
strengthen HLP rights issues in the context<br />
<strong>of</strong> shelter programming. Five key principles are<br />
worthy <strong>of</strong> consideration in this respect:<br />
�� Expand beneficiary participation in HLP<br />
processes and decision-making<br />
�� Define ‘building back better’ as ‘lands for<br />
the landless and homes for the homeless’<br />
�� Treat owners, tenants and informal dwellers<br />
equally by emphasizing security <strong>of</strong> tenure<br />
�� Oppose openly arbitrariness and disasterdriven<br />
land grabs<br />
�� Prioritize restitution first. �
However, the scope <strong>of</strong> the upgrading varies from minor improvements such as communal<br />
water taps, paved roads and street lighting, which do little to reduce disaster<br />
risk, to comprehensive improvements to each house and good-quality infrastructure<br />
(piped water and sewers to each house) and services (including schools and healthcare<br />
centres). Upgrading should also include the provision <strong>of</strong> legal tenure <strong>of</strong> the land and<br />
house to the occupants but this is <strong>of</strong>ten avoided due to costs and legal complications,<br />
which may also involve compensation for the landowner.<br />
The concept <strong>of</strong> upgrading implies an acceptance by governments that the settlement<br />
to be upgraded is legitimate and that the inhabitants have a right to live there and the<br />
right to the infrastructure and services that are so central to risk reduction. But the<br />
extent to which it engages the inhabitants and their community organizations in its<br />
design and implementation varies a lot. One <strong>of</strong> the most interesting upgrading initiatives<br />
is that <strong>of</strong> the Thai government because it supports community-driven upgrading,<br />
and scale is achieved by the very large number <strong>of</strong> local initiatives that it supports.<br />
Managed by the Community Organizations Development Institute (CODI), this<br />
channels government funds in the form <strong>of</strong> infrastructure subsidies and housing loans<br />
direct to savings groups formed by low-income inhabitants in informal settlements.<br />
It is these savings groups that plan and carry out improvements to their housing or<br />
develop new housing, and work with local governments or utilities to improve infrastructure<br />
and services. From 2003 to early 2008, within the Baan Mankong or secure<br />
housing programme, CODI approved 512 projects in over 200 urban centres covering<br />
53,976 households, and it plans a considerable expansion <strong>of</strong> the programme within the<br />
next few years. Overall, CODI (and the organization out <strong>of</strong> which it developed, the<br />
Urban Community Development Office) has provided loans and grants to community<br />
organizations that reached 2.4 million households between 1992 and 2007.<br />
This initiative has particular significance in three aspects: the scale; the extent <strong>of</strong><br />
community-involvement; and the extent to which it seeks to institutionalize community-driven<br />
solutions within local governments. Its funding is drawn almost<br />
entirely from domestic resources – a combination <strong>of</strong> contributions from national<br />
and local government and from households and communities. CODI also provides<br />
support to networks <strong>of</strong> community organizations formed by the urban poor, to allow<br />
them to work with municipal authorities, other local actors and national agencies on<br />
city-wide upgrading programmes. It also demonstrates how to regularize illegal land<br />
tenure. Those living in illegal settlements can get legal land tenure by a variety <strong>of</strong><br />
means, including purchasing the land from the landowner supported by a government<br />
loan, negotiating a lease, agreeing to move to another location provided by the<br />
government agency on whose land they are squatting, or agreeing to move to part <strong>of</strong><br />
the site they are occupying in return for tenure (land sharing). CODI also provides<br />
loans to community organizations to lend to their members to help build or improve<br />
their homes.<br />
<strong>World</strong> <strong>Disasters</strong> <strong>Report</strong> <strong>2010</strong> – Focus on urban risk<br />
67
68<br />
Most <strong>of</strong> the experiences described above are from nations where national federations <strong>of</strong><br />
slum or shack dwellers have developed and have actively sought to work with local governments.<br />
The kinds <strong>of</strong> post-disaster interventions described in this chapter, including<br />
the capacity to reduce or avoid extreme events, should be a key part <strong>of</strong> urban poverty<br />
reduction strategies. Often, however, they are not seen as the responsibility <strong>of</strong> agencies<br />
that work on poverty reduction. Meanwhile, guidelines for urban poverty reduction,<br />
such as the Poverty <strong>Red</strong>uction Strategy Papers fostered by the <strong>World</strong> Bank and the<br />
<strong>International</strong> Monetary Fund, <strong>of</strong>ten give little or no attention to disaster risk reduction<br />
in urban areas – although in fact, this is part <strong>of</strong> a larger problem: that these institutions<br />
do not give much attention to urban areas at all.<br />
This chapter, including Box 3.1, was written by David Satterthwaite, Senior Fellow, <strong>International</strong><br />
Institute for Environment and Development (IIED), with contributions from<br />
Sheela Patel, Director, Society for the Promotion <strong>of</strong> Area Resource Centers, Somsook Boonyabancha,<br />
Secretary General, Asian Coalition for Housing Rights, Thomas Kerr, Asian<br />
Coalition for Housing Rights, and Arif Hasan, Visiting Fellow, IIED. Box 3.2 was written<br />
by Diana Mitlin, Senior Research Associate, Human Settlements Programme, IIED. Box<br />
3.3 was contributed by Scott Leckie, Director, Displacement Solutions.<br />
CHAPTER 3Conclusion
Sources and further information<br />
Adelekan, I.O. ‘Vulnerability <strong>of</strong> poor urban coastal communities to flooding in Lagos,<br />
Nigeria’ in Environment and Urbanization, Vol. 22, No. 2, <strong>2010</strong>.<br />
Arputham, J. ‘Developing new approaches for people-centred development’ in<br />
Environment and Urbanization, Vol. 20, No. 2, pp. 319–337, 2008.<br />
Asian Coalition for Housing Rights (ACHR). Tsunami Update. Bangkok: ACHR,<br />
2006.<br />
ACHR. Tsunami; How Asia’s Precarious Coastal Settlements are Coping after the Tsunami.<br />
Housing by People in Asia 16. Bangkok: ACHR, 2005.<br />
Boonyabancha, S. ‘Land for housing the poor by the poor: experiences from the Baan<br />
Mankong nationwide slum upgrading programme in Thailand’ in Environment<br />
and Urbanization, Vol. 21, No. 2, pp. 309–330, 2009.<br />
Boonyabancha, S. ‘Baan Mankong; going to scale with “slum” and squatter upgrading<br />
in Thailand’ in Environment and Urbanization, Vol. 17, No. 1, pp. 21–46, 2005.<br />
Community Organisation Resource Centre, <strong>2010</strong>. Available online: www.corc.co.za.<br />
CARE. Delivery <strong>of</strong> Humanitarian Shelter in Urban Areas – The Case <strong>of</strong> ‘KASS’, The<br />
Kabul Area Shelter and Settlement Project as a model. CARE, 2007. Available online:<br />
www.sheltercentre.org/library/Delivery+Humanitarian+Shelter+Urban+Areas+<br />
The+Case+Kass+The+Kabul+Area+Shelter+and+Settlemen.<br />
Cosgrave, J. Responding to Earthquakes 2008; Learning from earthquake relief and<br />
recovery operation. Geneva: Alnap and ProVention Consortium, 2009.<br />
Displacement Solutions and <strong>International</strong> <strong>Federation</strong> <strong>of</strong> <strong>Red</strong> <strong>Cross</strong> and red Crescent<br />
Societies (IFRC). Housing, Land and Property (HLP) Rights in Post-Disaster Settings:<br />
Proposals for IFRC Shelter Policy and Response. 2008.<br />
Douglas, I. et al. ‘Unjust waters: climate change, flooding and the urban poor in Africa’<br />
in Environment and Urbanization, Vol. 20, No. 1, pp. 187–206, 2008.<br />
Hamdi, M., Wardah, H. and Sauter, G. ‘Uplink Porong: Supporting communitydriven<br />
responses to the mud volcano disaster in Sidoarjo, Indonesia’ in Gatekeeper<br />
Series 137j, IIED, London, 2009.<br />
Hasan, A. Participatory Development: The Story <strong>of</strong> the Orangi Pilot Project-Research<br />
and Training Institute and the Urban Resource Centre, Karachi. Oxford: Oxford<br />
University Press, <strong>2010</strong>.<br />
Humanitarian Initiatives UK, Disaster Mitigation Institute and Mango, A. Independent<br />
Evaluation: The DEC Response to the Earthquake in Gujarat, January, Volume Two:<br />
Main <strong>Report</strong>. London: <strong>Disasters</strong> Emergency Committee, 2001.<br />
<strong>World</strong> <strong>Disasters</strong> <strong>Report</strong> <strong>2010</strong> – Focus on urban risk<br />
69
CHAPTER 3Inter-Agency<br />
70<br />
Standing Committee (IASC). Protecting Persons Affected by Natural<br />
<strong>Disasters</strong>: IASC Operational Guidelines on Human Rights and Natural <strong>Disasters</strong>.<br />
Washington DC: Brookings, 2006.<br />
Jabeen, H., Allen, A. and Johnson, C. ‘Built-in resilience: learning from grassroots<br />
coping strategies to climate variability’ in Environment and Urbanization, Vol. 22,<br />
No. 1, <strong>2010</strong>.<br />
Karanja, I. ‘An enumeration and mapping <strong>of</strong> informal settlements in Kisumu, Kenya,<br />
implemented by their inhabitants’ in Environment and Urbanization, Vol. 22, No.<br />
1, <strong>2010</strong>.<br />
Da Silva, L. et al. ‘The Programme for Land Tenure Legalization on Public Land’ in<br />
Environment and Urbanization, Vol. 15, No. 2, pp. 191–200, 2003.<br />
Leckie, S. (ed.) Housing, Land and Property Restitution Rights forRefugees and Displaced<br />
Persons: Laws, Cases and Materials. Cambridge: Cambridge University Press, 2007.<br />
Mitlin, D. Urban Poor Funds: development by the people, for the people. Poverty <strong>Red</strong>uction<br />
in Urban Areas, Working Paper 18. London: IIED, 2008.<br />
Mitlin, D. and Muller, A. ‘Windhoek, Namibia: towards progressive urban land<br />
policies in Southern Africa’ in <strong>International</strong> Development Planning Review, Vol. 26,<br />
No. 2, pp. 167–186, 2004.<br />
Patel, S. ‘Reflections about disasters and the poor: Exploring possibilities to address<br />
preparedness and management by communities <strong>of</strong> the urban poor’, unpublished<br />
background paper, <strong>2010</strong>.<br />
Patel, S. d’Cruz, C. and Burra, S. ‘Beyond evictions in a global city; people-managed<br />
resettlement in Mumbai’ in Environment and Urbanization, Vol. 14, No. 1, pp.<br />
159–172, 2002.<br />
Phonphakdee, S., Visal S., and Sauter G. ‘The Urban Poor Development Fund in<br />
Cambodia: supporting local and citywide development’ in Environment and<br />
Urbanization, Vol. 21, No. 2, pp. 569–586, 2009.<br />
Rayos, J. Community-driven Disaster Intervention: Experiences <strong>of</strong> the Homeless People’s<br />
<strong>Federation</strong> in the Philippines. Manila and London: HPFP, PACSII and IIED, <strong>2010</strong>.<br />
Roy, A., Jockin, N.A. and Javed, A., ‘Community police stations in Mumbai’s slums’ in<br />
Environment and Urbanization, Vol. 16, No. 2, pp. 135–138, 2004.<br />
Stein, A. Commentary quoted in Haitians begin to return to unprepared capital, Associated<br />
Press, 6 February <strong>2010</strong>. Available online: www.thespec.com/article/717662.<br />
Stephens, C., Patnaik, R. and Lewin, S. This is My Beautiful Home: Risk Perceptions<br />
towards Flooding and Environment in Low Income Urban Communities: A Case Study<br />
in Indore, India. London: London School <strong>of</strong> Hygiene and Tropical Medicine, 1996.
Syukrizal, A., Hafidz, W. and Sauter, G. ‘Reconstructing Life: After the Tsunami: the<br />
Work <strong>of</strong> Uplink Banda Aceh in Indonesia’ in Gatekeeper Series 137i, IIED, London,<br />
2009.<br />
Tearfund. Learn the lessons: Governments must change the way they do aid work after<br />
thousands <strong>of</strong> needless deaths in recent disasters. London: Tearfund, 2005.<br />
Teodoro, J.I.E. and Rayos Co, J.C. ‘Community-driven land tenure strategies: the<br />
experiences <strong>of</strong> the Homeless People’s <strong>Federation</strong> <strong>of</strong> the Philippines’ in Environment<br />
and Urbanization, Vol. 21, No. 2, pp. 415–442, 2009.<br />
Thohir, S.A., Hafidz, W. and Sauter, G. ‘The how, when and why <strong>of</strong> community<br />
organisational support: Uplink Yogyakarta in Indonesia’ in Gatekeeper Series 137k,<br />
IIED, London, 2009.<br />
United Nations Development Programme (UNDP), UN Human Settlements<br />
Programme (UN-Habitat) and Centre for Architecture and Human Rights. Support<br />
for Rehabilitation <strong>of</strong> Traditional Communities Affected by the Tsunami. Bangkok,<br />
2008.<br />
UN-Habitat. Scoping <strong>Report</strong>: Addressing Land Issues after Natural <strong>Disasters</strong>. Geneva:<br />
UN-Habitat, 2008.<br />
Vincentian Missionaries. ‘The Payatas Environmental Development Programme:<br />
micro-enterprise promotion and involvement in solid waste management in<br />
Quezon City’ in Environment and Urbanization, Vol. 10, No. 2, pp. 55–68, 1998.<br />
Weru, J. ‘Community federations and city upgrading: the work <strong>of</strong> Pamoja Trust and<br />
Muungano in Kenya’ in Environment and Urbanization, Vol. 16, No. 1, pp. 47–56,<br />
2004.<br />
<strong>World</strong> <strong>Disasters</strong> <strong>Report</strong> <strong>2010</strong> – Focus on urban risk<br />
71
CHAPTER 4<br />
72
Urban violence<br />
As more people crowd together into cities, urban violence has become a defining<br />
feature <strong>of</strong> daily life in some developing countries. In Latin America, the Caribbean<br />
and sub-Saharan Africa, the bloodshed reaches a scale as bad as, or worse than, that<br />
<strong>of</strong> many wars. The United Nations Human Settlements Programme (UN-Habitat)<br />
reports that in a recent five-year period, approximately 60 per cent <strong>of</strong> urban dwellers<br />
in developing countries have been victims <strong>of</strong> crime. That number rises to 70 per cent<br />
in parts <strong>of</strong> Latin America and Africa. Nairobi, the capital <strong>of</strong> Kenya, once the pride <strong>of</strong><br />
East Africa and home to the headquarters <strong>of</strong> United Nations (UN) agencies, has been<br />
dubbed ‘Nairobbery’. Many <strong>of</strong> South Africa’s cities are characterized by a new form <strong>of</strong><br />
apartheid, with the rich isolated behind electric fences and the poor penned into slums<br />
where law and order is markedly absent.<br />
Over the past 20 years, the increasingly rapid pace <strong>of</strong> urbanization in developing<br />
countries has resulted in a dramatic increase in urban violence. The transition from an<br />
agriculture-based economy to a primarily industrial one involves mass migration from<br />
the countryside to the city. Most migrants gravitate to slums or squatter settlements,<br />
home to some 1 billion people today. These areas are generally large and sprawling,<br />
making it difficult to supply their residents with the most basic <strong>of</strong> needs.<br />
For some, migration brings real improvement as skilled workers enjoy higher wage<br />
levels in the cities and this promotes education and supports broader development.<br />
For many others, however, this transition results in extreme poverty, insecurity and<br />
increased vulnerability. As they crowd into shanty towns and slums, sometimes in<br />
appalling conditions with little or no access to clean water and sanitation, they clash<br />
with older populations and other migrants for scarce jobs, housing and basic services.<br />
The police are very <strong>of</strong>ten too overstretched or intimidated to maintain law and order<br />
and these ungoverned areas provide a fertile breeding ground for criminal networks<br />
trafficking in drugs, guns and people.<br />
This chapter presents an overview <strong>of</strong> the causes and costs <strong>of</strong> urban violence and analyses<br />
how extreme inequality and political instability are fuelling the increase in violence in<br />
cities in the developing world, before reviewing some <strong>of</strong> the strategies currently being<br />
applied to tackle the problems caused by urban violence.<br />
The causes<br />
There are many definitions <strong>of</strong> violence. The Crisis States Research Centre at the London<br />
School <strong>of</strong> Economics and Political Science recently adapted a three-fold categorization<br />
<strong>of</strong> political, economic and social violence to provide a particularly useful classification<br />
in urban contexts.<br />
<strong>World</strong> <strong>Disasters</strong> <strong>Report</strong> <strong>2010</strong> – Focus on urban risk<br />
Photo opposite page:<br />
Among the root causes<br />
<strong>of</strong> urban violence are<br />
poverty, discrimination<br />
and the availability<br />
<strong>of</strong> alcohol, drugs<br />
and weapons. Young<br />
people living in slums<br />
are particularly at risk<br />
<strong>of</strong> becoming victims<br />
or perpetrators <strong>of</strong> this<br />
violence.<br />
© Victor Lacken/IFRC<br />
73
CHAPTER 4<br />
74<br />
Economic violence is driven by material gain and includes street crime, drug-related<br />
violence and kidnapping. This type <strong>of</strong> violence is common where urban inequality and<br />
poverty combine to produce unequal access to economic opportunity. In some cases,<br />
societal transformation and development policies such as structural adjustment have<br />
exacerbated poverty and inequality and contributed to increased crime and violence.<br />
It is also closely associated with the existence <strong>of</strong> an informal economy where the poor<br />
find ways to earn a living providing informal services and trade. In Latin American<br />
cities, ‘social cleansing’ campaigns by the authorities to remove poor people and street<br />
vendors from the cities and to segregate them in designated areas have resulted in<br />
increased levels <strong>of</strong> violence and crime. At household level, social violence increases as<br />
a result <strong>of</strong> failure to meet family expectations, while economic violence increases as<br />
desperation and frustration drive some people to commit robbery and other crimes.<br />
Social violence is mainly an interpersonal phenomenon, driven by the desire to get or<br />
maintain social power and control, between individuals and within and between families<br />
and communities. Gangs are a common manifestation <strong>of</strong> social violence, formed in<br />
response to social and economic exclusion where young people find a sense <strong>of</strong> belonging<br />
and status. Social cleansing, spatial segregation <strong>of</strong> urban areas and extrajudicial<br />
killings by police are also categorized as social violence. For example, in Nairobi, where<br />
60 per cent <strong>of</strong> the population lives on 5 per cent <strong>of</strong> the city’s land, corruption is rife<br />
and youth gangs wreak terror with guns smuggled in from Somalia and Uganda. The<br />
privileged classes live in walled-<strong>of</strong>f houses with ‘safe havens’, complete with radio alarm<br />
panic buttons, where they can hide during robberies. The poor rely on vigilante groups<br />
to protect them.<br />
Political violence is driven by a desire to gain or maintain political power, <strong>of</strong>ten by<br />
elite groups. It is closely associated with lack <strong>of</strong> reform within the police and judiciary<br />
or the de facto abandonment <strong>of</strong> urban areas to criminal networks and drug gangs. A<br />
‘criminalization <strong>of</strong> governance’ occurs when these gangs impose their own rules in poor<br />
neighbourhoods, <strong>of</strong>ten providing security and dispensing justice but institutionalizing<br />
violence. In May <strong>2010</strong>, Jamaica’s government declared a state <strong>of</strong> emergency in parts<br />
<strong>of</strong> Kingston, the capital city, after shooting and firebomb attacks on police stations by<br />
suspected supporters <strong>of</strong> an alleged drug lord. Seventy-three people were killed as thousands<br />
<strong>of</strong> soldiers and police laid siege to a district <strong>of</strong> the capital that <strong>of</strong>ficials say serves<br />
as a ‘garrison community’ for the alleged drug gang. Attempts to arrest the suspect were<br />
violently repelled by his supporters. Hundreds <strong>of</strong> residents blocked the roads into the<br />
neighbourhood carrying placards proclaiming their support for the alleged gang leader,<br />
who they said provided security and other essential services for their community.<br />
Organized crime<br />
Organized crime, international drug trafficking, trade in lethal weapons and urban<br />
street gangs are acute manifestations <strong>of</strong> urban violence which usually comprise overlapping<br />
dimensions <strong>of</strong> political, economic and social violence.
Drug production and trafficking<br />
South America produces about 900 tonnes <strong>of</strong> cocaine a year, mostly for sale to the<br />
United States and Europe. Drug trafficking organizations have openly challenged governments<br />
in a number <strong>of</strong> countries including Colombia, Mexico and Jamaica through<br />
conflict and intimidation and the use <strong>of</strong> advanced military tactics and military-grade<br />
weapons. Violence is mostly associated with the transit, rather than the consumption,<br />
<strong>of</strong> illicit drugs – to the US through Central America and the Caribbean and to Europe<br />
through West Africa. Mexico’s drug cartels reportedly command more than 100,000<br />
foot soldiers, putting them on a par with the Mexican armed forces which command<br />
130,000 troops. The cartels are said to earn up to US$ 40 billion from the drug trade,<br />
a figure which exceeds the gross domestic product (GDP) <strong>of</strong> many low-income countries.<br />
The US Department <strong>of</strong> State recently reported that entire regions <strong>of</strong> Guatemala<br />
are now essentially under the control <strong>of</strong> drug trafficking organizations, the most visible<br />
<strong>of</strong> which is the Mexican group known as the Zetas.<br />
When governments react with force the violence can spiral out <strong>of</strong> control. One United<br />
States travel advisory warned US citizens about the levels <strong>of</strong> violence in Mexico, describing<br />
the shoot-outs between Mexican security forces and the drug cartel gunmen as similar to<br />
“small-unit combat”. Indeed, the global intelligence company Strategic Forecasting, Inc., or<br />
STRATFOR, reports that Mexico’s armed forces have now been deployed in nearly every<br />
state in the country. Increasingly they are charged with maintaining general public safety.<br />
Firearms<br />
Firearms increase the lethality <strong>of</strong> violence. According to the Small Arms Survey, civilians<br />
own about 650 million firearms worldwide (three-quarters <strong>of</strong> the known total)<br />
and gun violence kills at least 200,000 people each year in countries at peace.<br />
The illegal trade in small arms is believed to be worth at least US$ 1 billion per year.<br />
Many small arms remain in urban areas following a conflict, while others trickle over<br />
borders from countries currently or formerly at war. South Africa gets guns from<br />
Mozambique and Angola, and Nairobi receives weapons from Somalia and Uganda.<br />
In Brazil, where more than 100 people die from firearm violence every day, gangs have<br />
been seen with arms either pilfered or sold from military arsenals. In the favelas <strong>of</strong> Rio<br />
de Janeiro, youths carry assault rifles, machine guns and submachine guns.<br />
The ‘guns for ganja’ trade – where undocumented handguns from Haiti are exchanged<br />
for marijuana from Jamaica – is seen as a major factor contributing to the record levels<br />
<strong>of</strong> murder and violent crime in Jamaica. According to the US State Department’s <strong>2010</strong><br />
<strong>International</strong> Narcotics Control Strategy <strong>Report</strong>, around 70 per cent <strong>of</strong> the illegal firearms<br />
entering Jamaica originate in the United States. Mexico is another major recipient <strong>of</strong><br />
guns from the US. The Bureau <strong>of</strong> Alcohol, Tobacco, Firearms and Explosives estimates<br />
that Mexican drug trafficking organizations acquire thousands <strong>of</strong> weapons each year in<br />
Arizona, California and Texas and smuggle them across the border to Mexico.<br />
<strong>World</strong> <strong>Disasters</strong> <strong>Report</strong> <strong>2010</strong> – Focus on urban risk<br />
75
CHAPTER 4<br />
76<br />
Urban street gangs<br />
Urban street gangs are made up mostly <strong>of</strong> marginalized young men between the ages<br />
<strong>of</strong> 15 and 24, a sector <strong>of</strong> society that commits a disproportionately large share <strong>of</strong> violent<br />
acts. Some <strong>of</strong> the reasons people join gangs include finding a sense <strong>of</strong> belonging,<br />
reacting to repressive treatment, resisting the status quo, climbing out <strong>of</strong> poverty and<br />
achieving social status. (See Box 4.2.)<br />
The appeal <strong>of</strong> American gang culture has spread into Latin America and the Caribbean,<br />
<strong>of</strong>ten with members who brought it back to their countries <strong>of</strong> origin after being arrested<br />
in the United States and deported. Between 2000 and 2004, around 20,000 youths<br />
associated with gangs in the Los Angeles slums were deported to Central American<br />
countries many had never even visited. Their families had fled to the United States in<br />
the 1980s to escape civil war and children born into or brought up in the slums drifted<br />
into gangs and criminality and fell foul <strong>of</strong> the crackdown that followed the 1992<br />
Los Angeles riots. The notorious Mara Salvatrucha gang, for example, started in the<br />
Los Angeles region and is now entrenched in Central America, sending youth homicide<br />
rates soaring.<br />
Nairobi’s gang names are inspired by conflict and political movements, such as Taliban<br />
and Boys <strong>of</strong> Baghdad. Sometimes they work as mercenaries for political leaders. The<br />
streets <strong>of</strong> Lagos, Nigeria, are plagued by the Area Boys, tens <strong>of</strong> thousands <strong>of</strong> loosely<br />
organized delinquent youths who harass, threaten, bribe and extort money from passers-by.<br />
What started as a small band <strong>of</strong> hoodlums in the 1980s has grown with the<br />
influx <strong>of</strong> unemployed migrants to the city, in an oil-rich country where up to 70 per<br />
cent <strong>of</strong> the population lives below the poverty line.<br />
The costs<br />
It is difficult to measure the exact costs <strong>of</strong> urban violence, both tangible and intangible,<br />
but they are substantial, affecting the economic, political and social development <strong>of</strong><br />
cities and nations. A study in El Salvador, for example, put the total national cost <strong>of</strong><br />
violence at 11.5 per cent <strong>of</strong> GDP.<br />
Lives lost and ruined<br />
One simple calculation is homicide rates, which are highest in Latin America, the<br />
Caribbean and sub-Saharan Africa. Drug-producing countries have a homicide level<br />
35 per cent higher than the average rate for the rest <strong>of</strong> the world. In Mexico, violent<br />
confrontations between drug cartels have killed some 23,000 people since late 2006.<br />
In Rio de Janeiro, the homicide rate has tripled since the 1970s. In São Paulo, it has<br />
quadrupled. In some cities <strong>of</strong> Latin America, the homicide rate is as high as 120 per<br />
100,000 people. In Jamaica last year, the murder rate reached 1,672 – one <strong>of</strong> the highest<br />
rates per capita in the world. A worsening economic climate has been blamed for a<br />
significant increase in other violent crimes including theft, robbery and rape.
Economic development<br />
In economic terms, large numbers <strong>of</strong> dead, injured and imprisoned people mean a loss<br />
<strong>of</strong> work productivity and income, a lower GDP, higher hospital and healthcare costs,<br />
increased expenditures for policing, justice and prisons, and more. And while urban<br />
violence is rooted in underdevelopment and inequality, there is a vicious circle by<br />
which urban violence undermines development and further weakens state institutions.<br />
Significant levels <strong>of</strong> crime and violence discourage foreign investment and impede<br />
entrepreneurs from investing in their own country. Insecurity can lead to capital flight<br />
and a brain drain. Tourists stay away. Property values plummet. Geographical segregation<br />
worsens, as small businesses and educated middle-class residents flee high-crime<br />
neighbourhoods, leaving these areas to the criminals and those too poor to leave. As a<br />
result, the situation continues to deteriorate.<br />
Social costs<br />
Urban violence damages social capital, prevents social mobility, destroys communal<br />
bonds, erodes neighbours’ trust in one another and in police or local authorities, and<br />
creates a wall between marginalized communities and the establishment. The worst<br />
affected are the most vulnerable people, who become poorer, more segregated and less<br />
equal.<br />
Simply the fear and anxiety that persistent violence engenders can increase the costs<br />
to society. While the rich shut themselves <strong>of</strong>f behind elaborate security systems, the<br />
underprivileged are forced into slum settlements or stigmatized neighbourhoods. The<br />
most vulnerable – women, the elderly, the destitute – may stop going to work, drop<br />
out <strong>of</strong> night school or keep their children at home. A nationwide survey revealed that<br />
in South Africa, fear <strong>of</strong> crime prevented about one-quarter <strong>of</strong> respondents from starting<br />
their own businesses or taking public transport. In Lagos, 70 per cent <strong>of</strong> those<br />
surveyed feared becoming victims <strong>of</strong> crime.<br />
Democratic freedom<br />
High levels <strong>of</strong> urban violence constrain the exercise <strong>of</strong> democracy by weakening institutions’<br />
legitimacy through corruption, undermining the authority <strong>of</strong> local government<br />
and preventing political participation through fear and intimidation.<br />
There is a loss <strong>of</strong> press freedom when gangs and criminal groups target and sometimes<br />
kill investigative journalists who report on their activities. “Scores <strong>of</strong> reporters and<br />
numerous news outlets are engaging in self-censorship for fear <strong>of</strong> retribution,” warns<br />
the Committee to Protect Journalists. Crimes are underreported and corruption is<br />
unchecked.<br />
The militarization <strong>of</strong> law enforcement in a growing number <strong>of</strong> countries also threatens<br />
freedom. To confront the drug cartels behind so much <strong>of</strong> the urban violence, states are<br />
<strong>World</strong> <strong>Disasters</strong> <strong>Report</strong> <strong>2010</strong> – Focus on urban risk<br />
77
78<br />
increasingly calling on national armies and other military forces. In Mexico, Colombia<br />
and Jamaica, the sight <strong>of</strong> troops being deployed to conduct searches, secure neighbourhoods<br />
and hunt down suspected criminals is leading to a blurring <strong>of</strong> the distinction<br />
between civil and military responsibility. This may be necessary when criminal networks’<br />
firepower becomes a threat to the state’s monopoly on force, but the use <strong>of</strong> the<br />
army for public security should be an exception and should never be allowed to dilute<br />
the principle <strong>of</strong> civilian control <strong>of</strong> the military.<br />
Box 4.1 Violence and young people in urban settings<br />
For young people, the risk <strong>of</strong> experiencing violence<br />
– as victims, perpetrators and / or observers<br />
– is highest in urban environments where<br />
more than 1 billion people under the age <strong>of</strong><br />
18 years live, many <strong>of</strong> them in slums.<br />
Young people are impacted by, and inflict<br />
on themselves and others, violence across<br />
a variety <strong>of</strong> urban settings. Violence – such<br />
as being beaten, exploited, bullied, sexually<br />
abused, exposed to rage and angry blows between<br />
others, or having self-esteem constantly<br />
crushed – occurs in communities, homes,<br />
schools, institutions, workplaces and online.<br />
Some <strong>of</strong> these settings are considered<br />
‘private’ such as homes, institutions and workplaces;<br />
in these settings violence can stay hidden,<br />
invisible and secret behind closed doors.<br />
It is not spoken <strong>of</strong> and is denied, ignored or<br />
even accepted as an inevitable reality. As one<br />
youth put it: “I have been sexually abused four<br />
times. I really want help but I’m too scared. My<br />
friend had the same thing happen but won’t<br />
tell anyone. No one understands. I’m scared.”<br />
In contrast, in public settings like city<br />
streets, slums and school yards, violence can<br />
<strong>of</strong>ten be flagrant, unconcealed and visible to<br />
the community. “It is easy to get beaten if you<br />
are a street boy. People can rape you. Men<br />
can beat a boy and rape him. There is nothing<br />
you can do but run away if you are lucky,” said<br />
a child surviving on the streets <strong>of</strong> a mega-city.<br />
Too <strong>of</strong>ten the private and public forms <strong>of</strong><br />
violence against young people are treated as<br />
though they are separate and unconnected. In<br />
reality, violence against young people in private<br />
and public settings is deeply intertwined;<br />
violence in homes and private settings spills out<br />
to all aspects <strong>of</strong> a young person’s life. A common<br />
example <strong>of</strong> this spill-over can be seen in<br />
the role <strong>of</strong> young people in urban gangs and<br />
crime networks. Although not <strong>of</strong>ten recognized<br />
as such, these are a visible, public culmination<br />
<strong>of</strong> violence that begins in the private sphere.<br />
Through child abuse in the home, bullying<br />
at school or exposure to family members<br />
physically and psychologically tearing each<br />
other down, young people learn that violence<br />
can be tolerated and used effectively to control<br />
those who have less power, and it can<br />
even help gain benefits. “Witnessing violence<br />
teaches you violence and makes you hate,” explained<br />
one young person. In addition, these<br />
experiences can push young people away<br />
from their homes and leave them dependent on<br />
and vulnerable to others. A former gang member<br />
recounted that: “A lot <strong>of</strong> the young women<br />
are escaping from horrible home situations,<br />
especially with their fathers… So if the girls<br />
go out with these guys from the paramilitary<br />
it gives them a sense <strong>of</strong> rebellion, <strong>of</strong> power.<br />
These guys protect them – a guy with a gun. It<br />
is very common.”
Surrounding what happens in homes and<br />
on the streets is a set <strong>of</strong> social, economic, political<br />
and environmental factors that shapes<br />
the opportunities and choices available to the<br />
young. To escape, some young people can<br />
make harmful choices and be drawn into a<br />
world <strong>of</strong> drugs, guns and crime. Each young<br />
person caught in the cycle <strong>of</strong> violence means<br />
adults have failed in their responsibility to protect;<br />
it means a diminished potential for prosperity,<br />
safety and success for each community.<br />
In 2007, the <strong>International</strong> <strong>Red</strong> <strong>Cross</strong> and<br />
<strong>Red</strong> Crescent Movement defined violence in<br />
urban settings, especially for children and<br />
youth, as a “great humanitarian challenge”.<br />
In <strong>2010</strong> the <strong>International</strong> <strong>Federation</strong> <strong>of</strong> <strong>Red</strong><br />
<strong>Cross</strong> and <strong>Red</strong> Crescent Societies (IFRC) reinforced<br />
and expanded on this by launching the<br />
IFRC Global Strategy on Violence Prevention,<br />
Mitigation and Response with a particular focus<br />
on urban environments and the risk among<br />
children and youth.<br />
The strategy builds on the diverse, grassroots<br />
experience <strong>of</strong> <strong>Red</strong> <strong>Cross</strong> and <strong>Red</strong> Crescent<br />
Societies in addressing violence in each corner<br />
<strong>of</strong> the globe through working with orphans,<br />
young migrants fending for themselves or<br />
fleeing with their families, children living on<br />
the streets or those caught in the crossfire in<br />
favelas; helping young people to finish school,<br />
learn livelihoods and hold on to their dreams<br />
in the aftershock <strong>of</strong> war or disaster that has<br />
left their cities depressed; or enabling adults<br />
or youth to reach out to young people and<br />
educate them on violence prevention.<br />
Root causes include the availability and<br />
misuse <strong>of</strong> alcohol, drugs and weapons; gender<br />
inequalities; discrimination and exclusion;<br />
violent cultural norms; poverty and a lack <strong>of</strong><br />
economic opportunity; weak or missing support<br />
systems; and tolerance for the misuse <strong>of</strong><br />
power.<br />
While adults in their families, workplaces<br />
and communities have clear responsibilities, it<br />
is only in partnership with young people themselves<br />
that violence can be prevented, mitigated<br />
and responded to – in any setting, private<br />
or public. �<br />
Risk factors<br />
A study <strong>of</strong> the world’s hot spots reveals a range <strong>of</strong> reoccurring preconditions or risk<br />
factors that combine to provide fertile ground for urban crime and violence. Two sets<br />
<strong>of</strong> factors in particular are linked to higher levels <strong>of</strong> urban violence: socio-economic<br />
factors, which entrench poverty, exclusion and inequality, and political-institutional<br />
factors, which can produce a crisis <strong>of</strong> governance.<br />
Socio-economic factors<br />
Deprivation<br />
Deprivation <strong>of</strong> human needs has been widely recognized as an important underlying<br />
source <strong>of</strong> social conflict. In towns and cities <strong>of</strong> developing countries, one out <strong>of</strong> every<br />
three people lives in the slums. And because slum dwellers rarely pay taxes, many<br />
municipalities decide they are not entitled to public services or security. As a result,<br />
slum dwellers find themselves ignored by the state, deprived <strong>of</strong> basic services and<br />
excluded from society. In the particular context <strong>of</strong> rapid urbanization, government<br />
failure to provide security and basic social services, such as clean water, sanitation,<br />
health and education facilities, may fuel tensions arising from the integration <strong>of</strong> rural<br />
<strong>World</strong> <strong>Disasters</strong> <strong>Report</strong> <strong>2010</strong> – Focus on urban risk<br />
79
4migrants<br />
CHAPTER 4<br />
80<br />
into city life creating a volatile atmosphere and leading to violent confrontations<br />
between groups competing for scarce resources. Forcible eviction is a constant<br />
threat. Large-scale evictions by public authorities displace millions every year, sometimes<br />
for redevelopment or beautification projects, or simply to target and remove<br />
undesirable groups.<br />
In Mumbai, India, up to 400,000 people were displaced by a slum-clearance drive in<br />
late 2004 and early 2005, while in Zimbabwe, 700,000 people were forced to vacate<br />
their homes in six weeks in May–June 2005. Most <strong>of</strong> these people ended up even more<br />
vulnerable than before. Cambodia has one <strong>of</strong> the fastest-growing rates <strong>of</strong> urbanization<br />
in Asia and, in recent years, Phnom Penh has experienced an unprecedented boom in<br />
property values. As market prices have increased, whole communities have been relocated<br />
from land they occupied or bought in the post-war period, or forced out <strong>of</strong> their<br />
homes to make way for condominiums, shopping malls and <strong>of</strong>fice blocks. Housing<br />
rights groups estimate that 133,000 people – 10 per cent <strong>of</strong> the city’s population – have<br />
been evicted since 1990.<br />
Many <strong>of</strong> these conditions can also be seen in Dhaka, Bangladesh, one <strong>of</strong> the world’s<br />
fastest-growing cities. Here, the population was 400,000 in 1950, grew to around 12<br />
million by 2007 and is projected to reach 20 million by 2020. Between one-third and<br />
one-half <strong>of</strong> its residents are poor, living in 3,000 slums and squatter settlements. Many<br />
experience physical harm or murder at the hands <strong>of</strong> mastaans, armed thugs who control<br />
the slums through extortion and terror. Migrant women who work long hours and<br />
walk home late at night are particularly vulnerable. In 2001, the government enacted<br />
an urban cleansing programme in the slums. <strong>Report</strong>edly, while the police carried out<br />
mass evictions, mastaans raped and looted unhindered.<br />
Inequality<br />
A factor even more important than poverty is inequality. Countries with high levels <strong>of</strong><br />
urban violence tend to suffer from very unequal income distribution patterns and this<br />
unequal access to economic opportunity is frequently cited as the main risk factor for<br />
urban violence. Studies have shown that income inequality – which is highest in Africa<br />
and Latin America – is much more strongly associated with violent crime than poverty.<br />
In Latin America, homicide rates are between 40 and 56 per cent higher than the rest<br />
<strong>of</strong> the world. According to data compiled by the UN Economic Commission for Latin<br />
America and the Caribbean (ECLAC), 180 million people in the region are living in<br />
poverty, 71 million <strong>of</strong> whom are classed as indigent or ultra-poor. Figures for 2008<br />
indicate a slowdown in poverty reduction and a reversal <strong>of</strong> the downward trend in<br />
indigence since 2002. Only Brazil, Paraguay and Peru continued to reduce the number<br />
<strong>of</strong> people living in ultra-poverty, by around 1 percentage point. Indigence increased by<br />
between 1.4 and 2.5 per cent in Venezuela, the Dominican Republic, Ecuador, Mexico<br />
and Panama. Costa Rica and Uruguay recorded very slight increases. In Colombia,<br />
indigence rose by 2.7 per cent between 2005 and 2008, or 0.9 per cent per year.
Table 4.1 Measuring inequality<br />
Country 1992–2007*<br />
Chile 52<br />
Mexico 48.1<br />
Brazil 55<br />
Colombia 58.5<br />
Peru 49.6<br />
Ecuador 54.4<br />
Dominican Republic 50<br />
Jamaica 45.5<br />
El Salvador 49.7<br />
Honduras 55.3<br />
Bolivia 58.2<br />
Guatemala 53.7<br />
South Africa 57.8<br />
Kenya 47.7<br />
Haiti 59.5<br />
Source : UNDP (2009)<br />
* The Gini index co-efficient lies between 0 and 100.<br />
A value <strong>of</strong> 0 represents absolute equality and 100 absolute inequality.<br />
Although income distribution also improved compared with 1990, with an average<br />
drop <strong>of</strong> 4 per cent in the Gini index, income inequality in Latin American countries<br />
continues to be among the highest in the world. The most significant improvements<br />
were in Venezuela, Nicaragua, Panama and Uruguay, while Argentina, Costa Rica and<br />
Ecuador recorded increased levels <strong>of</strong> inequality.<br />
These increases no doubt contributed to citizens’ perception that their countries suffered<br />
from great distributive injustice. A 2009 ECLAC report found that: “The perception<br />
that income distribution is highly inequitable is associated with a distrust <strong>of</strong><br />
political institutions and a belief that governments serve the elites more than they<br />
serve the majority.” For many people, inequality is a consequence <strong>of</strong> an elite minority<br />
retaining a disproportionate level <strong>of</strong> control and influence over income and economic<br />
opportunity. This was seen as a threat to social cohesion, particularly in the context <strong>of</strong><br />
increasing poverty and deprivation.<br />
Spatial segregation is also an important factor in increasing urban violence. The geographical<br />
concentration <strong>of</strong> the poor in slums, shanty towns and outlying semi-urban<br />
areas isolates them from the rest <strong>of</strong> society and from the housing, health and education<br />
services, employment opportunities and social capital they need to improve their lives.<br />
As cities expand and develop, the poor are increasingly subjected to a combination <strong>of</strong><br />
economic decline and social cleansing programmes to remove them from the streets.<br />
<strong>World</strong> <strong>Disasters</strong> <strong>Report</strong> <strong>2010</strong> – Focus on urban risk<br />
81
CHAPTER 4<br />
82<br />
This dislocation significantly reduces their access to opportunities for informal business<br />
or self-employment, running hawker stalls, kerbside repairs or providing cheap<br />
transport. Without access to the economic and social life <strong>of</strong> the city they become<br />
trapped in a vicious circle <strong>of</strong> poverty and exclusion, which passes from generation to<br />
generation. Desperation and frustration can <strong>of</strong>ten boil over into conflict, crime and<br />
violence.<br />
Social factors<br />
There are social factors, too, such as a culture <strong>of</strong> machismo, where males earn status<br />
by proving their strength and masculinity. Demographics also count, since young men<br />
are most <strong>of</strong>ten the victims and the perpetrators <strong>of</strong> violent crime. High youth unemployment<br />
is another cause. <strong>World</strong>wide, young people aged 15 to 24 represent onequarter<br />
<strong>of</strong> the working-age population, yet account for almost one-half <strong>of</strong> the global<br />
unemployed. Nearly 25 per cent <strong>of</strong> the workforce in this age group earns less than<br />
US$ 1 a day.<br />
In Latin America and the Caribbean, drug use and trafficking have been central to a<br />
process <strong>of</strong> social decomposition producing violence within families, between gangs,<br />
between dealers and with corrupt <strong>of</strong>ficials. As traditional social institutions are eroded,<br />
they are replaced by perverse social capital in the form <strong>of</strong> gangs, drug mafias who ‘govern’<br />
neighbourhoods and networks <strong>of</strong> corrupt public servants and politicians.<br />
Street children, who may number in the tens <strong>of</strong> millions worldwide, are easy targets<br />
for membership in youth gangs. They end up on the street due to poverty, child abuse<br />
or the disintegration <strong>of</strong> the family. In general they have little education, are exposed<br />
to drugs and sex and live at risk <strong>of</strong> HIV / AIDS and teenage pregnancy. They are both<br />
victims and perpetrators <strong>of</strong> crime, which they commit in order to survive. In Nairobi,<br />
where approximately 60,000 people are homeless, street children mug pedestrians and<br />
snatch purses, pick pockets, extort money and engage in prostitution. Here and in<br />
many other cities from Guatemala to India, street children are seen as a menace to<br />
society and police brutality against them is widely accepted.<br />
Political-institutional factors<br />
In cities around the world, from Managua and Lagos, to Kinshasa and Karachi, there is<br />
a generalized lack <strong>of</strong> trust in the state’s ability to prevent crime and violence. Authorities<br />
are unwilling or unable to protect the populations <strong>of</strong> rapidly expanding urban<br />
areas. Many local governments lack the financial resources to recruit additional police<br />
<strong>of</strong>ficers or buy basic equipment such as handcuffs or helmets. Often, underpaid police<br />
<strong>of</strong>ficers refuse to risk their lives by entering dangerous neighbourhoods. In some countries<br />
the vast majority <strong>of</strong> crimes are never investigated – overload, lack <strong>of</strong> resources,<br />
incompetence and corruption lead to the erosion <strong>of</strong> the investigative capacity <strong>of</strong> the<br />
criminal justice system. In some cases, criminal networks become so powerful that they<br />
even threaten the state.
Crisis <strong>of</strong> legitimacy<br />
Many states with high levels <strong>of</strong> urban violence are characterized by their inability to<br />
provide services or security, maintain an effective presence throughout their territory<br />
or collect taxes. The social contract between the state and society is dysfunctional.<br />
When the social contract functions well, the state mobilizes sufficient public revenue<br />
and provides security and other essential services, and citizens pay taxes to finance state<br />
activity to produce these public goods. The state’s legitimacy – public confidence in the<br />
political institutions, rules and cultural and social norms that regulate the operation<br />
<strong>of</strong> government – is enhanced and stability reinforced. When the state fails to meet the<br />
citizens’ expectations, legitimacy is eroded.<br />
States may be unwilling or unable to meet the expectations <strong>of</strong> the people. In some countries<br />
elite groups are not willing to fund social programmes and significant proportions <strong>of</strong> the<br />
national budget may go towards military or other elite sectors while health and education<br />
receive only a fraction <strong>of</strong> the allocation needed to provide basic services. When citizens<br />
commit to the social contract and consent to be governed, they expect that their basic needs<br />
will be met – this is the essence <strong>of</strong> legitimacy. If these expectations are ignored or repeatedly<br />
frustrated, legitimacy is eroded. When legitimacy is very low, citizens may be reluctant to<br />
pay taxes and may condone or engage in anti-social, violent or criminal activity. For example,<br />
tax revenues in Mexico amount to 11 per cent <strong>of</strong> GDP, in Guatemala they are equivalent<br />
to 12 per cent, in Peru 16 per cent. In Pakistan, tax revenue has fallen to 9 per cent.<br />
<strong>World</strong> <strong>Disasters</strong> <strong>Report</strong> <strong>2010</strong> – Focus on urban risk<br />
Jamaica <strong>Red</strong> <strong>Cross</strong><br />
volunteer providing<br />
counselling to children<br />
living in the Tivoli<br />
Gardens garrison<br />
community in the<br />
capital, Kingston,<br />
following an eruption<br />
<strong>of</strong> violence earlier<br />
this year.<br />
© Jamaica <strong>Red</strong> <strong>Cross</strong><br />
83
CHAPTER 4<br />
84<br />
Unconsolidated state formation and weak political institutions<br />
Countries undergoing a transition to democracy, emerging from periods <strong>of</strong> authoritarian<br />
rule or recovering from internal conflict are particularly vulnerable to high levels <strong>of</strong> urban<br />
violence. In the past, political authority may have been monopolized by a dominant ruling<br />
class or coalition <strong>of</strong> powerful groups. This culture <strong>of</strong> monopolizing power and limiting<br />
access to other groups has frequently led to political instability and populism, sometimes<br />
precipitating a crisis <strong>of</strong> legitimacy. These countries also tend to have weak political institutions<br />
with multiple and <strong>of</strong>ten competing centres <strong>of</strong> power. When regimes are paralysed<br />
by divisions and state–elite conflicts, critical judicial and economic reforms, which are<br />
necessary to consolidate democratic transitions, promote economic growth and develop<br />
a genuine social contract, become impossible because they threaten the vested interests<br />
<strong>of</strong> elites. Unreformed judicial systems remain politicized and corrupt and are <strong>of</strong>ten overwhelmed<br />
by the rise in crime and the demands <strong>of</strong> international counterterrorism and<br />
counter-narcotics campaigns. Failure to respond effectively to rising crime and violence<br />
creates a chain reaction as impunity destroys the credibility <strong>of</strong> the law enforcement system<br />
and this in turn erodes its capacity for deterrence. This inhibits economic growth and<br />
undermines state capacity to deliver basic services, contributing to a worsening <strong>of</strong> the<br />
conditions <strong>of</strong> deprivation and inequality that drive people to commit violent acts.<br />
When the effectiveness <strong>of</strong> the law does not apply to all citizens and groups, or to all the<br />
territory <strong>of</strong> the state, the state loses its authority. Impunity also contributes to a culture<br />
<strong>of</strong> excessive force or brutality by police in poor neighbourhoods, including the practice<br />
<strong>of</strong> torture and even summary execution <strong>of</strong> crime suspects from slum or shanty town settlements.<br />
Police have been known to target entire communities rather than individual<br />
<strong>of</strong>fenders, so that civilians view them as ‘enforcers’ and not protectors. These crimes <strong>of</strong>ten<br />
go unpunished. Data from the US State Department and Amnesty <strong>International</strong> show<br />
that in 2006, extrajudicial killings accounted for more than 50 deaths in 31 countries. In<br />
the favelas <strong>of</strong> Rio de Janeiro, military police combat drug gangs by conducting violent mass<br />
raids, turning neighbourhoods into urban battlefields. According to the UN Special Rapporteur,<br />
Brazilian police declared extrajudicial killings and summary executions to be “acts<br />
<strong>of</strong> resistance followed by death”, and recorded 1,330 <strong>of</strong> these ‘resistance killings’ in 2008.<br />
Exclusion<br />
Government failure to provide essential public goods leads to exclusion. For the<br />
wealthy this situation is <strong>of</strong>ten pre-empted by self-exclusion as they choose to hire private<br />
security forms, send their children to private schools or seek medical treatment<br />
and preventive healthcare at private hospitals. But this self-exclusion only compounds<br />
the government’s failure and contributes to the creation <strong>of</strong> a different class <strong>of</strong> citizen,<br />
an underclass with little access to basic human needs, living on the fringes <strong>of</strong> an<br />
elite society whose opulence it can only access on a satellite TV channel. Research has<br />
shown that the urban poor feel rejected by society, discriminated against and systematically<br />
denied the opportunities to improve their quality <strong>of</strong> life. This discrimination<br />
is internalized and expressed in lack <strong>of</strong> confidence in the state and its institutions
and in a sense <strong>of</strong> hopelessness for the future. Research also demonstrates that this<br />
systematic segregation <strong>of</strong> the poor entrenches and perpetuates poverty over generations.<br />
One Latin American expert refers to a “dissident conscience” which develops in<br />
marginalized urban communities and is commonly expressed through violence. When<br />
the excluded and the marginalized look around and see business owners evading tax,<br />
politicians buying votes and appointing family members and friends to public posts,<br />
or using public money for personal gain, they lose confidence in the institutions <strong>of</strong> the<br />
state and begin to question what they gain from obeying the law.<br />
Strategies<br />
The recently passed benchmark – more than half the world’s population living in<br />
urban centres – served to focus international attention on a major crisis that has not<br />
been adequately addressed until now. Thus far, solutions to the problems <strong>of</strong> urban<br />
violence have been scattershot and poorly financed, with little in-depth evaluation <strong>of</strong><br />
what works and what doesn’t.<br />
Asking the police and criminal justice system to fix everything may only make matters<br />
worse. A broad-based response looks at better urban planning, effective and inclusive<br />
local governance, community involvement, reform <strong>of</strong> police and judicial systems, education<br />
and jobs for youth, effective international laws against organized crime, disarmament<br />
and gun awareness, and tailored responses to the specific circumstances <strong>of</strong><br />
each particular local context.<br />
Meaningful citizen involvement in local governance is key to reducing urban violence.<br />
The social contract between the state and society is based on an active dialogue about<br />
the expectations that citizens have <strong>of</strong> the state, its capacity to provide services, including<br />
security, and to secure revenue from its population and territory to provide these<br />
services. In addition, because people’s needs and expectations <strong>of</strong> the state evolve over<br />
time and the state’s capacity and resources are impacted by changes in both domestic<br />
and international political and financial conditions, this dialogue needs to be continually<br />
revisited and the agreement updated. A fundamental precondition for an effective<br />
social contract, therefore, is a set <strong>of</strong> effective political institutions and processes<br />
through which the state and its citizens can engage, consult and dialogue to renegotiate<br />
and reinstitutionalize aspects <strong>of</strong> the contract.<br />
As the government representatives closest to the people, strong local leaders can increase a<br />
state’s legitimacy. Local authorities that engage with constituents, respond to their needs<br />
and include them in decision-making can build trust in the community and encourage<br />
inter-group dialogue to ease any tensions. At the same time, community involvement<br />
in urban planning, service provision and violence-reduction strategies increases<br />
the chances that they will work. To ensure they can deliver on their commitments,<br />
municipal governments need to have enough autonomy and resources to act effectively.<br />
<strong>World</strong> <strong>Disasters</strong> <strong>Report</strong> <strong>2010</strong> – Focus on urban risk<br />
85
CHAPTER 4<br />
86<br />
In Latin America, several countries have delegated authority to the cities, with positive<br />
results. In Medellín, Colombia, the homicide rate fell from 174 to 29 per 100,000<br />
inhabitants between 2002 and 2007, largely thanks to local government initiatives.<br />
Mayors emphasized violence prevention, worked with civil society organizations and<br />
invested in supplying informal settlements with public transport, education, housing<br />
and even libraries. In Bogotá, mayors backed police training missions, improved public<br />
transport, built libraries and put restrictions on guns and alcohol. These and other<br />
measures brought down the homicide rate from 80 per 100,000 inhabitants in 1993<br />
to 19 per 100,000 in 2007.<br />
Following an increase in firearm violence, Toronto, Canada, is advocating for a countrywide<br />
handgun ban.<br />
Urban planning, design and management are important elements in safety. Criminal<br />
acts tend to occur and reoccur in specific places: dark alleys, unlit areas, isolated bus<br />
stops. The physical layout <strong>of</strong> a city, its lighting, landscape maintenance and transportation<br />
systems can create or diminish opportunities for crime. A woman who commutes<br />
from work late at night and must walk on a dark, empty road from her bus stop to her<br />
home is easy prey for potential <strong>of</strong>fenders.<br />
In 1996, UN-Habitat launched the Safer Cities Programme, after several African mayors<br />
asked the organization for help in addressing urban insecurity. This programme<br />
contributes to UN-Habitat’s main goal <strong>of</strong> sustainable urbanization by creating partnerships<br />
with local governments to prevent crime and violence through planning and<br />
management.<br />
Community policing has spread to cities around the world and in a variety <strong>of</strong> forms.<br />
Basically, it holds that community participation is a necessary part <strong>of</strong> the security process<br />
and that the police are accountable to the people. In Mumbai, where police are<br />
<strong>of</strong>ten corrupt or absent, authorities have created a system <strong>of</strong> panchayats, neighbourhood<br />
organizations that serve as links between slum dwellers and the local police.<br />
The panchayats resolve disputes at the local level, improve police accountability and<br />
empower women, since many <strong>of</strong> the volunteer representatives are female.<br />
A form <strong>of</strong> community policing is now having an impact on the favelas <strong>of</strong> Rio, too. In<br />
late 2008, Brazil’s military police moved into the Santa Marta slum, battling the drug<br />
gangs and eventually clearing them out. Then the city’s first ‘pacifier police division’<br />
stayed on, opening permanent bases in the favela, while the state invested in paving the<br />
streets, painting houses and building a health centre. The project has been copied in<br />
other favelas, reducing violent crime by up to 85 per cent in some areas and there are<br />
plans to extend it throughout the city by the time <strong>of</strong> the 2016 Olympics. It must be<br />
noted, however, that the police alone cannot solve the pressing problems <strong>of</strong> unemployment<br />
and a lack <strong>of</strong> public services, which continue to weigh heavily upon Rio’s favelas.
At the same time, many <strong>of</strong> the world’s largest cities are relatively secure, proving that<br />
urban settings are not automatic backdrops for murder and mayhem. With enough<br />
leadership, imagination and cooperation, solutions can be found to make the 21st<br />
century metropolis a safe and desirable place to live.<br />
Box 4.2 <strong>Red</strong> <strong>Cross</strong> <strong>Red</strong> Crescent action<br />
The <strong>Red</strong> <strong>Cross</strong> <strong>Red</strong> Crescent strives to prevent<br />
urban violence by improving children’s self-esteem,<br />
teaching them skills and demonstrating<br />
peaceful resolution <strong>of</strong> conflict. In Sierra Leone,<br />
where children suffered through 11 years <strong>of</strong><br />
civil war and were <strong>of</strong>ten made to fight, the Sierra<br />
Leone <strong>Red</strong> <strong>Cross</strong> Society developed child<br />
advocacy and rehabilitation centres (since expanded<br />
to Liberia). The programme <strong>of</strong>fers psychosocial,<br />
educational and vocational training<br />
to war-affected youth and ex-combatants,<br />
helping them to reintegrate their communities.<br />
In South Africa, a programme entitled ‘Soccer<br />
against crime’ brings young people <strong>of</strong> different<br />
backgrounds together to play the sport, to help<br />
end the kind <strong>of</strong> discrimination and violence<br />
against foreigners that devastated Gauteng<br />
province in 2008.<br />
In Central America and the Caribbean, the<br />
Spanish <strong>Red</strong> <strong>Cross</strong> runs a violence prevention<br />
project with eight countries. It targets youth<br />
leaders at risk and involves them in a variety<br />
<strong>of</strong> social projects which differ from country to<br />
country. In Guatemala, they do theatre and singing.<br />
In Nicaragua, young people learn to make<br />
necklaces and bracelets by hand and sell them<br />
in their communities. In the Dominican Republic,<br />
youth help to clean up national parks and coastlines.<br />
“Our work is to help them become part<br />
<strong>of</strong> their communities,” Juan José Martinez Solis,<br />
violence prevention coordinator for the Spanish<br />
<strong>Red</strong> <strong>Cross</strong>, told the <strong>World</strong> <strong>Disasters</strong> <strong>Report</strong>.<br />
A Canadian <strong>Red</strong> <strong>Cross</strong> programme called<br />
RespectED teaches children and youth to stop<br />
bullying, harassment, dating violence and<br />
abuse. It has been expanded to urban settings<br />
in Sri Lanka and Guyana. And in Norway, the<br />
<strong>Red</strong> <strong>Cross</strong> has a street mediation programme,<br />
where young people teach their peers how to<br />
communicate peacefully and manage conflict.<br />
A standby mediation team intervenes in ongoing<br />
conflicts, such as those between gangs.<br />
When Michel Minnig, former head <strong>of</strong><br />
the <strong>International</strong> Committee <strong>of</strong> the <strong>Red</strong> <strong>Cross</strong><br />
(ICRC) in Southern America, arrived in the region<br />
in 2004, he was struck by the gravity <strong>of</strong><br />
the situation in Rio’s favelas. As he explained,<br />
“The consequences for the civilian population<br />
<strong>of</strong> this armed violence in an urban setting were<br />
similar to the ones we used to see in an armed<br />
conflict – people killed and wounded, a lack<br />
<strong>of</strong> infrastructure, a whole range <strong>of</strong> tension and<br />
abuse.” Minnig was one <strong>of</strong> the early proponents<br />
<strong>of</strong> ICRC action to help improve dignity<br />
for and respect towards the most vulnerable inhabitants<br />
<strong>of</strong> Rio’s favelas. And so in December<br />
2008, the organization launched a pilot project<br />
in seven <strong>of</strong> the city’s most wretched slums.<br />
Since then, the ICRC, the Brazilian <strong>Red</strong><br />
<strong>Cross</strong> and other local and state actors have<br />
started to work together, conducting first-aid<br />
training for residents, ensuring access to medical<br />
care including mental health, addressing<br />
the situation <strong>of</strong> adolescent mothers and<br />
their children, working with seven schools to<br />
improve humanitarian values and space in<br />
their surroundings. Very importantly, the ICRC<br />
works with the police to integrate international<br />
<strong>World</strong> <strong>Disasters</strong> <strong>Report</strong> <strong>2010</strong> – Focus on urban risk<br />
87
human rights standards and humanitarian principles<br />
into their work.<br />
The IFRC promotes the Youth as Agents <strong>of</strong><br />
Behavioural Change programme, which invites<br />
children to participate in role-playing games or<br />
visualization exercises and then discuss their emotions.<br />
For example, a group forms a circle and<br />
prevents others from breaking through, a game<br />
that teaches empathy for excluded immigrants.<br />
The games are an instinctive, non-cognitive<br />
88<br />
way to learn compassion, active listening, critical<br />
thinking, non-judgement, mediation and a<br />
peaceful resolution <strong>of</strong> tensions. Games and<br />
exercises are adapted to meet the needs and<br />
challenges <strong>of</strong> each national context and peer<br />
education is essential. “The programme is about<br />
changing mindsets, attitudes and behaviour in<br />
a society and how youth can play a leadership<br />
role in that,” said IFRC’s Katrien Beeckman, who<br />
founded the programme. �<br />
The future <strong>of</strong> urban violence<br />
At best, however, these strategies can only hope to lessen the impact <strong>of</strong> violence in the<br />
targeted communities. This is not to deny the important progress that has been made<br />
through community-centred approaches and development initiatives. For example, the<br />
adoption <strong>of</strong> targeted social programmes that deal directly with the problem <strong>of</strong> poverty,<br />
such as the Benazir Bhutto Income Support Programme in Pakistan, Progresiva in Mexico<br />
or Bolsa Familia in Brazil and other conditional cash transfer schemes, have helped reduce<br />
income inequality in targeted communities. But these gains are threatened by global<br />
economic conditions, ageing populations and the failure to extend the benefits through<br />
reforms that improve the quality and reach <strong>of</strong> health and education services nationally. For<br />
example, while developed countries regularly spend up to 18 per cent <strong>of</strong> total government<br />
expenditure on health, Kenya spends only 6.1 per cent, Jamaica barely 4.2 per cent and<br />
Pakistan a paltry 1.3 per cent. And while important progress has been made in the number<br />
<strong>of</strong> children attending primary and secondary school education, the quality is <strong>of</strong>ten<br />
appalling. In Brazil where 70.4 per cent <strong>of</strong> the population is qualified as ‘low education<br />
attainment’ in the UN Development Programme’s 2009 Human Development Index, a<br />
quarter <strong>of</strong> the education budget is spent on free university education while primary and<br />
secondary education is neglected. In parts <strong>of</strong> Pakistan, the female literacy rate is 3 per cent.<br />
Regardless <strong>of</strong> how sophisticated the economic models used to develop government<br />
strategies to cushion the effects <strong>of</strong> economic crisis and support income redistribution<br />
are, no amount <strong>of</strong> social spending or development programming innovations will be<br />
able to withstand the corrosive impact <strong>of</strong> corruption or to resist being derailed by elite<br />
groups if the political system does not establish equality before the law. The principle<br />
that the law <strong>of</strong> the land should apply equally to all is a cornerstone <strong>of</strong> a free society<br />
and one which is <strong>of</strong>ten markedly absent in countries where urban violence is rife. The<br />
discretionary application <strong>of</strong> tax codes, zoning laws, public procurement and contracting<br />
regulations, criteria for public appointments, restrictions on the exploitation <strong>of</strong><br />
natural resources and even court rulings, benefits the few and establishes a neo-feudal<br />
hierarchy <strong>of</strong> elite groups, special interests and favoured individuals, creating one <strong>of</strong> the<br />
most powerful incentives for widespread crime and violence. <strong>International</strong> assistance
can help, but – as the Organisation for Economic Co-operation and Development’s<br />
Development Assistance Committee points out – international actors have not yet<br />
adequately incorporated into policies or practice a sufficiently nuanced understanding<br />
<strong>of</strong> the dynamics <strong>of</strong> state failure to establish stable political order or developed appropriately<br />
contextualized state-building strategies.<br />
<strong>International</strong> assistance is also needed to tackle the tidal wave <strong>of</strong> urban violence driven<br />
by drug production and trafficking in Latin America. It is no coincidence that the<br />
Caribbean basin has the world’s highest murder rate. The 2008 report <strong>of</strong> the Latin<br />
American Commission on Drugs and Democracy – chaired by Fernando Henrique<br />
Cardoso, Ernesto Zedillo and César Gaviria, former presidents <strong>of</strong>, respectively, Brazil,<br />
Mexico and Colombia – stated categorically that the so-called ‘war on drugs’ was a<br />
failure, with staggering costs for the hemisphere, and called for a new paradigm to deal<br />
with the problems <strong>of</strong> narcotics. Similarly, calls for the restoration <strong>of</strong> the United States<br />
ban on the sale <strong>of</strong> assault weapons which expired in 2004 have been echoed by <strong>of</strong>ficials<br />
in both the US and the countries <strong>of</strong> the Caribbean basin in which tens <strong>of</strong> thousands <strong>of</strong><br />
weapons originating in the United States are seized every year.<br />
As this chapter illustrates, the dramatic increase in urban violence is rooted in the economic,<br />
social and political conditions in which rapid urbanization takes place and the<br />
globalization <strong>of</strong> international crime and in particular drug trafficking and the illegal<br />
trade in firearms. Without comprehensive action to tackle these conditions, address<br />
economic inequality and reform political systems characterized by weakness and instability,<br />
violence is likely to continue. Ultimately, confronting elite and special interest<br />
groups may be the single most important challenge for violence reduction.<br />
Chapter 4 was co-written by Amy Serafin, freelance journalist, and Sean Deely, independent<br />
conflict and development analyst. Box 4.1 was contributed by Gurvinder Singh, Canadian<br />
<strong>Red</strong> <strong>Cross</strong>, and Sandra Gutiérrez, IFRC Principles and Values Department. Amy<br />
Serafin contributed Box 4.2.<br />
Sources and further information<br />
Agostini, G. et al. Understanding the Processes <strong>of</strong> Urban Violence – An Analytical<br />
Framework. London: Crisis States Research Centre, Development Studies Institute,<br />
London School <strong>of</strong> Economics and Political Science, 2008.<br />
BBC. ‘Jamaica unrest: Your stories’. BBC News, 25 May <strong>2010</strong>. Available online: http://<br />
newsvote.bbc.co.uk / mpapps / pagetools / print / news.bbc.co.uk/2/hi / americas/<br />
8703872.stm?ad=1.<br />
BBC. ‘Pr<strong>of</strong>ile: Christopher “Dudus” Coke’. BBC News, 24 May <strong>2010</strong>. Available online:<br />
http://news.bbc.co.uk/2/hi / world / latin_america/10146172.stm.<br />
<strong>World</strong> <strong>Disasters</strong> <strong>Report</strong> <strong>2010</strong> – Focus on urban risk<br />
89
CHAPTER 4<br />
90<br />
Canadian Consortium on Human Security. Human Security for an Urban Century:<br />
Local Challenges, Global Perspectives. Vancouver, 2007.<br />
Cardona, J. ‘“Cops and narcos” playground games for Mexico kids’. Reuters, 17 May<br />
<strong>2010</strong>. Available online: www.reuters.com / article / idUSN13272264.<br />
Carter, S. ‘Exclusive: 100,000 foot soldiers in Mexican cartels’. Washingtontimes.com,<br />
3 March 2009. Available online: www.washingtontimes.com / news/2009/mar/03/<br />
100000-foot-soldiers-in-cartels/.<br />
Casas-Zamora, K. Drugs and Democracy: Towards a Paradigm Shift. The Brookings<br />
Institution, 22 April <strong>2010</strong>. Available online: www.brookings.edu / opinions/2009/<br />
0422_drugs_and_democracy_casaszamora.aspx.<br />
Centre for <strong>International</strong> Cooperation and Security Department <strong>of</strong> Peace Studies.<br />
The impact <strong>of</strong> armed violence on poverty and development. Full report <strong>of</strong> the Armed<br />
Violence and Poverty Initiative, University <strong>of</strong> Bradford, March 2005.<br />
Council on Foreign Relations. Organized Crime in the Western Hemisphere:<br />
An Overlooked Threat? A Council on Foreign Relations Symposium, 18 November<br />
2009. Available online: www.cfr.org / project/1445/cfr_symposium.html.<br />
Covell, K. Seen, heard and believed: What youth say about violence. Ontario, Canada:<br />
Canadian Council <strong>of</strong> Provincial Child and Youth Advocates, Save the Children<br />
Canada and UNICEF, 2006.<br />
Daniels, A. ‘Taming Brazil’s favelas’. The Daily Telegraph, 11 March <strong>2010</strong>. Available<br />
online: www.telegraph.co.uk / news / worldnews / southamerica / brazil/7414677/<br />
Taming-Brazils- favelas.html.<br />
Davis, N. ‘Haiti and Jamaica’s deadly trade’. BBC News, 25 October 2008. Available<br />
online: http://news.bbc.co.uk/2/hi / americas/7684983.stm.<br />
Dowdney, L. Children <strong>of</strong> the Drug Trade: A Case Study <strong>of</strong> Children in Organized Armed<br />
Violence in Rio de Janeiro. Rio de Janeiro: Viveiros de Castro Editora Ltda, 2003.<br />
Downie, A. ‘Behind Brazil’s Killing Spree’. Time, 17 May 2006. Available online:<br />
www.time.com / time / world / article/0,8599,1195272,00.html.<br />
Economist, The. ‘Lump Together and Like It: The problems – and benefits – <strong>of</strong> urbanization<br />
on a vast scale’. 6 November 2008.<br />
Economist, The. ‘The mob takes on the state’. 18 May 2006.<br />
Fairholm, J. and Singh, G. Handbook on preventing violence against children. Vancouver,<br />
Canada: Canadian <strong>Red</strong> <strong>Cross</strong> Society, <strong>2010</strong>.<br />
Fox, S. and Hoelscher, K. The Political Economy <strong>of</strong> Social Violence. Crisis States Research<br />
Centre, Development Studies Institute, London School <strong>of</strong> Economics Working<br />
Paper 72.2, <strong>2010</strong>.
Fukuyama, F. ‘A Quiet Revolution: Latin America’s Unheralded Progress’, in Foreign<br />
Affairs, November / December 2007, Washington DC: Council on Foreign<br />
Relations.<br />
Helps, H. ‘Drug-linked violence shakes Jamaica capital, 31 dead’. Reuters, 25 May<br />
<strong>2010</strong>. Available online: www.reuters.com / article / idUSN25506808.<br />
Helps, H. ‘Four killed as Jamaicans clash over drug lord’. Reuters, 24 May <strong>2010</strong>.<br />
Available online: www.reuters.com / article / idUSTRE64 M2CP<strong>2010</strong>0525?loom<br />
ia_ow=t0: s0: a49: g43: r3: c0.073171: b34325232: z0.<br />
Helps, H. ‘Jamaica declares emergency in capital over violence’. Reuters, 23 May <strong>2010</strong>.<br />
Available online: www.reuters.com / article / idUSTRE64 M2CP<strong>2010</strong>0523?loom<br />
ia_ow=t0: s0: a49: g43: r4: c0.082430: b34301492: z0.<br />
IKV Pax Christi. Kidnapping is Booming Business. July 2008.<br />
<strong>International</strong> Centre for the Prevention <strong>of</strong> Crime (ICPC). <strong>International</strong> <strong>Report</strong> on<br />
Crime Prevention and Community Safety: Trends and Perspectives. Montreal: ICPC,<br />
<strong>2010</strong>.<br />
<strong>International</strong> <strong>Red</strong> <strong>Cross</strong> and <strong>Red</strong> Crescent Movement. Together for humanity.<br />
Declaration at the 30th <strong>International</strong> Conference <strong>of</strong> the <strong>Red</strong> <strong>Cross</strong> and <strong>Red</strong><br />
Crescent. Geneva: <strong>International</strong> <strong>Federation</strong> <strong>of</strong> <strong>Red</strong> <strong>Cross</strong> and <strong>Red</strong> Crescent<br />
Societies, 2007.<br />
Jayasinghe, M. Pakistan – A Preliminary Evaluation <strong>of</strong> the Tax Gap. Atlanta: Georgia<br />
State University, 2007.<br />
Lauria, C. Drug Trade, Violent Gangs Pose Grave Danger. Committee to Protect<br />
Journalists, 10 February 2009.<br />
Liebermann, S. and Coulson, J. ‘Participatory Mapping for Crime Prevention in South<br />
Africa – local solutions to local problems’ in Environment and Urbanization, Vol.<br />
16, No. 2, 2004.<br />
McIlwaine, C. and Moser, C. Urban Poor Perceptions <strong>of</strong> Violence and Exclusion in<br />
Colombia. Washington DC: The <strong>World</strong> Bank, 2000.<br />
Moser, C. and McIlwaine, C. Participatory urban appraisal and its application for research<br />
on violence. London: <strong>International</strong> Institute for Environment and Development-<br />
SAGE, 1999.<br />
Moser, C. ‘Urban violence and insecurity: An introductory roadmap’ in Environment<br />
and Urbanization, Vol. 16, No. 2, 2004.<br />
Moser, C. <strong>Red</strong>ucing Urban Violence in Developing Countries. Brookings Global Economy<br />
and Development, Policy Brief 2006-1, November 2006.<br />
<strong>World</strong> <strong>Disasters</strong> <strong>Report</strong> <strong>2010</strong> – Focus on urban risk<br />
91
CHAPTER 4<br />
92<br />
Neild, R. Themes and debates in public security reform: A manual for civil society,<br />
Community Policing. Washington Office on Latin America, 2009. Available online:<br />
http://gw.wola.org / media / Security%20Policy / pub_security_themesdebates_5co<br />
mmunitypolicing.pdf.<br />
O’Donnell, G. On the State, Democratization and Some Conceptual Problems: A Latin<br />
American View with Glances at Some Post-Communist Countries. Working Paper<br />
#192, April 1993.<br />
Organisation for Economic Co-operation and Development (OECD) Development<br />
Assistance Committee (DAC). Concepts and Dilemmas <strong>of</strong> Statebuilding in Fragile<br />
Situations: From Fragility to Resilience. OECD DAC Discussion Paper. Paris:<br />
OECD, 2008.<br />
OECD DAC. Small Arms and Light Weapons (SALW). OECD DAC Issues Brief. Paris:<br />
OECD, 2005.<br />
Ortega, S.T. et al. ‘Modernization, age structure, and regional context: a cross-national<br />
study <strong>of</strong> crime’ in Sociological Spectrum, Vol. 12, pp. 257–277, 1992.<br />
Pinheiro, P.S. <strong>World</strong> report on violence against children. New York: United Nations, 2006.<br />
Rodgers, D. Dying for it: gangs, violence and social change in urban Nicaragua. Crisis<br />
States Research Centre Working Papers, series 1, 35. London: London School <strong>of</strong><br />
Economics and Political Science, Crisis States Research Centre, 2003.<br />
Serrano, M. and Celia Toro, M. ‘From Drug Trafficking to Transnational Organized<br />
Crime in Latin America’ in Berdal, M. and Serrano, M. (eds.) Transnational<br />
Organized Crime and <strong>International</strong> Security: Business As Usual? Boulder, Colorado:<br />
Lynne Rienner Publishers Inc., 2002.<br />
Sheridan, M.B. ‘Mexico’s Calderón tells Congress he needs U.S. help in fighting drug<br />
wars’. The Washington Post, 21 May <strong>2010</strong>.<br />
Small Arms Survey. Guns and the City. Geneva: Small Arms Survey, 2007.<br />
Stavrou, A. Crime in Nairobi: Results <strong>of</strong> a Citywide Victim Survey. Safer City Series #4.<br />
Nairobi: United Nations Human Settlements Programme (UN-Habitat), 2002.<br />
Stevens, A. and Bewley-Taylor, D. with contributions from Dreyfus, P. Drug markets<br />
and urban violence: Can tackling one reduce the other? The Beckley Foundation<br />
Drug Policy Programme. 2009. Available online: www.beckleyfoundation.<br />
org / pdf / report_15.pdf.<br />
Strategic Forecasting, Inc. (STRATFOR). Mexican Drug Cartels: Government Progress<br />
and Growing Violence. Austin, Texas: STRATFOR, 2008.<br />
Tedesco, L. Urban Violence: A Challenge to Institutional Strengthening the Case <strong>of</strong> Latin<br />
America. FRIDE Working Paper 78. Madrid: FRIDE, 2009.
Tedesco, L. Latin American States – Failed or Evolving? FRIDE Working Paper 37.<br />
Madrid: FRIDE, 2007.<br />
United Nations (UN). Background paper. Workshop on Practical Approaches to<br />
Preventing Urban Crime, Twelfth UN Congress on Crime Prevention and Criminal<br />
Justice, Salvador, Brazil, <strong>2010</strong>.<br />
UN. ‘The Chronicle Interview: Miloon Kothari’, in UN Chronicle, Issue 1, 2006.<br />
Available online: www.un.org / Pubs / chronicle/2006/issue1/0106p44.html.<br />
United Nations Development Programme (UNDP). Human Development <strong>Report</strong><br />
2009. New York: UNDP, 2009. Available online: http://hdr.undp.org / en / report<br />
s / global / hdr2009/.<br />
UNDP. Build your own tables – Human Development <strong>Report</strong> 2009. Available online:<br />
http://hdrstats.undp.org / en / buildtables / rc_report.cfm.<br />
United Nations Economic Commission for Latin America and the Caribbean<br />
(ECLAC). Social Panorama <strong>of</strong> Latin America. ECLAC Briefing Paper, November<br />
2009. Available online: www.cepal.org / cgi-bin / getProd.asp?xml=/publicaciones/<br />
xml/0/37840/P37840.xml&xsl=/dds / tpl-i / p9f.xsl&base=/tpl-i / top-bottom.xslt.<br />
UN Human Settlements Programme (UN-Habitat). Global <strong>Report</strong> on Human<br />
Settlements 2009: Planning Sustainable Cities. Nairobi : UN-Habitat, 2009.<br />
UN-Habitat. The Challenge <strong>of</strong> Slums – Global <strong>Report</strong> on Human Settlements 2003.<br />
Nairobi : UN-Habitat, 2003.<br />
UN-Habitat. Global <strong>Report</strong> on Human Settlements 2007: Enhancing Urban Safety and<br />
Security. Nairobi: UN-Habitat, 2007.<br />
UN Office on Drugs and Crime (UNODC). Crime and Development in Central<br />
America, Caught in the <strong>Cross</strong>fire. Vienna: UNODC, 2007.<br />
United States Department <strong>of</strong> Justice. National Drug Threat Assessment <strong>2010</strong>.<br />
Washington DC: US Department <strong>of</strong> Justice, National Drug Intelligence Centre,<br />
<strong>2010</strong>.<br />
United States Department <strong>of</strong> State. <strong>2010</strong> <strong>International</strong> Narcotics Control Strategy <strong>Report</strong>.<br />
Washington DC: US Department <strong>of</strong> State, Bureau <strong>of</strong> <strong>International</strong> Narcotics and<br />
Law Enforcement Affairs, <strong>2010</strong>. Available online: www.state.gov / p / inl / rls / nrcrpt/<br />
<strong>2010</strong>/vol1/137194.htm.<br />
<strong>World</strong> Bank. Dhaka: Improving Living Conditions for the Urban Poor. Bangladesh<br />
Development Series, Paper No. 17. Dhaka: <strong>World</strong> Bank, June 2007.<br />
Youth as Peacebuilders, Medellín, Colombia. Interview available online: www.childrenyouthaspeacebuilders.ca<br />
/ pdfs / kind/24.pdf.<br />
<strong>World</strong> <strong>Disasters</strong> <strong>Report</strong> <strong>2010</strong> – Focus on urban risk<br />
93
CHAPTER 5<br />
94
Urban risk to health<br />
The rapid rise in the number <strong>of</strong> people living in urban centres and cities around the<br />
globe brings with it new forms <strong>of</strong> urban risk in the health sector. It is a tragic irony,<br />
but millions <strong>of</strong> people continue to be exposed daily to diseases that medical science has<br />
long known how to prevent and / or to cure. Acute respiratory infections, dysentery and<br />
diarrhoea, largely under control in cities in high-income countries, continue to exact<br />
a significant toll on the health and well-being <strong>of</strong> a disproportionate number <strong>of</strong> those<br />
who live in the sprawling slums <strong>of</strong> the developing world. Tuberculosis (TB) is rampant<br />
in many cities worldwide regardless <strong>of</strong> their overall economic status. At the same time,<br />
more recent non-infectious conditions such as diabetes, heart disease and depression,<br />
which are linked to urban lifestyles, threaten both rich and poor in all countries. On<br />
<strong>World</strong> Health Day in April <strong>2010</strong>, Jacob Kumaresan, director <strong>of</strong> the <strong>World</strong> Health<br />
Organization’s Centre for Health Development based in Kobe, Japan, said: “While<br />
urban living continues to <strong>of</strong>fer many opportunities, including potential access to better<br />
healthcare, today’s urban environments can concentrate health risks and introduce<br />
new hazards.”<br />
The <strong>World</strong> Health Organization (WHO) cites a multitude <strong>of</strong> health challenges in<br />
modern cities, relating to “water, environment, violence and injury, non-communicable<br />
diseases (cardiovascular diseases, cancers, diabetes and chronic respiratory diseases),<br />
unhealthy diets and physical inactivity, harmful use <strong>of</strong> alcohol as well as the<br />
risks associated with disease outbreaks. City living and its increased pressures <strong>of</strong> mass<br />
marketing, availability <strong>of</strong> unhealthy food choices and accessibility to automation and<br />
transport all have an effect on lifestyle that directly affect health.”<br />
The conundrum <strong>of</strong> urban living is that, on the one hand, in well-governed cities where<br />
health and social services are available alongside safe and well-functioning infrastructure,<br />
people can aspire to live to a ripe old age. People living in the progressive city<br />
environment <strong>of</strong> Porto Alegre in Brazil have a life expectancy <strong>of</strong> 76 years. But even in<br />
the United Kingdom, a member <strong>of</strong> the G8, variations in urban wealth and employment<br />
seem to be key determinants <strong>of</strong> good health and life expectancy. Research by the<br />
Chartered Society <strong>of</strong> Physiotherapy has found that men live an average <strong>of</strong> 69.3 years in<br />
the city <strong>of</strong> Glasgow compared to 80.8 years in the more affluent environs <strong>of</strong> London’s<br />
Chelsea and Kensington. WHO has cited “the extremely poor health, more characteristic<br />
<strong>of</strong> a poor developing country” <strong>of</strong> the inner city poor as a factor in reducing overall<br />
life expectancy for the United States.<br />
Nonetheless, city life can bring significant health benefits. Cities where environmental<br />
health hazards are reduced through provision <strong>of</strong> a safe water supply, sanitation,<br />
waste management and adequate shelter, and in which pollution is monitored and<br />
controlled, have lower mortality and morbidity rates. People in well-organized urban<br />
<strong>World</strong> <strong>Disasters</strong> <strong>Report</strong> <strong>2010</strong> – Focus on urban risk<br />
Photo opposite page:<br />
Living in towns and<br />
cities can bring<br />
notable health<br />
benefits, but urban<br />
areas can also attract<br />
infectious disease,<br />
while non-infectious<br />
conditions such as<br />
diabetes and heart<br />
disease are linked to<br />
urban lifestyles and<br />
threaten city dwellers<br />
all over the world.<br />
© Claudia Janke/<br />
British <strong>Red</strong> <strong>Cross</strong><br />
95
CHAPTER 5<br />
96<br />
environments can generally expect to live longer as they will also be well informed<br />
about the health benefits <strong>of</strong> not smoking, hygiene, good diet and exercise.<br />
The other end <strong>of</strong> the urban health spectrum can be found in low- and middleincome<br />
countries where most <strong>of</strong> the world’s impoverished urban dwellers live. In<br />
households lacking basic shelter services – water supply and sanitation in particular<br />
– the prevalence rate <strong>of</strong> diarrhoea among urban children soars, averaging 38<br />
per cent in Pakistan, 33.3 per cent in Cameroon, 23.9 per cent in the Democratic<br />
Republic <strong>of</strong> the Congo and 32.3 per cent in Jordan. Diarrhoeal diseases account for<br />
nearly 2 million deaths out <strong>of</strong> a total <strong>of</strong> almost 10 million among children under<br />
the age <strong>of</strong> 5. There are parallels here with what we see unfolding in relation to the<br />
impact <strong>of</strong> natural disasters on urban centres and the dramatic differences in fatalities<br />
between low- and high-income nations (as highlighted in Chapter 1). Over the<br />
period from 1990 to 2006, industrialized countries saw under-5 child mortality<br />
rates drop from 10 to 6 per 1,000 live births, while in developing countries overall<br />
the reduction was only 103 to 79, a staggering gap which captures the urban risk<br />
divide in health.<br />
In 2008, the average urban centre in Australia would not have experienced an infant<br />
mortality rate (IMR) <strong>of</strong> more than 5 per 1,000 live births, whereas, in the same year,<br />
the Nairobi Urban Health and Demographic Surveillance System, which covers a<br />
demographic surveillance area that straddles the two slums <strong>of</strong> Korogocho and Viwandani<br />
with a combined population <strong>of</strong> 73,661, found an IMR <strong>of</strong> 87 per 1,000 live births,<br />
above the national average <strong>of</strong> 81. It is not the fact <strong>of</strong> urban life as such that poses the<br />
problem for health; rather, it is the way in which these cities are governed and the<br />
application, or not, <strong>of</strong> appropriate public health and housing policies which determine<br />
the health consequences for the inhabitants.<br />
Hunger and malnutrition in urban settings result not only from food insecurity (see<br />
Box 5.1) but are also a consequence <strong>of</strong> environmental hazards and shelter deprivation.<br />
Unhealthy living conditions in urban slums create a vicious circle whereby the<br />
likelihood <strong>of</strong> a child contracting diarrhoea, an acute respiratory tract infection and / or<br />
malaria are greatly increased by poor waste management and non-existent water treatment<br />
systems. According to current research almost half <strong>of</strong> all nutritional problems are<br />
linked to slum living conditions. Malnutrition is particularly lethal in combination<br />
with infectious diseases such as pneumonia, malaria, measles and diarrhoeal diseases<br />
– the major killer diseases affecting children. It is an underlying factor in over half <strong>of</strong><br />
all child deaths.<br />
Data cited by the United Nations Human Settlements Programme (UN-Habitat)<br />
show that the prevalence <strong>of</strong> child malnutrition can <strong>of</strong>ten be higher in urban areas than<br />
in rural areas in countries such as Benin and the Democratic Republic <strong>of</strong> the Congo.<br />
In the case <strong>of</strong> the latter, “46 per cent <strong>of</strong> children living in non-durable urban housing
are malnourished, compared with 16 per cent in rural areas […] in India, 45 per cent<br />
<strong>of</strong> children from households without adequate sanitation are malnourished according<br />
to recent Demographic and Health Survey data”.<br />
Today, over 25 per cent <strong>of</strong> the world’s urban population live in informal settlements<br />
or slums. A slum household is defined by UN-Habitat as lacking one or more <strong>of</strong><br />
the following: durable housing; sufficient living area; access to water and sanitation;<br />
and secure tenure. There are no reliable statistics available for this last indicator.<br />
Boosted by immigration from rural areas and continuing high birth rates, today’s<br />
UN-Habitat estimate <strong>of</strong> 827.6 million slum dwellers is expected to hit a total <strong>of</strong> 889<br />
million by 2020 assuming government efforts to tackle the issue are maintained and<br />
stepped up.<br />
In many cases and especially in the developing world, urbanization has taken place<br />
so quickly that governments have struggled to keep up when it comes to providing<br />
needed infrastructure. When people are crowded together in unsanitary conditions,<br />
disease thrives. A 2005 report in The Lancet estimated that nearly half the urban population<br />
in Africa, Asia and Latin America has one or more <strong>of</strong> the main communicable<br />
diseases associated with inadequate water and sanitation – including diarrhoea and<br />
worm infections. Even in the developed world, cities can attract infectious disease.<br />
TB incidence, for example, is much higher in big cities, even in developed countries.<br />
New York has four times the national average TB infection rate. In some parts <strong>of</strong> London,<br />
TB is more common than in China.<br />
But infectious diseases are only a part – and an increasingly small part on a global<br />
scale – <strong>of</strong> the health challenge facing urban dwellers. Non-communicable diseases and<br />
medical conditions, such as heart disease and diabetes, kill 35 million people a year.<br />
According to a 2009 WHO survey, the leading global risks for mortality in the world<br />
are high blood pressure (responsible for 13 per cent <strong>of</strong> deaths globally), tobacco use<br />
(9 per cent), high blood glu cose (6 per cent), physical inactivity (6 per cent) and overweight<br />
and obesity (5 per cent). These risks are responsible for exposure to chronic<br />
diseases such as heart disease, diabetes and cancers.<br />
Countries in South-East Asia and sub-Saharan Africa are particularly affected by the<br />
burden <strong>of</strong> disease as measured by WHO in disability adjusted life years (DALYs).<br />
These are underweight (6 per cent <strong>of</strong> global DALYs) and unsafe sex (5 per cent), followed<br />
by alcohol use (5 per cent) and unsafe water (4 per cent). While the other three<br />
particularly affect South-East Asia and sub-Saharan Africa, alco hol use shows a unique<br />
geographic and sex pat tern, with its burden highest for men in Africa, in middleincome<br />
countries in the Americas and in some high-income countries.<br />
On current trends, non-communicable diseases – those that are not infectious and do<br />
not spread from person to person – will be responsible for 75 per cent <strong>of</strong> all deaths<br />
<strong>World</strong> <strong>Disasters</strong> <strong>Report</strong> <strong>2010</strong> – Focus on urban risk<br />
97
98<br />
within a decade, according to the Global Risks <strong>2010</strong> report by the <strong>World</strong> Economic<br />
Forum. In developing countries, chronic ‘lifestyle’ diseases are increasingly the cause<br />
<strong>of</strong> premature death in urban centres. In Kenya, 17 per cent <strong>of</strong> people living in urban<br />
slums suffer from diabetes or hypertension and cannot get screening services or drugs.<br />
Many <strong>of</strong> the factors spurring this growth in non-communicable disease can be linked<br />
directly to city living. In particular, obesity, which is a major risk factor in heart disease<br />
and diabetes, is becoming increasingly common, fuelled by more sedentary lifestyles<br />
and the ready availability <strong>of</strong> cheap, fattening, but not particularly nutritious,<br />
fast foods.<br />
Research shows that the more urbanized a developing country becomes, the higher<br />
the consumption <strong>of</strong> sweeteners and fats. In <strong>World</strong> Development, B.M. Popkin noted<br />
that “a shift from 25 per cent to 75 per cent urban population in very low-income<br />
countries is associated with an increase <strong>of</strong> approximately four percentage points <strong>of</strong> total<br />
energy from fat and an additional 12 percentage points <strong>of</strong> energy from sweeteners”. In<br />
both urban Brazil and South Africa, those with a higher education are less likely to be<br />
overweight.<br />
In short, cities may <strong>of</strong>ten <strong>of</strong>fer the best <strong>of</strong> what life has to <strong>of</strong>fer, but they come with a<br />
heavy health warning.<br />
Box 5.1 Hunger is back with a vengeance<br />
In March 2007, a day’s labour in Bangladesh<br />
could fund the purchase <strong>of</strong> 5 to 7 kilograms <strong>of</strong><br />
rice but 12 months later a survey found that a<br />
day’s wage could purchase only 3.7 to 5kg<br />
<strong>of</strong> rice.<br />
In Kenya, 4.1 million urban poor were<br />
classified as ‘highly food insecure’ in March<br />
last year as rising prices combined with floods,<br />
drought and conflict to force slum dwellers to<br />
reduce food consumption and live with chronic<br />
hunger. The price <strong>of</strong> maize rose by 130 per<br />
cent in Nairobi.<br />
The economic slowdown on top <strong>of</strong> stubbornly<br />
high food prices, despite a plentiful global<br />
food supply, added 100 million people to<br />
the ranks <strong>of</strong> the hungry last year. In May <strong>2010</strong>,<br />
the Food and Agriculture Organization <strong>of</strong> the<br />
United Nations (FAO) launched an online<br />
petition for people to express their anger about<br />
hunger (www.1billionhungry.org), as for the<br />
first time in human history over 1 billion people<br />
are estimated to go hungry around the world.<br />
The breakdown <strong>of</strong> 1,017 million hungry is:<br />
642 million in Asia and the Pacific; 265 million<br />
in sub-Saharan Africa; 53 million in Latin<br />
America and the Caribbean; 42 million in the<br />
Near East and North Africa; and 15 million<br />
people in developed countries. FAO estimates<br />
that global agricultural production needs to<br />
grow by 70 per cent if the estimated 9 billion<br />
people that will inhabit the planet in 2050 are<br />
to be fed.<br />
Surveys by the <strong>World</strong> Food Programme<br />
(WFP), the United Nations Children’s Fund<br />
(UNICEF) and other agencies underpin<br />
<strong>International</strong> Monetary Fund statistics which
show that prices <strong>of</strong> imported rice and local<br />
cereals have risen by 230 to 350 per cent<br />
since early 2008 as the worldwide economic<br />
crisis kicked in with disastrous consequences<br />
for both the urban and the rural poor.<br />
The perception <strong>of</strong> hunger as a largely rural<br />
phenomenon is being challenged increasingly<br />
by statistics which show how malnutrition is<br />
taking root in urban centres especially among<br />
children.<br />
A recent review by UN-Habitat <strong>of</strong> demographic<br />
and health survey data collected between<br />
1990 and 2007 in various countries<br />
in Africa, Asia and Latin America and the<br />
Caribbean found that there has been serious<br />
malnutrition in these regions’ urban and rural<br />
areas since 1990. In several African countries<br />
more than four out <strong>of</strong> ten children suffered from<br />
stunted development.<br />
WFP cites one major lesson learned from<br />
its urban interventions during the high food<br />
price crisis: “Food insecurity due to the high<br />
food prices in urban populations was caused<br />
by restricted food access rather than insufficient<br />
availability.” WFP considers that targeted<br />
food assistance and non-food-based interventions<br />
(cash and vouchers) are more appropriate<br />
in urban settings.<br />
However, to date no systematic approach<br />
has been universally adopted to tackle endemic<br />
hunger among the urban poor to ensure that<br />
available food becomes affordable for those<br />
in need. In recent times there have been food<br />
protests in Burkina Faso, Cameroon, Côte<br />
d’Ivoire, Egypt, Haiti, Indonesia, Mauritania,<br />
the Philippines and Senegal. Some <strong>of</strong> these<br />
protests have turned violent. Some food-exporting<br />
nations have significantly reduced food exports<br />
to preserve their domestic supply.<br />
Frank Orzechowski <strong>of</strong> Catholic Relief<br />
Services, a major food distributor to the urban<br />
poor, told the 10th <strong>International</strong> Food Aid<br />
Conference two years ago: “In the 34 years<br />
that I have been involved in the grain trade<br />
I’ve never seen conditions such as these. There<br />
is a danger that the situation will spin out <strong>of</strong><br />
control in large parts <strong>of</strong> the developing world.<br />
Particularly vulnerable are fledgling democracies<br />
that have recently adopted free market<br />
economies.”<br />
He gave his audience a sober reminder<br />
<strong>of</strong> what happened in Liberia “where in 1979<br />
riots in response to rising rice prices were<br />
eventually followed by a coup that submerged<br />
the country under a period <strong>of</strong> dictatorship and<br />
bloodshed that lasted over 20 years”. �<br />
Returning to the 19th century<br />
Crowding people together without proper water supplies, sewage and sanitation<br />
increases the risk <strong>of</strong> transmission <strong>of</strong> communicable diseases, but it was only in the 19th<br />
century that doctors and medical researchers made the necessary connection between<br />
living conditions and disease. Over the course <strong>of</strong> the 1800s, London was repeatedly<br />
swept by epidemics. In 1839, for every person who died <strong>of</strong> old age or violence in Britain,<br />
eight died <strong>of</strong> disease. At the time, nearly one infant in three in England failed to<br />
reach the age <strong>of</strong> 5 and mortality rates in large British cities were much higher than the<br />
national average. The misery <strong>of</strong> 19th century city life for the majority was captured in<br />
novels such as Oliver Twist and Hard Times by author Charles Dickens.<br />
Fast-forward to the 21st century and much <strong>of</strong> the burden <strong>of</strong> ill health is shouldered<br />
by those who live in the slums <strong>of</strong> some <strong>of</strong> the developing world’s largest cities. In the<br />
<strong>World</strong> <strong>Disasters</strong> <strong>Report</strong> <strong>2010</strong> – Focus on urban risk<br />
99
CHAPTER 5<br />
100<br />
slums <strong>of</strong> the Indian capital, New Delhi, many health indices, such as infant mortality,<br />
are worse than in rural areas, which were long considered to suffer the worst ravages <strong>of</strong><br />
poverty and deprivation. Like other big developing country metropolises, New Delhi<br />
attracts migrants from rural areas in search <strong>of</strong> work and what they hope will be a better<br />
life. For instance, many were attracted to the city by the prospect <strong>of</strong> jobs in construction<br />
as the city set about putting in place the necessary infrastructure for the Asian<br />
Games in 1982. Ironically, many <strong>of</strong> those workers who settled with their families in<br />
the Pashta slums on the banks <strong>of</strong> the Yamuna River have now found themselves among<br />
the 150,000 people who have been made homeless as the courts ordered a 40-hectare<br />
(100-acre) strip along the Yamuna to be cleared for a riverside promenade close to a key<br />
site for <strong>2010</strong>’s Commonwealth Games.<br />
In New Delhi, slum dwellers make up over 40 per cent <strong>of</strong> the population. People<br />
defecate outside in the fields or the drains, according to Asha, a non-governmental<br />
organization (NGO) that works with slum dwellers to improve their living conditions.<br />
Residents are exposed to stagnant water, open drains, floods, rubbish, and noise and<br />
air pollution. It is little wonder that people get sick. Open sewers are just one <strong>of</strong> the<br />
unsanitary aspects <strong>of</strong> slum conditions. In addition to helping the spread <strong>of</strong> dysentery,<br />
cholera and other preventable diseases, the water contains parasites such as hookworm,<br />
whipworm and roundworm that infect the slum dwellers and children in particular.<br />
In a country with a fast-growing economy and a middle class larger than that <strong>of</strong> the<br />
United States, New Delhi is also a glaring example <strong>of</strong> the health inequalities to be<br />
found in big cities. “There is a stark dichotomy here. On the one hand, Delhi has a<br />
good health infrastructure with excellent health facilities, which are, in fact, better than<br />
other parts <strong>of</strong> the country. For instance, it is possible to have a heart transplant here, at<br />
a cost. Yet, the urban poor cannot access even the most basic <strong>of</strong> healthcare facilities,”<br />
said Thomas Chandy <strong>of</strong> Save the Children India.<br />
Sometimes, people living in slums and informal settlements do not even show up<br />
on <strong>of</strong>ficial population statistics, so it is little surprise if health and other services are<br />
also not provided. The population <strong>of</strong> the Haitian capital Port-au-Prince was 700,000,<br />
according to the last <strong>of</strong>ficial census taken in 2003. But the real number is more than<br />
three times higher. “You see people moving for economic need into unplanned periurban<br />
environments, with a great deal <strong>of</strong> overcrowding, re-creating the conditions<br />
<strong>of</strong> the 19th century. It is as if none <strong>of</strong> the lessons <strong>of</strong> the 19th century health movement<br />
had been learned,” said Michael J. Ryan, director <strong>of</strong> WHO’s Global Alert and<br />
Response department.<br />
Children bear the brunt<br />
Children are most at risk from the precarious sanitary and health conditions reigning<br />
in slum areas. UN-Habitat’s State <strong>of</strong> the <strong>World</strong>’s Cities 2006/7 report states that
pneumonia, diarrhoea, malaria, measles and HIV / AIDS account for more than half <strong>of</strong><br />
the deaths <strong>of</strong> slum children under 5 and that the prevalence <strong>of</strong> these diseases is largely<br />
due to bad living conditions. Children from the highest income groups in slums still<br />
have higher rates <strong>of</strong> diarrhoea than children <strong>of</strong> the poorest rural families, because they<br />
are exposed to contaminated water and food. Pneumonia and diarrhoea each kill more<br />
than 2 million children in developing countries annually.<br />
According to Asha, New Delhi’s children suffer from vitamin-A deficiencies that<br />
can lead to blindness, and tuberculosis, diarrhoea and respiratory tract infections<br />
are very common. The mortality rates for the under-5s are among the highest in the<br />
world at 142 per 1,000 live births. Maternal health is poor and women frequently<br />
die in pregnancy or childbirth due to lack <strong>of</strong> access to suitable facilities or trained<br />
midwives.<br />
Nobody knows with any precision how many street children there are around the<br />
globe. They hustle to get by in difficult conditions and are largely cut <strong>of</strong>f from family<br />
support structures. A generally quoted UNICEF figure <strong>of</strong> 100 million dates back to<br />
1989 with an estimated 10 million <strong>of</strong> those actually sleeping on the street. They live<br />
a precarious existence on the margins <strong>of</strong> urban life, constantly exposed to violence,<br />
disease, pollution and the threat <strong>of</strong> exploitation. Many <strong>of</strong> them indulge in substance<br />
abuse. Respiratory disease and skin conditions are rife among this population and they<br />
generally lack access to healthcare. Though research is thin on the subject, their condition<br />
is thought to be the result <strong>of</strong> many factors such as increasing urbanization and<br />
migration, poverty, food insecurity, HIV / AIDS and other factors which contribute to<br />
the disruption <strong>of</strong> normal family life.<br />
Disease goes global – the pandemic threat<br />
Eleven years ago, WHO observed that: “In the Middle Ages deadly plagues were<br />
shipped from one continent to another – carried by flea-infested rats on board ships.<br />
Today they travel by plane – carried by airline passengers from one corner <strong>of</strong> the earth<br />
to another. And all in a matter <strong>of</strong> hours.” The number <strong>of</strong> international airline passengers<br />
commuting between urban centres has jumped since then from 1.4 billion to 2.2<br />
billion. The rapidity and frequency <strong>of</strong> inter-city commuting has pr<strong>of</strong>ound implications<br />
for public health.<br />
Deadly airborne diseases such as pneumonic plague, influenza and TB can easily spread<br />
in crowded airport lounges, on a packed plane or by passengers after their return home.<br />
The poliovirus was imported into Canada in 1978 and 1992 by travellers from western<br />
Europe. Disease has gone global and cities are an important link in the chain. Large<br />
urban areas act as incubators for new diseases, creating the ideal conditions first for<br />
them to develop and then to travel. They <strong>of</strong>fer a springboard for new international<br />
epidemics or even global pandemics.<br />
<strong>World</strong> <strong>Disasters</strong> <strong>Report</strong> <strong>2010</strong> – Focus on urban risk<br />
101
Getting public health<br />
information to all<br />
urban dwellers,<br />
including those in<br />
remote or informal<br />
settlements, is essential<br />
to stop the spread<br />
<strong>of</strong> disease. Here a<br />
Malagasy <strong>Red</strong> <strong>Cross</strong><br />
Society volunteer tells<br />
inhabitants <strong>of</strong> the<br />
capital, Antananarivo,<br />
about a vaccination<br />
campaign for children.<br />
© Benoit<br />
Matsha-Carpentier/IFRC<br />
102<br />
New research suggests that HIV may have been around in central Africa for far longer<br />
than was initially suspected. It was possibly only with the growth <strong>of</strong> urban centres, such<br />
as Kinshasa, the capital <strong>of</strong> the Democratic Republic <strong>of</strong> the Congo, that the disease took<br />
root and then picked up the momentum to spread quickly around the world. In most<br />
parts <strong>of</strong> the world, HIV / AIDS is a predominantly urban phenomenon. UNAIDS, the<br />
UN’s Joint Programme on HIV / AIDS, estimates that, on average, HIV is 1.7 times<br />
more prevalent in urban than in rural areas. This is largely explained by the fact that<br />
many <strong>of</strong> the risk factors, such as injecting drug use, are also more common in cities. Sex<br />
workers or men who have sex with other men, two other high-risk groups, are also more<br />
numerous in cities, if only because <strong>of</strong> the higher population density. But even in sub-<br />
Saharan Africa, where HIV is transmitted principally through unprotected heterosexual<br />
sex, research shows that urban women are more likely to be infected than rural women.<br />
New diseases can emerge by jumping the species barrier from animals to humans.<br />
This was certainly the case in one <strong>of</strong> the two diseases that have most alarmed international<br />
health <strong>of</strong>ficials in recent years – the H5N1 flu virus, more commonly known<br />
as ‘bird flu’ or ‘avian flu’, which is believed to have originated in wild fowl. It was also<br />
probably true <strong>of</strong> the other, SARS (severe acute respiratory syndrome). Both diseases<br />
demonstrated how dense, urban living conditions provide the ideal breeding ground<br />
for new viruses.
SARS caused near global panic for a while after it erupted in mainland China and then<br />
Hong Kong in late 2002 and early 2003. It has been called the first disease <strong>of</strong> the internet<br />
age because global communications helped fan fears about its potentially deadly<br />
impact. In the end only some 8,000 people caught the respiratory disease, mainly<br />
in South-East Asia and Canada, but it was fatal in nearly 900 cases. The newness <strong>of</strong><br />
the disease, the fact that it was initially little understood and its high fatality rate,<br />
compared with the one in 1,000 <strong>of</strong> normal seasonal influenza, all stoked the worldwide<br />
anxiety. <strong>International</strong> flights were cancelled and schools, shops and <strong>of</strong>fices shut in<br />
heavily affected cities such as Hong Kong and Singapore.<br />
People in Hong Kong stopped going out and donned face masks. Sales <strong>of</strong> bottled<br />
vinegar soared because it was believed to act as an effective disinfectant. Tourism in<br />
the most affected areas slumped. Switzerland even barred jewellers from Hong Kong<br />
from taking part in the annual international jewellery fair at Basle, and the women’s<br />
soccer <strong>World</strong> Cup was moved from China to the United States. Hong Kong’s economy<br />
shrank 2.6 per cent and Singapore’s by 2 per cent in the first half <strong>of</strong> 2003. Overall, the<br />
Asian Development Bank estimated losses in tourism revenue at nearly US$ 15 billion,<br />
or 0.5 per cent <strong>of</strong> gross domestic product.<br />
Fortunately, the H5N1 virus, with a fatality rate <strong>of</strong> some 60 per cent – far higher than<br />
SARS – is not easily transmitted between humans. Since first appearing in China and<br />
Viet Nam in 2003, it has infected some 500 people, mainly in South-East Asia and<br />
Egypt. Nearly 300 deaths have been confirmed. The disease is now endemic in poultry<br />
in certain parts <strong>of</strong> the world. Worryingly, cities <strong>of</strong> South-East Asia – where the keeping<br />
<strong>of</strong> live poultry and live poultry markets are common – <strong>of</strong>fer a pool <strong>of</strong> possible future<br />
infection and raise the spectre that the virus could yet mutate and pose a new threat.<br />
If the H5N1 virus were as contagious as the latest new influenza bug – H1N1 –<br />
then the impact in terms <strong>of</strong> loss <strong>of</strong> life could be catastrophic. H1N1, which was first<br />
detected in Mexico in April 2009, has been among the fastest-spreading viruses ever<br />
recorded. By the time WHO declared a global pandemic a mere two months later,<br />
74 countries and territories had reported infections. As <strong>of</strong> April <strong>2010</strong>, cases had been<br />
reported in 214 countries, including 17,798 deaths. Again, cities speeded contagion<br />
locally, with international travel doing the rest.<br />
“In terms <strong>of</strong> risk management human populations are now forced to live in a way that<br />
provides a wonderful point <strong>of</strong> amplification for disease and then travel and trade and<br />
the whole connection between these urban centres is creating a pathway to globalization<br />
for these diseases,” noted WHO’s Ryan.<br />
Perhaps one <strong>of</strong> the best examples <strong>of</strong> how urban living can stoke epidemics is the tropical<br />
disease dengue fever. The incidence <strong>of</strong> dengue, whose effects can range from mild fever to<br />
fatal haemorrhaging, has grown dramatically worldwide to the point that some 2.5 billion<br />
<strong>World</strong> <strong>Disasters</strong> <strong>Report</strong> <strong>2010</strong> – Focus on urban risk<br />
103
CHAPTER 5<br />
104<br />
people – two-fifths <strong>of</strong> the world’s population – are now at risk, according to WHO.<br />
The organization estimates that there may be as many as 50 million infections every year,<br />
with most going unreported. In the Americas there were more than 890,000 reported<br />
cases <strong>of</strong> dengue in 2007, <strong>of</strong> which 26,000 were <strong>of</strong> the <strong>of</strong>ten-fatal haemorrhagic fever type.<br />
Yet 50 years ago, the disease was virtually unknown. It first appeared in Manila in the<br />
Philippines in 1953 and had jumped to Bangkok, Thailand by the end <strong>of</strong> the decade.<br />
Before 1970, only nine countries had experienced epidemics <strong>of</strong> the severe haemorrhagic<br />
fever, which kills in almost 25 per cent <strong>of</strong> cases. By 1995, this number had risen<br />
to around 40. The disease is now endemic in more than 100 countries in Africa, the<br />
Americas, the eastern Mediterranean, South-East Asia and the western Pacific. Not<br />
only is the number <strong>of</strong> cases increasing, as the disease reaches new areas, but so too is the<br />
number <strong>of</strong> serious outbreaks. In 2007, Venezuela reported over 80,000 cases, including<br />
more than 6,000 cases <strong>of</strong> haemorrhagic fever.<br />
The disease is spread by the Aedes aegypti mosquito, which has come to thrive in tropical<br />
urban environments. It breeds in and around city homes, in ro<strong>of</strong> gutters, beneath<br />
refrigerators, under flowerpots and anywhere there is stagnant water, including in waste<br />
packaging and discarded food tins. Used tyres are a favourite breeding ground. With<br />
globalization, the mosquito also gets to travel easily. Dengue is thought to have arrived<br />
in Brazil, now one <strong>of</strong> the most affected countries, in the rims <strong>of</strong> tyres exported from Asia.<br />
Cities change us<br />
With 70 per cent <strong>of</strong> the global population forecast to be living in urban areas by 2050,<br />
the predominant lifestyle around the world will become increasingly an urban one. But<br />
what are the implications <strong>of</strong> an urban lifestyle for health? It is a mixed picture whereby<br />
many improvements in basic health indicators, such as infant and child mortality rates<br />
and life expectancy, have to be balanced against health threats which stem directly from<br />
urban living.<br />
The major risk factors for non-communicable disease are an unhealthy diet, lack <strong>of</strong><br />
exercise, smoking and excessive use <strong>of</strong> alcohol: all <strong>of</strong> them fostered one way or another<br />
by urban living.<br />
Perhaps the most visible and most health-threatening manifestation <strong>of</strong> the risk factors<br />
is obesity. Being significantly overweight greatly increases the chances <strong>of</strong> developing<br />
type 2 diabetes, heart and respiratory problems and even some forms <strong>of</strong> cancer.<br />
According to WHO, over 1.6 billion adults are overweight and nearly one in four is<br />
obese. By 2015, the figure for those overweight will have risen to 2.3 billion. As an<br />
example <strong>of</strong> the likely impact on health, WHO forecasts that the number <strong>of</strong> people<br />
with obesity-related diabetes will double to 300 million between 1998 and 2025 –<br />
with three-quarters <strong>of</strong> that growth projected in the developing world.
Urban life affects the way people work, move around and relax. Office jobs require less<br />
physical exertion than farm work, while getting around in a city is more likely to involve<br />
some form <strong>of</strong> transport – <strong>of</strong>ten door to door, if it is a car or motorcycle – rather than<br />
walking. Pressure to build within urban areas can leave less and less space for parks and<br />
areas <strong>of</strong> recreation. “What urbanization does is to change behaviour patterns,” noted<br />
WHO’s Kumaresan. “People have different eating habits, different levels <strong>of</strong> physical<br />
activity. If there are no fields or parks, kids have nowhere to run around and play. These<br />
are some examples <strong>of</strong> what urbanization does to our changing patterns <strong>of</strong> lifestyle.”<br />
Although there is no firm statistical correlation between rising urbanization and the<br />
growth <strong>of</strong> non-communicable diseases, there is no doubt that both have been advancing<br />
almost hand in hand. At the beginning <strong>of</strong> the last century, only some 10 per cent <strong>of</strong> the<br />
world’s population was urban, and infectious diseases, such as malaria and tuberculosis,<br />
were still by far the biggest causes <strong>of</strong> premature death among adults. But by the final decades<br />
<strong>of</strong> the 20th century, nearly half <strong>of</strong> the world already lived in urban centres, some too<br />
small to be considered cities, and the burden <strong>of</strong> early death had also changed radically.<br />
In the developed countries <strong>of</strong> North America and Europe, non-communicable diseases<br />
had long been fatal, which is why they used to be known as the ‘diseases <strong>of</strong> the rich’.<br />
But by the beginning <strong>of</strong> the 21st century, 60 per cent <strong>of</strong> premature deaths around<br />
the world were being caused by non-communicable disease. In Latin America and<br />
the Carib bean, they account for two out <strong>of</strong> every three deaths, according to the Pan<br />
American Health Organization (PAHO).<br />
New ways, new diet<br />
The Gulf region is a case in point. Over the last 30 years it has experienced remarkable<br />
economic growth, modernization and urbanization. As the population has become<br />
richer and increasingly urban, diets have changed and now include a greater intake <strong>of</strong><br />
processed and fast foods, rich in fats, saturated fats, salt and sugars, all <strong>of</strong> which fuel<br />
obesity. The percentage <strong>of</strong> people who are overweight in Kuwait, the United Arab<br />
Emirates and Egypt ranges from 68 per cent to 74 per cent.<br />
In the Americas, the story is similar. The Latin American and Caribbean region is one<br />
<strong>of</strong> the most urbanized in the world, with more than three-quarters <strong>of</strong> its 433 million<br />
people living in towns and cities. Eating habits are changing, with people consuming<br />
less fruit, fewer vegetables and more processed food. According to PAHO, 50 to 60<br />
per cent <strong>of</strong> adults in Latin America and the Caribbean are overweight or obese. Even<br />
more worrying for the future, the same goes for 7 to 12 per cent <strong>of</strong> children under 5.<br />
At the same time, 30 to 60 per cent <strong>of</strong> the population do not take the minimum level<br />
<strong>of</strong> exercise – 30 minutes a day – recommended by WHO. Predictably, in the past few<br />
years, the region has witnessed an explosion in chronic non-communicable disease<br />
– cancers, hypertension and heart problems. According to WHO figures, more than<br />
<strong>World</strong> <strong>Disasters</strong> <strong>Report</strong> <strong>2010</strong> – Focus on urban risk<br />
105
106<br />
75 per cent <strong>of</strong> the 6.2 million deaths estimated to have occurred in the region in 2005<br />
were related to chronic diseases. In urban settings, poorer people have access to cheaper<br />
foods, which will <strong>of</strong>ten be less nutritious than more expensive varieties. It <strong>of</strong>ten costs<br />
less to eat badly.<br />
But the health problems <strong>of</strong> urban dwellers, particularly the poor, extend well beyond<br />
eating badly and doing little exercise when it comes to exposure to non-communicable<br />
disease. In 2004, some 1.2 million people died from respiratory illnesses caused by<br />
outdoor urban air pollution. According to WHO, some 1.5 billion urban dwellers<br />
– mostly in developing countries – face levels <strong>of</strong> air pollution that are above the maximum<br />
recommended limits. Emissions from motor vehicles and factories are estimated<br />
to cause about 8 per cent <strong>of</strong> lung cancer deaths, 5 per cent <strong>of</strong> cardiopulmonary deaths<br />
and about 3 per cent <strong>of</strong> respiratory infection deaths. This is likely to get worse as <strong>World</strong><br />
Bank projections indicate that motorized vehicles in cities will quadruple by 2050.<br />
Traffic kills and maims in large numbers. Around 90 per cent <strong>of</strong> the 1.3 million deaths<br />
a year attributable to road accidents occur in low- to middle-income countries.<br />
Indoor pollution can be even more lethal. About 25 per cent <strong>of</strong> city dwellers in developing<br />
countries and 70 per cent <strong>of</strong> city dwellers in least developed countries use solid<br />
fuels for household heating and cooking. In 2004, exposure to indoor pollution was<br />
estimated to cause about 2 million deaths worldwide, mostly from pneumonia, chronic<br />
lung disease and cancer.<br />
Box 5.2 Hi-tech rescue in a mega-city<br />
Imagine you are in charge <strong>of</strong> delivering much<br />
<strong>of</strong> the emergency health services to a megacity<br />
<strong>of</strong> over 20 million people and 4 million<br />
vehicles. It is a city so choked with traffic that<br />
drivers are only allowed take to the road on<br />
alternate days. There are 500,000 traffic accidents<br />
a year, countless heart attacks and fires.<br />
How then do you meet the challenge <strong>of</strong><br />
providing a 24/7 service, 365 days <strong>of</strong> the<br />
year, with 1,100 staff and a fleet <strong>of</strong> just 153<br />
ambulances, each <strong>of</strong> which will normally respond<br />
to an average <strong>of</strong> five calls a day?<br />
The Beijing branch <strong>of</strong> the <strong>Red</strong> <strong>Cross</strong> Society<br />
<strong>of</strong> China, led by Executive Vice President Lu<br />
Han, has come up with a series <strong>of</strong> innovations<br />
designed to maximize the use <strong>of</strong> limited<br />
resources by applying technology to the provision<br />
<strong>of</strong> ambulance services to a degree not<br />
seen in any other urban environment <strong>of</strong> its size.<br />
Speaking to the <strong>World</strong> <strong>Disasters</strong> <strong>Report</strong> during a<br />
<strong>Red</strong> <strong>Cross</strong> forum on urban risk at the Shanghai<br />
Expo, she said: “Urban response has become<br />
a priority in a crowded city. The Beijing <strong>Red</strong><br />
<strong>Cross</strong> 999 line responds to over 50 per cent <strong>of</strong><br />
the emergencies in the city. In comparison with<br />
the government’s 120 line, our 999 emergency<br />
services line <strong>of</strong>fers more choices. We are more<br />
focused on meeting the needs <strong>of</strong> our patients.<br />
For instance, we have 32 first-aid stations located<br />
in the traffic bureau’s branch <strong>of</strong>fices to ensure<br />
timely response to traffic accidents and there is<br />
also close coordination with the fire brigade.”
The <strong>Red</strong> <strong>Cross</strong> has 90 first-aid stations<br />
throughout the city and all its ambulances are<br />
equipped with GPS and closed circuit television.<br />
The command centre at headquarters always<br />
knows where its ambulances are and they<br />
can be diverted at a moment’s notice to the<br />
scene <strong>of</strong> a major accident. Doctors can assist<br />
remotely with the early treatment <strong>of</strong> seriously injured<br />
patients and ensure patients are brought<br />
to the appropriate hospital department.<br />
In 2009, in pursuit <strong>of</strong> their goal <strong>of</strong> saving<br />
both time and lives, they augmented their vehicle<br />
fleet with 50 motor bikes for first aiders who<br />
are equipped with Personal Digital Assistants<br />
(or palmtops) and GPS. “Motorcycles can<br />
reach the patients very fast when there are<br />
traffic jams. So we can make good use <strong>of</strong> the<br />
first four to six minutes after the call comes in,<br />
for this is the most precious period <strong>of</strong> time especially<br />
if the ambulance is going to be delayed<br />
by traffic,” said Han.<br />
In addition, she explained: “999 has a<br />
special programme for more than 200,000<br />
households in Beijing. If they press a certain<br />
button on their phone panel, 999 will be<br />
aware <strong>of</strong> the basic medical background <strong>of</strong> the<br />
family, medical records, address and phone<br />
number. These are usually families looking after<br />
an elderly person.”<br />
The Chinese <strong>Red</strong> <strong>Cross</strong> has developed a<br />
unique mobile phone platform with many features<br />
not found on standard models. The GPSequipped<br />
phones have proved useful to many<br />
families caring for a senile senior citizen lost<br />
in the city. The phones have an alarm button<br />
which will alert the <strong>Red</strong> <strong>Cross</strong> emergency<br />
centre when activated without even making a<br />
phone call. The phones can vocalize text messages<br />
for those who have poor sight and act<br />
as a torch and they also have an in-built radio.<br />
A third generation <strong>of</strong> this mobile phone,<br />
which costs less than US$ 100, is now under<br />
development. It can dial 999 when activated<br />
by an immobilized patient wearing a watchlike<br />
device on the wrist.<br />
The Beijing <strong>Red</strong> <strong>Cross</strong> provides many other<br />
services including helping victims <strong>of</strong> traffic accidents<br />
compile insurance claims through the 999<br />
forensic centre’s reports and providing medical<br />
care to anyone being held in police custody.<br />
“Hi-tech equipment is only one aspect <strong>of</strong><br />
our work. In addition to the technology we<br />
have also been focusing on increasing people’s<br />
knowledge, skills and general awareness<br />
about disaster risk reduction. The Beijing<br />
<strong>Red</strong> <strong>Cross</strong> issued 6 million copies <strong>of</strong> its family<br />
first-aid manual in Beijing last year. More than<br />
3 million people had received basic first-aid<br />
training by the end <strong>of</strong> 2009. We will continue<br />
to enhance our smart power – strategic planning<br />
and management in order to build a safer<br />
and securer mega-city,” concluded Han.<br />
Visitors to one <strong>of</strong> the city’s most popular<br />
tourist attractions, Tiananmen Square, will be<br />
happy to hear that there is a first-aid post and<br />
ambulance stationed there 24/7. You are also<br />
in a city where more than 3 million people<br />
have received basic first-aid training – so help<br />
may never be too far away. �<br />
Mean streets<br />
Violence is a serious risk to health in many large cities (see Chapter 4), whether it is<br />
Rio de Janeiro, Los Angeles or the banlieues <strong>of</strong> Paris. Much <strong>of</strong> this violence is related<br />
to the illicit drugs business which largely depends on end users living in cities. But<br />
there are other urban factors such as social exclusion, xenophobia and marginalization,<br />
unemployment and alcohol abuse that also fuel violence.<br />
<strong>World</strong> <strong>Disasters</strong> <strong>Report</strong> <strong>2010</strong> – Focus on urban risk<br />
107
CHAPTER 5<br />
108<br />
Illicit drugs are not just a source <strong>of</strong> violent crime, their use also poses a huge health<br />
challenge in itself and it is a problem that is heavily concentrated in cities. The same<br />
goes for alcohol abuse. Use <strong>of</strong> illicit drugs is fuelled by social and economic pressures<br />
and facilitated by easy availability in urban areas. According to WHO, urbanization is<br />
associated with twice the rate <strong>of</strong> hospital admission for drug or alcohol disorders.<br />
Given the pressures <strong>of</strong> city life, it is no surprise that urban living fuels mental disturbance<br />
and distress. Levels <strong>of</strong> fear, anxiety and mental illness have been shown to be higher in<br />
urban environments. In a study carried out in Sweden in 2004, adult Swedes living in<br />
densely populated areas had nearly twice the rate <strong>of</strong> serious mental illness as those living<br />
in thinly populated parts <strong>of</strong> the country. A sense <strong>of</strong> lack <strong>of</strong> control, fear <strong>of</strong> unemployment,<br />
the breakdown <strong>of</strong> traditional social ties and bonds – a particular problem for<br />
immigrants – and urban overcrowding are all factors that can trigger high levels <strong>of</strong> stress.<br />
One private clinic quoted in Britain’s Guardian newspaper reported a 33 per cent rise<br />
in the number <strong>of</strong> people from the financial sector seeking advice for anxiety, depression<br />
and stress after the global financial crash <strong>of</strong> late 2007 and 2008. Unemployment, or<br />
the threat <strong>of</strong> it, undermined their sense <strong>of</strong> personal worth. Another group particularly<br />
exposed to stress in urban settings is the elderly. Older city dwellers, particularly in<br />
richer countries, <strong>of</strong>ten face loneliness and depression unless they are rich enough to be<br />
able to pay for private care.<br />
WHO forecasts that within the next ten years unipolar depression will account for the<br />
greater burden <strong>of</strong> disease in developing countries. Community-based studies <strong>of</strong> mental<br />
health in developing countries support the view that 12 per cent to 51 per cent <strong>of</strong><br />
urban adults suffer from depression in some form or other. Risk factors include marital<br />
breakdown, poverty, exposure to stressful events, long-term stress and lack <strong>of</strong> social<br />
support. Symptoms <strong>of</strong> depression are more common among urban women than men<br />
and among poor urban neighbourhoods rather than in non-poor urban areas. Inadequate<br />
shelter, unemployment and the relentless struggle to cope with adversity are all<br />
drivers <strong>of</strong> mental ill health for the urban poor.<br />
Box 5.3 Safety on the urban road<br />
Road transportation has become a key element<br />
<strong>of</strong> urbanization. By speeding up communications<br />
and the transport <strong>of</strong> goods and people,<br />
it has generated a revolution in contemporary<br />
economic and social relations.<br />
However, this has not come about without<br />
cost: environmental pollution and urban stress<br />
are directly linked to growing road transportation.<br />
Above all, it is increasingly associated<br />
with the rapid escalation <strong>of</strong> road crashes and<br />
premature deaths, as well as with physical<br />
handicaps and psychological trauma.<br />
Losses are not limited to reduced worker<br />
productivity and trauma affecting a victim’s
private life. Equally significant are the rising<br />
costs in health services and the added economic<br />
bur den (estimated between 1 and 3 per cent<br />
<strong>of</strong> gross national product). In developing countries,<br />
the costs <strong>of</strong>ten exceed the international<br />
development assistance received each year.<br />
Consequently, there is a direct link between<br />
road safety improvement and poverty reduction.<br />
The situation is made worse in developing<br />
countries by rapid and unplanned urbanization.<br />
The absence <strong>of</strong> adequate infrastructure<br />
in cities, together with the lack <strong>of</strong> a legal regulatory<br />
framework, makes the exponential rise<br />
in the number <strong>of</strong> road crashes all the more<br />
worrying.<br />
Road crash fatality numbers are comparable<br />
to the number <strong>of</strong> global deaths caused<br />
by TB or malaria. <strong>World</strong>wide, road traffic injuries<br />
are the leading cause <strong>of</strong> death among<br />
young people aged 15 to 29 and the second<br />
most common cause <strong>of</strong> death for those aged<br />
5 to 14. An estimated 1.3 million people are<br />
killed in road crashes worldwide each year<br />
and as many as 50 million are injured. For<br />
every death, 20 to 30 people are disabled,<br />
many permanently.<br />
“If significant preventive actions are<br />
not taken, we estimate that by 2020<br />
road trauma will rank as the sixth biggest<br />
cause <strong>of</strong> death.” WHO<br />
Road crash mortality projection 2020<br />
in millions <strong>of</strong> people per year<br />
2.0<br />
1.5<br />
1.0<br />
0.5<br />
0.0<br />
<strong>2010</strong><br />
2020<br />
<strong>2010</strong> 2020<br />
HIC: High income countries LMIC: Low- and middle-income countries<br />
Source: WHO/<strong>World</strong> Bank (2004)<br />
Cost-effective solutions do exist and have<br />
already achieved very positive results in many<br />
countries. Together with its hosted project, the<br />
Global Road Safety Partnership (GRSP), the<br />
<strong>International</strong> <strong>Federation</strong> <strong>of</strong> <strong>Red</strong> <strong>Cross</strong> and <strong>Red</strong><br />
Crescent Societies (IFRC) has prioritized the<br />
reduction <strong>of</strong> disastrous road safety crashes<br />
affecting young people. IFRC and GRSP are<br />
advocating for the adoption <strong>of</strong> straightforward<br />
solutions to avoid or significantly decrease the<br />
tragic human, social and economic consequences<br />
<strong>of</strong> urban road crashes. These include:<br />
implementation <strong>of</strong> national road safety action<br />
policy; better road systems; first-aid training;<br />
and closer partnerships with governments, the<br />
private sector and civil society<br />
Viet Nam <strong>of</strong>fers a good example <strong>of</strong> success.<br />
In 2006, the Vietnamese National Traffic<br />
Safety Committee, the Asia Injury Prevention<br />
Foundation, the <strong>Red</strong> <strong>Cross</strong> <strong>of</strong> Viet Nam and<br />
the French <strong>Red</strong> <strong>Cross</strong> contributed to efforts to<br />
create a national action helmet plan supported<br />
by GRSP. That led to enactment and enforcement<br />
<strong>of</strong> a new helmet law. In 2008, Viet Nam<br />
saw the first results: 1,500 fewer lives lost compared<br />
with 2007 when 12,500 people died<br />
on the road. �<br />
Campaign posters produced by<br />
the <strong>Red</strong> <strong>Cross</strong> <strong>of</strong> Viet Nam and the French<br />
<strong>Red</strong> <strong>Cross</strong> in Hanoi and Ho Chi Minh City<br />
<strong>World</strong> <strong>Disasters</strong> <strong>Report</strong> <strong>2010</strong> – Focus on urban risk<br />
109
CHAPTER 5<br />
110<br />
Conclusion<br />
Modern city life takes a heavy toll on health, partly through the unsanitary and <strong>of</strong>ten<br />
dangerous conditions in which millions <strong>of</strong> people are forced to live, partly through<br />
the lifestyle choices that it encourages and partly from the strains and stresses that it<br />
imposes. Lack <strong>of</strong> policy and poor planning by municipal and central government play<br />
a significant role in these outcomes.<br />
While it is true that the number <strong>of</strong> slum dwellers continues to rise, some <strong>of</strong> the most<br />
significant strides in health improvements are being taken in countries where good<br />
urban governance is actively encouraged and supported and where lifting people out<br />
<strong>of</strong> slum conditions is a public policy goal. China and India have made progress in<br />
recent years in reducing their slum populations, showing what economic growth and<br />
political will can do. Some specific examples <strong>of</strong> how this can be done, particularly<br />
through community-based initiatives, are cited in Chapter 3 <strong>of</strong> this report, including<br />
the Thai government’s support to community-driven upgrading whereby scale is<br />
achieved through the very large number <strong>of</strong> local initiatives that it supports. At a local<br />
level, NGOs such as Asha show what can be achieved by working with slum dwellers<br />
to improve living conditions and fight disease. In the 49 New Delhi slums in which<br />
Asha is active, child mortality is now 36 for 1,000 live births, which is less than half<br />
the rate <strong>of</strong> India as a whole.<br />
When it comes to non-communicable disease, there are signs that political leaders<br />
are waking up to the threat. Whether it be Bogotá’s ciclovia (specially constructed<br />
routes for cyclists in the Colombian capital) or Singapore’s green labelling <strong>of</strong> dishes<br />
on school menus to help students identify healthy foods, examples are multiplying <strong>of</strong><br />
countries and cities taking initiatives to tackle the problems <strong>of</strong> inadequate diet and lack<br />
<strong>of</strong> exercise. Community networks are being forged to overcome the challenges <strong>of</strong> social<br />
breakdown and violence in poor and underprivileged city zones <strong>of</strong> both developing<br />
and developed countries.<br />
Underpinning all such initiatives is the growing awareness that tackling city health<br />
problems is not just a question <strong>of</strong> doctors and nurses. Nor is it solely a matter <strong>of</strong> alleviating<br />
poverty, although that is a crucial and necessary condition. It requires that cities<br />
be well planned, well managed and also well governed. Only then will they pose less <strong>of</strong><br />
a threat to the health <strong>of</strong> those who live in them.<br />
Chapter 5 was written by Richard Waddington, freelance writer and former Reuters bureau<br />
chief. Boxes 5.1 and 5.2 were contributed by Denis McClean, Editor, <strong>World</strong> <strong>Disasters</strong><br />
<strong>Report</strong>. Box 5.3 was contributed by Gérard Lautrédou, Road Safety Adviser, IFRC.
Sources and further information<br />
Burris, S. et al. ‘Emerging Strategies for Healthy Urban Governance’ in Journal <strong>of</strong><br />
Urban Health, Vol. 84 (Suppl. 1), pp. 154–163, 2007. Available online: www.ncbi.<br />
nlm.nih.gov / pmc / articles / PMC1891653/.<br />
Chartered Society <strong>of</strong> Physiotherapy. ‘Lower life expectancy in cities’, BBC News, London,<br />
20 June 2006. Available online: http://news.bbc.co.uk/2/hi / uk_news/5097778.<br />
stm.<br />
Durán, V.H. ‘Stopping the rising tide <strong>of</strong> chronic diseases – Everyone’s Epidemic’ in<br />
PAHO, Perspectives in health E-magazine, March 2008. Available online: www.paho.<br />
org / english / dd / pin / ePersp001_article01.htm.<br />
Food and Agriculture Organization <strong>of</strong> the United Nations (FAO). FAO launches antihunger<br />
petition. Rome: FAO Media Centre, <strong>2010</strong>. Available online: www.fao.org / n<br />
ews / story / en / item/42158/icode /.<br />
Humanitarian Futures Programme (HFP). Urban Catastrophes: The Wat / San Dimension.<br />
London: HFP, King’s College, <strong>2010</strong>. Available online: www.humanitarianfutures.<br />
org / main / content / usaid-future-crisis-drivers.<br />
<strong>International</strong> Monetary Fund (IMF). Food and fuel prices: Recent developments, macroeconomic<br />
impact and policy responses. Washington DC: IMF, 2008. Available online:<br />
www.imf.org / external / np / pp / eng/2008/063008.pdf.<br />
Leon, D.A. ‘Cities, urbanization and health’ in London School <strong>of</strong> Hygiene & Tropical<br />
Medicine, <strong>International</strong> Journal <strong>of</strong> Epidemiology, Vol. 37, No. 1, pp. 4–8, 2008.<br />
Available online: http://ije.oxfordjournals.org / cgi / content / short/37/1/4.<br />
Martinez, R. and Fernandez, A. ‘Child malnutrition in Latin America and the<br />
Caribbean’ in Economic Commission for Latin America and the Caribbean and<br />
UNICEF, Challenges: Newsletter on progress towards the Millennium Development<br />
Goals from a child rights perspective. No. 2, April, 2006. Available online: www.<br />
unicef.org / lac / Desafios_2_ing(9).pdf.<br />
Mercado, S. et al, ‘Urban Poverty: An Urgent Public Health Issue’ in Journal <strong>of</strong> Urban<br />
Health, Vol. 84 (Suppl. 1), pp. 7–15, 2007. Available online: www.ncbi.nlm.nih.<br />
gov / pmc / articles / PMC1891652/.<br />
Orzechowski, F. Soaring Food Prices: A Global Crisis. Speech given to 10th <strong>International</strong><br />
Food Aid Conference, April 2008. Available online: http://crs.org / newsroom / testimony<br />
/ entry.cfm?id=1455.<br />
Pan American Health Organization (PAHO). Haiti: Health in the Americas 2007 –<br />
Volume II. Available online: www.paho.org / hia / archivosvol2/paisesing / Haiti%20<br />
English.pdf.<br />
<strong>World</strong> <strong>Disasters</strong> <strong>Report</strong> <strong>2010</strong> – Focus on urban risk<br />
111
CHAPTER 5<br />
112<br />
Patel R.B. and Burke, T.F. ‘Urbanization: An Emerging Humanitarian Disaster’ in The<br />
New England Journal <strong>of</strong> Medicine, Vol. 361, No. 8, pp. 741–743, 2009. Available<br />
online: http://content.nejm.org / cgi / content / short/361/8/741.<br />
Popkin, B.M. ‘Urbanization, Lifestyle Changes and the Nutrition Transition’ in <strong>World</strong><br />
Development, Vol. 27, No. 11, pp. 1905–1916, 1999.<br />
Sanogo, I. and Ifeanyi, N. Livelihood and Food Security in Urban Emergencies: A Synthesis<br />
<strong>of</strong> Selected WFP Practices. Rome: <strong>World</strong> Food Programme, Food Security Analysis<br />
Service, <strong>2010</strong>.<br />
Stevens, A. and Bewley-Taylor, D. with contributions from Dreyfus, P. Drug markets<br />
and urban violence: Can tackling one reduce the other? The Beckley Foundation<br />
Drug Policy Programme. 2009. Available online: www.beckleyfoundation.<br />
org / pdf / report_15.pdf.<br />
Sundquist, K., Frank, G. and Sundquist J. ‘Urbanization and incidence <strong>of</strong> psychosis<br />
and depression; follow-up study <strong>of</strong> 4.4 million women and men in Sweden’ in The<br />
British Journal <strong>of</strong> Psychiatry, Vol. 184, pp. 293–298, 2004. Available online: http://<br />
bjp.rcpsych.org / cgi / content / full/184/4/293.<br />
The Guardian. ‘Stress levels soar in the square mile.’ London: 8 October 2008. Available<br />
online: www.guardian.co.uk / society/2008/oct/08/mental.health.financial.crisis.<br />
The Lancet. Vol. 365, No. 9456, 5 March 2005. Available online: www.thelancet.com<br />
/ journals / lancet / issue / vol365no9456/PIIS0140-6736(00)X9461-5.<br />
United Nations Children’s Fund (UNICEF). State <strong>of</strong> the <strong>World</strong>’s Children. New York:<br />
UNICEF, 2008.<br />
United Nations Human Settlements Programme (UN-Habitat). State <strong>of</strong> the <strong>World</strong>’s<br />
Cities <strong>2010</strong>/2011 – Bridging The Urban Divide. London and Washington DC:<br />
UN-Habitat, <strong>2010</strong>.<br />
UN-Habitat. Planning Sustainable Cities – Global <strong>Report</strong> on Human Settlements.<br />
Nairobi: UN-Habitat, 2009. Available online: www.unhabitat.org / pmss.<br />
UN-Habitat. State <strong>of</strong> the <strong>World</strong>’s Cities 2008/2009 – Harmonious Cities. London and<br />
Washington DC: UN-Habitat, 2008.<br />
UN-Habitat. State <strong>of</strong> the <strong>World</strong>’s Cities 2006/7. London: Earthscan Publications, 2007.<br />
UN-Habitat. The Urban Penalty: The Poor Die Young. UN-Habitat Features, 2006.<br />
Available online: http://bit.ly / cIQa4Z.<br />
UN-Habitat. Global <strong>Report</strong> on Human Settlements – The Challenge <strong>of</strong> Slums. Nairobi:<br />
UN-Habitat, 2003. Available online: www.unhabitat.org / pmss.<br />
<strong>World</strong> Bank. Food price crisis imperils 100 million in poor countries, Zoellick says. <strong>World</strong><br />
Bank News & Broadcast, 14 April 2008. Available online: http://bit.ly / bLb92B.
<strong>World</strong> Economic Forum. Global Risks <strong>2010</strong>. Geneva: <strong>World</strong> Economic Forum, <strong>2010</strong>.<br />
Available online: www.weforum.org / pdf / globalrisk / globalrisks<strong>2010</strong>.pdf.<br />
<strong>World</strong> Health Organization (WHO). <strong>World</strong> Health Day News Bulletin. Geneva: WHO,<br />
<strong>2010</strong>. Available online: www.who.int / bulletin / volumes/88/4/10-010410.pdf.<br />
WHO. Global Health Risks – mortality and burden <strong>of</strong> disease attributable to selected major<br />
risks. Geneva: WHO, 2009. Available online: www.who.int / healthinfo / global_<br />
burden_disease / GlobalHealthRisks_report_full.pdf.<br />
WHO. Our cities, our health, our future: Acting on social determinants for health equity in<br />
urban settings. <strong>Report</strong> <strong>of</strong> the Knowledge Network on Urban Settings to the <strong>World</strong> Health<br />
Organization (WHO) Commission on Social Determinants <strong>of</strong> Health. Kobe, Japan:<br />
WHO, 2008. Available online: www.who.or.jp / knusp / KNUS_final_report.pdf.<br />
WHO. <strong>Report</strong> on Infectious Diseases – Removing Obstacles to Healthy Development. Geneva:<br />
WHO, 1999. Available online: www.who.int / infectious-disease-report / index-rpt99.<br />
html.<br />
WHO and <strong>World</strong> Bank. <strong>World</strong> report on traffic injury prevention. Geneva: WHO, 2004.<br />
Available online: http://whqlibdoc.who.int / publications/2004/9241562609.pdf.<br />
<strong>World</strong> <strong>Disasters</strong> <strong>Report</strong> <strong>2010</strong> – Focus on urban risk<br />
113
CHAPTER 6<br />
114
Urbanization and<br />
climate change risk<br />
All successful urban centres provide pro<strong>of</strong> <strong>of</strong> the ability <strong>of</strong> human societies to adapt to<br />
the particular physical and climatic conditions in which they are located. While disaster<br />
events have long had the capacity to disrupt urban communities, livelihoods and<br />
economies, climate change presents a new and systematic challenge to urban development<br />
and sustainability. Last year was the fifth warmest year on record and the decade<br />
2000–2009 was warmer than the previous two record-breaking decades. In 2009,<br />
severe climate events included: a record-breaking heatwave which badly affected major<br />
urban centres in southern Australia; drought-related food shortages in Kenya which<br />
affected slum dwellers in Nairobi; and heavy rains which caused floods in many towns<br />
across central Europe.<br />
This chapter explains the need for a specific focus on climate change and how it impacts<br />
urban centres, while recognizing that good practices in disaster risk reduction are at the<br />
core <strong>of</strong> climate change adaptation in most instances. Firstly, it assesses the ways in<br />
which climate change will affect patterns <strong>of</strong> risk, using both a geographical analysis (the<br />
distribution <strong>of</strong> risk between cities) and a social analysis (the distribution <strong>of</strong> risk within<br />
cities). This highlights how, without adequate adaptation, the increase in disaster risk<br />
in the next few decades is likely to be unprecedented through more intense or frequent<br />
storms, more intense precipitation and more serious heatwaves and drought. Secondly,<br />
it illustrates the ways in which efforts to reduce risk from disasters will increasingly<br />
need to incorporate an explicit awareness <strong>of</strong> climate change issues. Finally, it looks at<br />
the ways in which cities can address climate change – both through reducing greenhouse<br />
gas emissions and through adapting to cope with the consequences. These practices<br />
are particularly important in the global context <strong>of</strong> increasing urbanization and<br />
the need to improve the well-being <strong>of</strong> urban residents – including issues <strong>of</strong> mobility,<br />
shelter and food supply – without increasing energy use and greenhouse gas emissions.<br />
Responding to climate change requires improving existing structures and building the<br />
capacity <strong>of</strong> departments responsible for urban development and environmental management<br />
– and their links to the institutions responsible for disaster response. At the<br />
same time, climate change adaptation can be used as an entry-point to develop more<br />
effective environmental strategies that meet the needs <strong>of</strong> urban residents. If properly<br />
addressed, adapting to climate change can help cities to meet a wider range <strong>of</strong> desirable<br />
objectives concerning liveability, service provision and the reduction <strong>of</strong> disaster risk.<br />
This will require a sharing <strong>of</strong> knowledge and skills between the two communities <strong>of</strong><br />
practice, so that climate change practitioners can learn from the experiences <strong>of</strong> disaster<br />
risk reduction, and disaster risk reduction can cope effectively with new climate<br />
challenges.<br />
<strong>World</strong> <strong>Disasters</strong> <strong>Report</strong> <strong>2010</strong> – Focus on urban risk<br />
Photo opposite page:<br />
Many people living<br />
in developing<br />
countries’ coastal<br />
cities, such as here<br />
in Dakar, Senegal,<br />
face ever more severe<br />
floods due to more<br />
frequent storm surges,<br />
heavy rainfall and<br />
inadequate drainage<br />
systems.<br />
© Ricci Shryock / IFRC<br />
115
Box 6.1 Key organizations and concepts in climate change<br />
The growing policy focus on climate change<br />
has led to the development <strong>of</strong> new institutions<br />
and the use <strong>of</strong> new terminology, some <strong>of</strong> which<br />
differs from that used in disaster risk reduction.<br />
The Intergovernmental Panel on<br />
Climate Change (IPCC) is the global scientific<br />
body established by the United Nations<br />
Environment Programme and the <strong>World</strong><br />
Meteorological Organization (WMO). It produces<br />
Assessment <strong>Report</strong>s (most recently, the<br />
Fourth Assessment <strong>Report</strong> in 2007) that summarize<br />
the state <strong>of</strong> knowledge on climate change<br />
and its potential consequences. Its preparation<br />
for the Fifth Assessment <strong>Report</strong> acknowledges a<br />
need for greater attention to adapting cities to<br />
climate change and incorporating knowledge<br />
and experience on disaster risk reduction.<br />
The United Nations Framework Convention<br />
on Climate Change (UNFCCC)<br />
provides the global legislative framework<br />
for reducing global warming and responding<br />
to climate change and convenes the annual<br />
meeting for negotiating emissions reductions<br />
and adaptation financing known as the<br />
Conference <strong>of</strong> Parties, or COP (e.g., COP15 in<br />
Copenhagen, held in December 2009).<br />
116<br />
Changing patterns <strong>of</strong> risk :<br />
The effects <strong>of</strong> climate change<br />
Greenhouse gases are gases that<br />
ab sorb and emit radiation <strong>of</strong> specific wavelengths,<br />
leading to the trapping <strong>of</strong> heat in the<br />
earth’s atmosphere, a process known as the<br />
greenhouse effect. Although the process<br />
occurs naturally and is important in supporting<br />
life on earth, the emission <strong>of</strong> carbon dioxide,<br />
nitrous oxide, methane and other gases as a<br />
result <strong>of</strong> human activity has raised the concentration<br />
<strong>of</strong> these gases sufficiently to result in<br />
anthropogenic climate change.<br />
Adaptation is an adjustment in natural<br />
or human systems in response to actual or<br />
expected climate change in order to reduce<br />
its harmful impacts. It may take place before<br />
the impacts are felt, may be planned through<br />
deliberate policies, or may be spontaneous.<br />
It can involve individuals, communities, local<br />
governments and nation states.<br />
In the climate change arena, mitigation<br />
refers to a reduction in atmospheric greenhouse<br />
gases, thereby limiting the extent <strong>of</strong> anthropogenic<br />
climate change. It involves both reducing<br />
the quantities <strong>of</strong> emissions and enhancing the<br />
ability <strong>of</strong> natural and human systems to absorb<br />
greenhouse gases. �<br />
Although the earth’s climate has always been dynamic, over the last 100 years global<br />
temperatures have been rising largely as a result <strong>of</strong> human activities, a process known as<br />
anthropogenic climate change. This has been driven by the production <strong>of</strong> greenhouse<br />
gases – and their increasing concentration in the atmosphere – since the industrial<br />
revolution. Observed changes include an increase in the global average temperature <strong>of</strong><br />
0.740 degrees Celsius, increased ocean temperature and acidity, a decline in snow coverage<br />
in the northern hemisphere, more frequent and intense extreme weather events,<br />
shifts in the distribution <strong>of</strong> animal and plant species, and a rise in global average sea<br />
levels <strong>of</strong> 17 centimetres. The IPCC’s Fourth Assessment <strong>Report</strong> concluded that likely<br />
future changes in climate include warmer and fewer cold days and nights, warmer and
more frequent hot days and nights, increased frequency <strong>of</strong> warm spells and heatwaves<br />
over most land areas, increased frequency <strong>of</strong> heavy precipitation events over most<br />
areas, increased areas affected by drought, increased intense tropical cyclone activity<br />
and increased incidence <strong>of</strong> extreme high sea level. These changes will result in a range<br />
<strong>of</strong> impacts on urban areas, as shown in Table 6.1.<br />
Table 6.1 Climate change impacts on urban areas<br />
Change in climate Possible impact on urban areas<br />
Changes in means<br />
Temperature �� Increased energy demands for heating / cooling<br />
�� Worsening <strong>of</strong> air quality<br />
�� Exaggerated by urban heat islands<br />
Precipitation �� Increased risk <strong>of</strong> flooding<br />
�� Increased risk <strong>of</strong> landslides<br />
�� Distress migration from rural areas as a result <strong>of</strong> crop failures<br />
�� Interruption <strong>of</strong> food supply networks<br />
Sea-level rise �� Coastal flooding<br />
�� <strong>Red</strong>uced income from agriculture and tourism<br />
�� Salinization <strong>of</strong> water sources<br />
Changes in extremes<br />
Extreme rainfall / tropical cyclones �� More intense flooding<br />
�� Higher risk <strong>of</strong> landslides<br />
�� Disruption to livelihoods and city economies<br />
�� Damage to homes and businesses<br />
Drought �� Water shortages<br />
�� Higher food prices<br />
�� Disruption <strong>of</strong> hydroelectricity<br />
�� Distress migration from rural areas<br />
Heat- or cold-waves �� Short-term increase in energy demands for heating / cooling<br />
Abrupt climate change �� Possible significant impacts from rapid and extreme sea-level rise<br />
Changes in exposure<br />
Population movements �� Movements from stressed rural habitats<br />
Biological changes �� Extended vector habitats<br />
Source: Adapted from Wilbanks et al. (2007)<br />
The extent to which urban centres are vulnerable to these changes in climate is influenced<br />
by a variety <strong>of</strong> factors. The location <strong>of</strong> cities affects the types <strong>of</strong> climate hazards<br />
to which they are exposed, and whether they are particularly likely to be affected by<br />
higher temperatures, changing patterns in precipitation, sea-level rise or more frequent<br />
or severe extreme events. However, and more importantly, vulnerability to these<br />
impacts is mediated through the social and economic circumstances <strong>of</strong> the city and its<br />
residents, and through the ability <strong>of</strong> stakeholders and institutions to address the challenges<br />
<strong>of</strong> climate change, sometimes referred to as adaptive capacity. Because <strong>of</strong> this,<br />
cities in low- and middle-income nations are particularly vulnerable to climate change<br />
– indeed, the IPCC concluded that “the distribution <strong>of</strong> impacts and vulnerabilities is<br />
<strong>World</strong> <strong>Disasters</strong> <strong>Report</strong> <strong>2010</strong> – Focus on urban risk<br />
117
CHAPTER 6<br />
118<br />
still considered to be uneven, and low-latitude, less-developed areas are generally at<br />
greatest risk due to both higher sensitivity and lower adaptive capacity”.<br />
It is also worth noting that most developing world cities – and the countries in which<br />
they are located – have contributed very little to the global greenhouse gas emissions<br />
that are causing climate change in the first place. At a national level, average annual per<br />
capita greenhouse gas emissions are more than 20 tonnes <strong>of</strong> carbon dioxide equivalent<br />
in many highly industrialized countries including Australia, Canada and the United<br />
States. At the opposite end <strong>of</strong> the scale, emissions from many sub-Saharan African<br />
countries including Burkina Faso, Malawi and Tanzania are less than 0.2 tonnes per<br />
capita per year – a more than 100-fold difference. The fact that urban residents in<br />
these countries are likely to be the worst affected means that supporting climate change<br />
adaptation is a vital environmental justice issue for the 21st century. In his address to<br />
the United Nations Summit on Climate Change in September 2009, IPCC Chairman<br />
Rajendra K. Pachauri spelt out what this could mean: “In Africa, by 2020, between<br />
75 and 250 million people are projected to be exposed to water stress due to climate<br />
change, and in some countries yields from rainfed agriculture could be reduced by up<br />
to 50%. The impacts <strong>of</strong> climate change would be disproportionately severe on some<br />
<strong>of</strong> the poorest regions and communities <strong>of</strong> the world. My own analysis suggests that at<br />
least 12 countries are likely to tend towards becoming failed states and communities<br />
in several other states would show potential for serious conflict due to scarcity <strong>of</strong> food,<br />
water stress and soil degradation.”<br />
Complex inter-linkages exist between the effects <strong>of</strong> climate change and the process <strong>of</strong><br />
urbanization. It is likely that extreme events and gradual changes alike will, in many<br />
cases, contribute to increasing levels <strong>of</strong> mobility. In most <strong>of</strong> these cases, mobility (along<br />
with income diversification) will be an important strategy for households and communities<br />
to reduce vulnerability to environmental and non-environmental risks and<br />
thereby to cope with climate change. At the same time, however, high urban densities<br />
can increase vulnerability to climate change-related disasters – particularly because<br />
inadequate institutions and lack <strong>of</strong> infrastructure are <strong>of</strong>ten concentrated in areas where<br />
there are also high population densities <strong>of</strong> low-income urban residents. In particular,<br />
rural–urban migrants <strong>of</strong>ten have no choice but to settle on land that is already densely<br />
populated or in relatively vacant sections that are particularly prone to disasters. Cities<br />
can also concentrate adaptive capacities: economic resources, diversified food sources,<br />
a wide range <strong>of</strong> income-generating opportunities, transmission mechanisms for early<br />
warning systems and efficiencies <strong>of</strong> scale for emergency responses are capacities that<br />
have the potential to be much stronger in urban areas.<br />
The geographical distribution <strong>of</strong> climate change risk<br />
The types <strong>of</strong> information used to assess the potential threats from climatic hazards<br />
are past records <strong>of</strong> exposure to extreme weather events such as tropical storms, likely
impacts <strong>of</strong> changing precipitation patterns and susceptibility to sea-level rise and storm<br />
surges. However, exposure to risk is not the same as vulnerability. A 2009 WWF report<br />
on the risks <strong>of</strong> climate change in ten Asian cities concluded that Manila, Ho Chi Minh<br />
City, Shanghai and Dhaka were all highly exposed to climatic threats. Some cities that<br />
are also highly exposed – including Kuala Lumpur, Hong Kong and Singapore – were<br />
identified as being much less vulnerable, because they possess the adaptive capacity to<br />
manage threats. The most vulnerable cities, such as Dhaka, Jakarta and Manila, are<br />
both highly exposed and have relatively low levels <strong>of</strong> adaptive capacity.<br />
Urban areas located in coastal areas are particularly exposed to sea-level rise. The lowelevation<br />
coastal zone – the contiguous area along the world’s coastlines that is less than<br />
10 metres above sea level – covers just 2 per cent <strong>of</strong> the world’s land area but contains<br />
13 per cent <strong>of</strong> the world’s urban population. By 2007, Africa had 37 cities with more<br />
than 1 million inhabitants and half <strong>of</strong> them are within – or have parts within – the lowelevation<br />
coastal zone. In Cotonou, Benin, coastal erosion is already affecting residential<br />
areas, fishing communities and the city’s industrial and tourism sectors. A sea-level rise<br />
<strong>of</strong> 50cm would lead to over 2 million people in Alexandria, Egypt, needing to abandon<br />
their homes and would cause financial losses associated with land, property and tourism<br />
income <strong>of</strong> over US$ 35 billion. Much <strong>of</strong> Lagos, Nigeria is also low-lying, and the<br />
low-income urban population there faces a worsening situation as floods become more<br />
severe from the combination <strong>of</strong> increasing frequency <strong>of</strong> storm surges, heavy rainfall <strong>of</strong><br />
long duration or high intensity and inadequate drainage systems.<br />
The East African coast is also expected to be affected by sea-level rise, resulting in<br />
potential adaptation costs <strong>of</strong> up to 10 per cent <strong>of</strong> gross domestic product. In Dar es<br />
Salaam, Tanzania, coastal erosion is affecting the area <strong>of</strong> Kunduchi Beach to the north<br />
<strong>of</strong> the city. Other activities – such as the dynamiting <strong>of</strong> coral reefs for fishing, sand<br />
extraction for construction and the removal <strong>of</strong> mangroves – will worsen the impacts <strong>of</strong><br />
sea-level rise in this area. In Asia, large sections <strong>of</strong> Dhaka and Shanghai are only one<br />
to five metres above mean sea level, while much <strong>of</strong> Mumbai is built on landfill and is<br />
likely to suffer from more serious storm surges and increased frequency and intensity<br />
<strong>of</strong> extreme weather as a result <strong>of</strong> climate change. Perhaps not surprisingly, in all <strong>of</strong> these<br />
cases, it is mostly low-income households living in informal or illegal settlements that<br />
face the greatest risks from flooding. Salinization <strong>of</strong> drinking water and groundwater<br />
is also a concern, as many coastal cities derive water from just above salt fronts. As sea<br />
levels rise, so too does the likelihood <strong>of</strong> drawing in saline water for municipal water<br />
supply systems.<br />
Another geographically specific aspect <strong>of</strong> climate risk is an increase in water scarcity,<br />
which will particularly affect cities located in semi-arid regions. As South American<br />
glaciers retreat, many cities in the Andes will face water shortages during the dry season.<br />
A study from the central Andes <strong>of</strong> Peru suggests that the largest city in the region,<br />
Huancayo, with a population <strong>of</strong> approximately 325,000, is already experiencing water<br />
<strong>World</strong> <strong>Disasters</strong> <strong>Report</strong> <strong>2010</strong> – Focus on urban risk<br />
119
120<br />
shortages. Retaining walls and small dams have been constructed on nearby lagoons,<br />
but now these interventions are being called into question as they may have contributed<br />
to water shortages, along with the increased demands that come with population<br />
growth, land-use changes and deforestation. The city <strong>of</strong> Quito will also face water<br />
shortages, as glacial retreat is exacerbated by increased sedimentation <strong>of</strong> waterways,<br />
land-use modification and increases in water use due to higher temperatures. Food<br />
insecurity in urban areas is also influenced by climate change impacts on agriculture as<br />
a consequence <strong>of</strong> water scarcity and other weather impacts on crop production.<br />
Box 6.2 Cooperating on flood risk in Saint-Louis, Senegal<br />
Saint-Louis is Senegal’s former capital and it<br />
had 180,000 inhabitants in 2002. The city<br />
is situated on three islands cut <strong>of</strong>f from each<br />
other by the Senegal River, its tributaries and<br />
the Atlantic Ocean. Some areas <strong>of</strong> the city are<br />
less than 2.5 metres above mean sea level. The<br />
city has experienced recurrent flooding since<br />
1990, caused by the rains and peak flows in<br />
the Senegal River. The rising river level is the<br />
result <strong>of</strong> the silting-up <strong>of</strong> the river bed, the dumping<br />
<strong>of</strong> household waste, the reduced area available<br />
for flood-water irrigation (as unplanned urbanization<br />
means these areas are now covered<br />
by houses) and a shallow water table that rises<br />
to the surface when the river swells and drains<br />
poorly during the winter season.<br />
Who is affected by flooding?<br />
Flooding in Saint-Louis generally affects areas<br />
inhabited by the lowest-income groups. The<br />
household economy <strong>of</strong> those most at risk from<br />
flooding is very fragile; after each flood, their<br />
poverty is increased. Schools generally take<br />
in the flood victims and two or three families<br />
may find themselves living in a single classroom<br />
and the school year may be reduced by<br />
several months. Economic activity also slows<br />
down as workplaces are under water.<br />
The extent <strong>of</strong> the floods that occurred during<br />
the 2009 winter season led the Senegalese<br />
authorities to initiate the national disaster response<br />
plan to address the situation. Stagnant<br />
rainwater in the flooded areas, combined with<br />
a lack <strong>of</strong> clean water, inadequate drainage<br />
and wastewater and solid waste management<br />
(only 30 per cent <strong>of</strong> households have a regular<br />
solid waste collection and less than 10 per<br />
cent sewer connections) brings serious health<br />
impacts. Risks are further compounded by the<br />
proliferation <strong>of</strong> disease vectors (flies, mosquitoes,<br />
cockroaches, rats, mice, etc.), poor hygiene<br />
and high levels <strong>of</strong> overcrowding.<br />
Responding to vulnerability<br />
The strategy <strong>of</strong> the Senegalese non-governmental<br />
organization (NGO) Enda-Tiers Monde in<br />
response to flooding in Saint-Louis has been<br />
based not on building infrastructure but on<br />
strengthening local governance. Stakeholders<br />
come together to engage in dialogue and<br />
exchange views in order to find solutions to<br />
problems that are beyond their individual skills<br />
or capacities. An action plan has been developed<br />
and is managed by a steering committee,<br />
which ensures that the programme’s information,<br />
education and communication activities<br />
are implemented smoothly. Plays, exhibitions,<br />
media broadcasts, teatime ‘chats’, interviews,<br />
photo exhibitions, intensive awareness-raising<br />
campaigns, open-air conferences and public
feedback have all been used to help change<br />
behaviour.<br />
Activities focus primarily on:<br />
�� digging paths to evacuate stagnant water<br />
�� regular maintenance <strong>of</strong> drainage channels<br />
�� disinfecting stagnant water, in association<br />
with the national hygiene department<br />
�� placing sandbags to help inhabitants get<br />
about within the neighbourhood itself.<br />
The social distribution <strong>of</strong> climate change risk<br />
The authorities use local labour for some drainage<br />
works and women’s groups are involved<br />
in awareness-raising activities to combat diarrhoea<br />
and measures to be taken to prevent malaria<br />
and other diseases. NGOs work closely<br />
with the state’s decentralized structures (health<br />
and sanitation departments, fire brigade, etc.)<br />
to raise awareness and change the population’s<br />
behaviour.��<br />
Social factors account for a large proportion <strong>of</strong> the variability in vulnerability to climate<br />
change impacts. Firstly, poverty and marginality are key contributors to vulnerability.<br />
Exposure to climate risk is particularly evident for households and communities<br />
living in sites that are exposed to storm surges, flooding and landslides and which lack<br />
the resources and options to modify these effectively. Low-income urban residents are<br />
particularly vulnerable to climate change for a variety <strong>of</strong> reasons, including:<br />
�� greater exposure to hazards (e.g., through living in makeshift housing on unsafe<br />
sites)<br />
�� lack <strong>of</strong> hazard-reducing infrastructure (e.g., roads allowing emergency vehicle<br />
access)<br />
�� less adaptive capacity (e.g., inability to move to less dangerous sites or access sav-<br />
ings or insurance)<br />
�� less state provision <strong>of</strong> assistance<br />
�� less legal and financial protection.<br />
Secondly, climate change is expected to exacerbate pre-existing gender dimensions<br />
<strong>of</strong> vulnerability. On top <strong>of</strong> the well-documented and disproportionate impact <strong>of</strong><br />
disasters on women’s morbidity and mortality, climate change will impact women’s<br />
livelihoods by reducing economic opportunities and will increase the burden <strong>of</strong><br />
reproductive labour, for example, through a growing burden <strong>of</strong> child disease (see<br />
Table 6.2).<br />
Thirdly, age greatly shapes vulnerability to the consequences <strong>of</strong> climate change. Children<br />
have higher susceptibility to diseases caused by poor sanitation or spread by vectors.<br />
Climate change may reduce availability <strong>of</strong> potable water, both through absolute<br />
scarcity and through increased spread <strong>of</strong> bacterial diseases, and vectors such as mosquitoes<br />
may expand their range due to rising temperatures. In addition, very young children<br />
have less capacity to cope with high temperatures and less ability or knowledge to<br />
respond rapidly to disaster events, and can suffer long-term damage to their cognitive<br />
<strong>World</strong> <strong>Disasters</strong> <strong>Report</strong> <strong>2010</strong> – Focus on urban risk<br />
121
Table 6.2 Gender and climate vulnerability<br />
Aspect <strong>of</strong> vulnerability Contribution to urban<br />
vulnerability<br />
Gendered division <strong>of</strong> labour and<br />
‘poverty <strong>of</strong> time’<br />
122<br />
Women have prime responsibility for<br />
‘reproductive’ labour; lack <strong>of</strong> time to<br />
engage in ‘productive’ labour<br />
Gender-ascribed social responsibilities Women have prime responsibility for<br />
‘reproductive’ labour; lack <strong>of</strong> time to<br />
engage in ‘productive’ labour<br />
Cultural expectations <strong>of</strong> gender norms Constraints on women’s mobility and<br />
involvement in certain activities<br />
Unequal entitlements to land and<br />
property<br />
Higher representation <strong>of</strong> women in<br />
informal sector<br />
Contribution to climate<br />
vulnerability<br />
Limited financial assets to build<br />
resilience and to cope with disaster<br />
events<br />
Additional domestic responsibilities<br />
when access to food, water and<br />
sanitation are disrupted; additional<br />
time required to care for young, sick<br />
and elderly<br />
Higher mortality from disaster events<br />
due to lack <strong>of</strong> skills and knowledge<br />
Limited access to productive resources Limited ability to invest in more resilient<br />
land or shelter<br />
Lower wages and lack <strong>of</strong> financial<br />
security<br />
Damage to homes and neighbourhoods<br />
affects women’s incomes more severely<br />
as income-earning activities are <strong>of</strong>ten<br />
undertaken at home<br />
Safety and security in public spaces Limited freedom to use public space Particular problem in temporary<br />
accommodation / relocation sites; high<br />
rates <strong>of</strong> sexual abuse and violence<br />
Limited engagement <strong>of</strong> women in<br />
planning processes<br />
Urban plans fail to meet particular<br />
needs <strong>of</strong> women and children<br />
Climate adaptation plans fail to meet<br />
needs <strong>of</strong> women and children; failure<br />
to incorporate women’s perspectives<br />
may result in higher levels <strong>of</strong> risk being<br />
accepted<br />
and social development as a result <strong>of</strong> early experiences. Heatwaves particularly affect<br />
elderly residents <strong>of</strong> temperate cities where the building stock is not suited to continuous<br />
high temperatures – the 2003 European heatwave was associated with more than<br />
70,000 additional deaths across the continent.<br />
Finally, in addition to morbidity and mortality as a result <strong>of</strong> one-<strong>of</strong>f events, climate<br />
change will also result in qualitatively different patterns <strong>of</strong> health burdens on urban<br />
populations. Weather and climate also influence air pollution-related mortality and<br />
morbidity, the prevalence <strong>of</strong> mosquito- and tick-borne diseases and the spread <strong>of</strong><br />
water- and food-borne diseases, e.g., through survival <strong>of</strong> bacterial pathogens and the<br />
transportation <strong>of</strong> disease organisms into water supplies. In northern Mexico, heatwaves<br />
have been correlated with increases in mortality rates; 10 per cent <strong>of</strong> summer<br />
deaths are associated with heat strain in Buenos Aires, Argentina; and records show<br />
increased cases <strong>of</strong> diarrhoea in Peru.
Addressing the causes <strong>of</strong> climate change:<br />
The role <strong>of</strong> cities in climate change mitigation<br />
Ultimately, reducing the risk <strong>of</strong> climate change requires global strategies to limit the<br />
atmospheric concentration <strong>of</strong> greenhouse gases. Without substantial coordinated<br />
efforts to reduce emissions, vast areas <strong>of</strong> the earth’s surface – including many large<br />
urban centres – will be affected by catastrophic changes in their climate. For instance,<br />
the IPCC’s Fourth Assessment <strong>Report</strong> noted the possibility <strong>of</strong> global warming causing a<br />
partial de-glaciation <strong>of</strong> the Greenland ice sheet and the West Antarctic ice sheet, which<br />
would contribute to a sea-level rise <strong>of</strong> several metres that would imply major changes<br />
in coastlines and inundation <strong>of</strong> low-lying areas. But the time frame for this is uncertain<br />
and this change could be prevented if governments follow IPCC recommendations for<br />
emissions reduction.<br />
In this regard, climate change mitigation can be seen as the most effective form <strong>of</strong><br />
climate change-related disaster risk reduction, and is an area in which cities can play a<br />
key role. As stated previously, most <strong>of</strong> the earth’s population has made a minimal contribution<br />
to climate change and the burdens <strong>of</strong> mitigation ought not to be borne by<br />
these societies. In high- and many middle-income nations, however, urban areas need<br />
to be at the forefront <strong>of</strong> taking responsibility for climate change and reducing their<br />
emissions accordingly. Although the contribution <strong>of</strong> urban areas to global greenhouse<br />
gas emissions cannot be accurately quantified, the consumption behaviour <strong>of</strong> wealthy<br />
urban residents is a significant contributor to this. Similarly, various mitigation activities<br />
can also yield substantial public health benefits, including greater levels <strong>of</strong> physical<br />
activity and lower levels <strong>of</strong> air pollution.<br />
A range <strong>of</strong> urban activities and sectors contribute considerably to greenhouse gas<br />
emissions. These include energy supply (direct and through electricity generation<br />
from thermal power stations), transportation, industry and waste. Urban authorities<br />
are able to contribute to emissions reductions in different ways, for example, by providing<br />
improved public transportation options or by providing incentives for homeowners<br />
to fit more energy-efficient appliances. Cities such as New York and London<br />
demonstrate that large and dense urban settlements <strong>of</strong>fer opportunities for reducing<br />
carbon footprints – the average resident <strong>of</strong> New York generates just 30 per cent <strong>of</strong><br />
the emissions <strong>of</strong> the average American and the average London resident generates<br />
just 55 per cent <strong>of</strong> the emissions <strong>of</strong> the average UK resident. Indeed, long-term planning<br />
to reshape urban form and structure may result in much more efficient public<br />
transportation infrastructure that meets both environmental and social needs. However,<br />
efforts to reduce emissions also need to take a ‘consumption-based’ approach,<br />
recognizing that many <strong>of</strong> the goods and services consumed by urban residents (particularly<br />
in more affluent countries) – including food, energy and consumer goods<br />
– are associated with emissions from outside the urban area itself and frequently from<br />
other countries.<br />
<strong>World</strong> <strong>Disasters</strong> <strong>Report</strong> <strong>2010</strong> – Focus on urban risk<br />
123
124<br />
Several initiatives – including the C40 Climate Leadership Group and Cities for<br />
Climate Protection, sponsored by ICLEI-Local Governments for Sustainability – help<br />
share knowledge and good practices between cities involved in reducing their greenhouse<br />
gas emissions. Urban authorities in low- and middle-income nations have also<br />
begun to exploit opportunities to generate ‘carbon credits’ through reducing emissions<br />
from solid waste management and other activities. At the same time, however, it must<br />
be ensured that these efforts do not divert attention from the strong adaptation needs<br />
that face many residents <strong>of</strong> these cities.<br />
Box 6.3 Urban flooding in Ireland<br />
Much <strong>of</strong> urban Ireland was thrown into chaos<br />
by widespread flooding in the same week in<br />
November 2009 that the Irish Academy <strong>of</strong> Engineering<br />
(IAE) published a landmark report<br />
Ireland At Risk – Critical Infrastructure and Climate<br />
Change which warned that storm surges<br />
combined with a sea-level rise <strong>of</strong> 50cm would<br />
mean that a one-in-100-year flood could happen<br />
as <strong>of</strong>ten as every five years.<br />
Rainfall totals were the highest on record<br />
for November in many places and river levels<br />
reached record heights as the Irish <strong>Red</strong> <strong>Cross</strong><br />
deployed volunteers and ambulances to assist<br />
in evacuations and to ensure that vital health<br />
personnel were able to report to work.<br />
Months later the island nation, whose major<br />
cities all lie on the coast, was still counting the<br />
cost. In County Cork alone, it was estimated that<br />
flood damage ran to 100 million euros as a dam<br />
equipped with a new 50-metre-wide spillway designed<br />
to cope with an extreme flood, failed to<br />
cope. The River Lee burst its banks and flooded<br />
the centre <strong>of</strong> Cork, Ireland’s second largest city.<br />
“Failure to act now will put our society at<br />
an unacceptable risk,” said the IAE’s president,<br />
Michael Hayden. “You’ve only to think<br />
<strong>of</strong> Hurricane Katrina for an example <strong>of</strong> how<br />
climate change coupled with poor planning<br />
and zoning decisions can lead to social and<br />
economic disaster.”<br />
In a week when the country’s major rivers<br />
burst their banks, the academy warned that<br />
homes in coastal cities could become uninsurable<br />
unless urgent measures were taken and<br />
cited Benjamin Franklin’s adage: “An ounce <strong>of</strong><br />
prevention is worth a pound <strong>of</strong> cure.”<br />
The IAE further predicted that unless urgent<br />
action was taken to strengthen critical infrastructure<br />
the following would happen: changing<br />
rainfall patterns would affect water supplies;<br />
rising sea levels would inundate coastal<br />
cities and towns; severe weather incidents<br />
would damage energy installations, hospitals,<br />
telecommunications, railways and other critical<br />
infrastructure, and contaminate water supplies.<br />
The Irish Sunday Tribune newspaper noted<br />
in an editorial other factors that played a role<br />
in the November flooding which saw thousands<br />
<strong>of</strong> people evacuated from their homes:<br />
“The legacy <strong>of</strong> the past decade has been one<br />
<strong>of</strong> appalling and corrupt planning decisions<br />
which have allowed building on flood plains;<br />
building regulations that allowed uninsulated,<br />
energy-inefficient homes to be thrown up anyhow,<br />
anywhere; inadequate flood management<br />
schemes which at times have been poorly<br />
managed; and now last week, the failure to<br />
have a fully working flood emergency plan in<br />
operation should the worst happen has added<br />
to the misery <strong>of</strong> tens <strong>of</strong> thousands <strong>of</strong> people.”
The Green Party Minister for the Environment<br />
John Gormley said in January <strong>2010</strong> that the<br />
floods showed up the “questionable nature”<br />
<strong>of</strong> development decisions made by some local<br />
authorities, 19 <strong>of</strong> whom had to be compensated<br />
by the government for emergency services<br />
<strong>Red</strong>ucing the effects <strong>of</strong> climate change:<br />
Local planning for adaptation and disaster<br />
risk reduction<br />
provided during the flooding. He also ordered<br />
a major review <strong>of</strong> the remit <strong>of</strong> the Environmental<br />
Protection Agency and announced a three-year<br />
water conservation investment plan as water<br />
losses continue to be a major problem in many<br />
parts <strong>of</strong> the country despite the rainfall. �<br />
Much recent climate change policy has stressed the ‘co-benefits’ <strong>of</strong> mitigation strategies:<br />
the ways in which reducing greenhouse gas emissions can meet broader goals <strong>of</strong> increased<br />
energy independence, lower costs and higher quality <strong>of</strong> life. However, for a large proportion<br />
<strong>of</strong> the world’s urban population, this is <strong>of</strong> limited value as their emissions are already<br />
extremely low but there are many strong co-benefits between climate change adaptation and<br />
development. This includes disaster risk reduction but also addresses slow-onset changes<br />
such as the salinization <strong>of</strong> groundwater which affect the accumulation <strong>of</strong> risk over time.<br />
For practical purposes such as policy design, the distinction between natural variability<br />
(including extreme events) and incremental variability due to climate change is trivial –<br />
the key is to recognize and address underlying factors causing vulnerability. A starting<br />
point for reducing climate risk, therefore, is a better understanding <strong>of</strong> the particular<br />
hazards and vulnerability faced by urban centres. This is a context-specific process but<br />
there are several underlying principles that can be followed. Firstly, projected climate<br />
scenarios and their potential impacts need to be understood but their limitations also<br />
need to be known. Future projections contain a wide range <strong>of</strong> uncertainties in relation<br />
to both the absolute extent <strong>of</strong> climate change and the ways in which this will be experienced<br />
at the geographical scale <strong>of</strong> the city. Secondly, a detailed analysis needs to be<br />
undertaken to identify the most vulnerable groups, areas, sectors and how they may be<br />
affected – a process that has much in common with assessing vulnerability to disasters.<br />
Thirdly, the combined impacts <strong>of</strong> direct and indirect factors need to be taken into<br />
account – recognizing both the effects <strong>of</strong> climate change and the implications for urban<br />
residents <strong>of</strong> policies formulated to address these. Finally, existing capacities to respond<br />
and adapt must be assessed. With the exception <strong>of</strong> the climate projection component,<br />
this is already good practice in identifying vulnerability to a range <strong>of</strong> extreme events.<br />
Climate change adaptation and disaster risk reduction that<br />
meet the needs <strong>of</strong> the urban poor<br />
Urban governance is increasingly accepted as a multifaceted process involving a range<br />
<strong>of</strong> stakeholders, including civil society organizations, the private sector, the academic<br />
and research community, and the formal mechanisms <strong>of</strong> local government. Building<br />
<strong>World</strong> <strong>Disasters</strong> <strong>Report</strong> <strong>2010</strong> – Focus on urban risk<br />
125
Box 6.4 After the storm<br />
126<br />
After the storm a tentative blackbird chorus,<br />
silent throughout it, started cheeping again.<br />
The city, for fear <strong>of</strong> a worse overflow,<br />
had unlocked dams, so water levels rose<br />
at an alarming rate; the rivers burst<br />
their banks, swamping fields in a sea <strong>of</strong> rain,<br />
and flooded low-lying districts in one go,<br />
the waters sparing neither man nor beast.<br />
Square miles shrank as a sudden deluge rushed<br />
from the rain-sodden hills. Ye nymphes <strong>of</strong> Bandon,<br />
where were you when the great south-facing windows<br />
<strong>of</strong> heaven were opened and it bucketed down<br />
on quiet Munster? No one had imagined<br />
embankments would give way under the surge,<br />
the river Lee engulfing market towns’<br />
water mains, drains and residential lanes.<br />
It struck in late November, so by and large<br />
no ripening crops suffered, no standing grain,<br />
but hayl<strong>of</strong>ts were awash and much <strong>of</strong> the hard<br />
work <strong>of</strong> the summer proved to be in vain.<br />
Reservoirs, lakes poured down in a tide <strong>of</strong> mud<br />
submerging farms. An astonishing six inches<br />
fell in a single night from inky cloud.<br />
Not much distinction now between sea and land:<br />
some sat in dinghies rowing where they’d sown,<br />
navigating their own depth-refracted ground<br />
and scaring rainbow trout among the branches.<br />
Global warming, <strong>of</strong> course, but more like war<br />
as if dam-busting bombers had been here:<br />
aerial photographs <strong>of</strong> the worst-hit areas<br />
showed roads, bridges, basic infrastructure<br />
devastated, the sort <strong>of</strong> thing you expect<br />
in China or Louisiana but not in Cork.<br />
Detritus <strong>of</strong> the years, carpet and car,<br />
computers and a wide range <strong>of</strong> expensive<br />
gadgetry went spinning down the river<br />
with furniture and linen, crockery, shoes<br />
and clothes, until it finally gave over;<br />
not everyone had full insurance cover.
The inquiry dealt only with technical issues,<br />
avoiding larger questions. Telephone<br />
lines down, ‘boil water’ notices in force,<br />
drainage schemes overwhelmed and <strong>of</strong> no use,<br />
authorities hinted that it could’ve been worse.<br />
(There would be building work for months to come,<br />
developers would have no cause to complain.)<br />
A general cleaning-up operation began;<br />
houses, garages, skips gleamed with the slime<br />
deposited everywhere like a disease.<br />
We will get over it though we’re not sure how.<br />
The country sighed in the calm after the storm,<br />
emergency services set themselves to the grim<br />
sequel as drowned townlands emerged at last,<br />
the earth increasing as the flow decreased.<br />
The birds, crowing and piping with relief,<br />
announced a partial return to normal life<br />
and light shone in the cloud until next time.<br />
It’s snow and black ice we’ve to contend with now.<br />
‘After the storm’ by Derek Mahon,<br />
from An Autumn Wind (<strong>2010</strong>)<br />
by kind permission <strong>of</strong> the author and<br />
The Gallery Press (www.thegallerypress.com)<br />
resilience to disasters and climate change requires the involvement <strong>of</strong> all these actors.<br />
However, it is important that responses take into account the particular circumstances<br />
<strong>of</strong> the urban poor who are generally the most vulnerable both to extreme events and<br />
to slow-onset changes. There are several specific ways in which adaptation to climate<br />
change and disaster risk reduction can take this into account:<br />
Ensure that infrastructure works for the poor. New infrastructure – particularly<br />
for the provision <strong>of</strong> water, sanitation and drainage – is an important aspect <strong>of</strong> urban<br />
adaptation to climate change and to building broader resilience. Yet too <strong>of</strong>ten, existing<br />
infrastructure is poorly maintained. Often it is poor maintenance <strong>of</strong> storm and<br />
surface drains that contributes so much to flooding – for instance, for many cities,<br />
the need to de-silt them and clear them <strong>of</strong> garbage before the monsoon rains come.<br />
Improving waste collection services from low-income communities can reduce flooding<br />
at times <strong>of</strong> heavy rain and can improve child health through reducing exposure<br />
to disease. Effective transportation systems can enable low-income groups to live in<br />
safer physical surroundings while still being able to access employment and livelihood<br />
opportunities.<br />
<strong>World</strong> <strong>Disasters</strong> <strong>Report</strong> <strong>2010</strong> – Focus on urban risk<br />
127
Rainfall totals for<br />
November 2009<br />
in Ireland were the<br />
highest on record,<br />
and large parts <strong>of</strong><br />
the city <strong>of</strong> Cork and<br />
surrounding areas<br />
were flooded when<br />
the River Lee burst<br />
its banks.<br />
© The Irish Examiner<br />
128<br />
Support slum and squatter upgrading. Where large numbers <strong>of</strong> people live in poorquality<br />
housing in informal settlements, improving housing and getting basic infrastructure<br />
in place is a priority for adaptation. However, it is important to make sure that these new<br />
houses and infrastructure are constructed in such a way that they can withstand likely future<br />
changes in climate. In association with this, it is important to address related social issues:<br />
people and communities who are healthier, better educated and with secure tenure are more<br />
able to deal effectively with a wide range <strong>of</strong> shocks and stresses, including one-<strong>of</strong>f extreme<br />
events and climate change. Ongoing action to improve the provision <strong>of</strong> public services can<br />
provide households with a firmer base from which to face the challenges <strong>of</strong> climate change.<br />
Urban planning, management and governance are all now firmly on the IPCC agenda.<br />
Reconsider zoning, planning and building regulations. Zoning and planning controls<br />
have <strong>of</strong>ten served to exclude a large proportion <strong>of</strong> the urban population in low-<br />
and middle-income nations from legal land markets. The identification <strong>of</strong> ‘vulnerable’<br />
land in preparing for climate change should not be used in the same way. Instead, these<br />
controls can be used to help provide appropriate and safe locations for low-income<br />
households while reducing their exposure to the risks <strong>of</strong> flooding, slope failure and<br />
other disasters. The application <strong>of</strong> building standards that are appropriate to local contexts,<br />
including affordability, and used in ways that support incremental improvements<br />
can make housing resistant to extreme weather, while still enabling poor residents living<br />
in self-built or artisan-built constructions to upgrade at an appropriate pace and cost.
Ensuring climate and disaster preparedness<br />
in key urban sectors<br />
Engaging with a wide range <strong>of</strong> stakeholders is key to ensuring that adaptation and disaster<br />
risk reduction actions meet the needs <strong>of</strong> a broad cross-section <strong>of</strong> urban residents.<br />
This approach has been used by several major stakeholders and projects as the means<br />
<strong>of</strong> engaging in climate change adaptation in urban areas. Both the Asian Cities Climate<br />
Change Resilience Network and UN-Habitat’s Cities in Climate Change Initiative<br />
use multi-stakeholder engagement processes to support urban adaptation. However,<br />
many specific actions need to be taken at a sectoral level. As Table 6.3 shows, many <strong>of</strong><br />
these specific actions in water supply provision, storm and flood-water management,<br />
public health, energy and transportation meet both climate change and disaster risk<br />
reduction objectives.<br />
Table 6.3 Examples <strong>of</strong> climate change and disaster preparedness goals and actions<br />
Priority planning area Preparedness goal Preparedness actions<br />
Water supply Expand and diversify water supply �� Develop new groundwater sources<br />
�� Construct new surface water reservoirs<br />
�� Enhance existing groundwater supplies<br />
through aquifer storage and recovery<br />
�� Develop advanced wastewater treatment<br />
capacity for water re-use<br />
<strong>Red</strong>uce demand / improve efficiency �� Increase billing rates for water<br />
�� Change building codes to require low-flow<br />
plumbing fixtures<br />
�� Provide incentives (e.g., tax breaks,<br />
rebates) for switching to more waterefficient<br />
processes<br />
Increase drought preparedness �� Update drought management plans to<br />
recognize changing conditions<br />
Increase public awareness about impacts on �� Provide information on climate change<br />
water supplies<br />
impacts to water supplies and how<br />
residents can reduce water use in utility<br />
inserts, newsletters, web sites, local<br />
newspapers<br />
Storm- and flood-water Increase capacity to manage storm water �� Increase capacity <strong>of</strong> storm-water collection<br />
management<br />
systems<br />
�� Modify urban landscaping requirements to<br />
reduce storm-water run<strong>of</strong>f<br />
�� Preserve ecological buffers (e.g., wetlands)<br />
<strong>Red</strong>uce property damage from flooding �� Move or abandon infrastructure in<br />
hazardous areas<br />
�� Change zoning to discourage development<br />
in flood hazard areas<br />
�� Update building codes to require more<br />
flood-resistant structures in floodplains<br />
Improve information to manage storm and �� Increase the use <strong>of</strong> climate and weather<br />
flood events<br />
information in managing risk and events<br />
�� Update flood maps to reflect change risk<br />
associated with climate change<br />
<strong>World</strong> <strong>Disasters</strong> <strong>Report</strong> <strong>2010</strong> – Focus on urban risk<br />
129
Public health <strong>Red</strong>uce impacts <strong>of</strong> extreme heat events �� Improved early warning systems for<br />
extreme heat events<br />
�� Open additional cooling centres during<br />
extreme heat events<br />
�� Increase use <strong>of</strong> shade trees to reduce<br />
urban temperatures<br />
Improve disease surveillance and protection �� Increase monitoring <strong>of</strong> known diseases and<br />
potential diseases moving into the area<br />
�� Increase public education on disease<br />
prevention for vector-borne illnesses that<br />
could increase as a result <strong>of</strong> climate change<br />
Energy Ensure consistency <strong>of</strong> energy supplies while<br />
expanding to low-income groups<br />
130<br />
<strong>Red</strong>uce greenhouse gas emissions associated<br />
with energy use<br />
Transportation Ensure that transportation network functions<br />
despite changes in temperature and<br />
precipitation<br />
Ensure that transportation system facilitates<br />
rapid emergency responses<br />
Financing urban adaptation<br />
�� Strengthening <strong>of</strong> overhead transmission<br />
and distribution infrastructure<br />
�� Underground cabling for utilities<br />
�� <strong>Red</strong>uced dependence on single sources <strong>of</strong><br />
energy<br />
�� Energy efficiency<br />
�� Use <strong>of</strong> renewable sources<br />
�� Realignment or relocation <strong>of</strong> transport<br />
infrastructure<br />
�� Improved design standards and planning<br />
for roads, rail and other infrastructure<br />
�� Effective emergency plans for utilizing<br />
transportation networks for evacuations, etc.<br />
Source: Adapted from ICLEI (2007) and IPCC (2007)<br />
Meeting the challenges <strong>of</strong> climate change will require considerable investment in infrastructure<br />
and services – particularly in low- and middle-income nations. However,<br />
many <strong>of</strong> the existing assessments <strong>of</strong> adaptation costs have been based on present investment<br />
in infrastructure and have not taken into account the infrastructure deficit (the<br />
current shortfall in infrastructure provision for cities under existing climatic conditions)<br />
present in many cities in low- and middle-income nations. Any realistic measure<br />
<strong>of</strong> the costs <strong>of</strong> adaptation in urban areas therefore needs to be informed by an analysis<br />
<strong>of</strong> current disaster risks and the required investment in housing, early warning systems<br />
and rapid and effective post-event responses including temporary accommodation,<br />
restoring access to services, supporting rapid return to damaged settlements and supporting<br />
rebuilding.<br />
However, new funding pathways are currently being developed that are intended to<br />
support investment in adaptation to climate change. Some <strong>of</strong> these fall under the<br />
banner <strong>of</strong> traditional overseas development assistance. Others are coordinated under<br />
the UNFCCC, although their precise nature is the focus <strong>of</strong> ongoing UNFCCC
negotiations. However, there are no clear mechanisms through which international<br />
climate change adaptation funds can be transferred to local governments (including<br />
city authorities) and many urban interventions, including financing for large-scale<br />
infrastructural projects, fail to assess the likely impacts <strong>of</strong> climate change.<br />
Towards urban resilience<br />
The ultimate objective <strong>of</strong> disaster risk reduction and climate change adaptation is<br />
to produce resilient cities. Rather than focusing on anticipating specific hazards –<br />
whether these are short-term disaster risks or longer-term changes in climate – city<br />
stake holders, particularly in low- and middle-income nations, ought to take a broader,<br />
integrated approach that addresses both current and future development needs.<br />
Resilience therefore takes into account the economic, social, psychological, physical<br />
and environmental factors that are necessary for humans to survive and to thrive.<br />
Locally rooted strategies to build resilience need to incorporate a strong focus on both<br />
disaster risk reduction and climate change adaptation and need to be embedded within<br />
a city’s institutional and organizational framework.<br />
Many aspects <strong>of</strong> resilience are closely associated with a holistic approach to development.<br />
Individuals and households that have access to adequate food, clean water,<br />
healthcare and education will inevitably be better prepared to deal with a variety <strong>of</strong><br />
shocks and stresses – including those arising due to climate change.<br />
Box 6.5 Building resilience as a strategy for climate change<br />
adaptation and disaster risk reduction<br />
Resilient towns and cities are able to withstand<br />
a variety <strong>of</strong> challenges. As well as helping to<br />
manage the challenge <strong>of</strong> climate change, increasing<br />
resilience generates a wide range <strong>of</strong><br />
additional advantages. The Resilience Alliance<br />
and the Asian Cities Climate Change Resilience<br />
Network suggest that urban resilience involves<br />
the following components:<br />
�� <strong>Red</strong>undancy. When one system is disrupted,<br />
another system can provide similar<br />
services. For example, if individuals are<br />
trained in basic health and emergency<br />
responses, they are able to provide immediate<br />
support if transportation and communication<br />
systems are disrupted following an<br />
extreme event.<br />
�� Flexibility. The failure <strong>of</strong> a single system<br />
causes a minimal impact to other systems.<br />
For example, a city with a diversified economic<br />
base will avoid catastrophic failure<br />
if a single industry fails due to economic<br />
change or environmental disaster.<br />
�� Capacity to reorganize. Climate<br />
change will result in changing conditions<br />
– and resilient cities are able to introduce<br />
new structures, organizations and land-use<br />
measures in response to this.<br />
�� Capacity to learn. This ensures that<br />
future decisions are made on the basis<br />
<strong>of</strong> relevant information and appropriate<br />
forethought.<br />
Source: ISET, 2009<br />
<strong>World</strong> <strong>Disasters</strong> <strong>Report</strong> <strong>2010</strong> – Focus on urban risk<br />
131
Creating resilient<br />
towns is not only a<br />
question <strong>of</strong> improved<br />
infrastructure, but also<br />
<strong>of</strong> raising communities’<br />
awareness <strong>of</strong> the<br />
hazards they may<br />
face. In Samoa,<br />
residents learn how to<br />
map out disaster and<br />
health risks.<br />
© Rob Few/IFRC<br />
132<br />
Integrated actions and multi-stakeholder<br />
approaches<br />
Creating more resilient towns and cities that are able to cope with disaster risks and<br />
climate change requires action by a range <strong>of</strong> stakeholders. These can include those who<br />
are (or are likely to be) affected, those who have technical expertise, those who have<br />
financial resources and those with authority for decision-making. These stakeholders<br />
can then come together as steering committees or working groups to address particular<br />
issues. As the Saint-Louis case study shows, the combined knowledge, skill and<br />
political influence <strong>of</strong> groups working together is able to generate more effective results<br />
than individual organizations working on their own. Development and humanitarian<br />
organizations can also modify their programmes, policies and practices to address<br />
climate change in urban areas more effectively. These organizations can also facilitate a<br />
range <strong>of</strong> household coping strategies through their actions.<br />
Conclusion<br />
Work got under way in earnest this year on the IPCC’s Fifth Assessment <strong>Report</strong> which<br />
will look closely at urbanization processes and is due for delivery in 2014. This is<br />
just one year prior to the ultimate date, 2015, set by the IPCC for global emissions
to peak if the planet is to have a chance <strong>of</strong> limiting temperature increase to between<br />
2 and 2.4 degrees Celsius. The general acceptance by the G8 <strong>of</strong> a 2 degrees Celsius<br />
ceiling may still be too much for many coastal cities’ defences and this needs to be<br />
recognized sooner rather than later when it comes to investment in disaster risk reduction.<br />
Entrenched dichotomies between climate change adaptation and disaster risk<br />
reduction need to be dismantled long before then to enable a focus on building urban<br />
resilience. The <strong>International</strong> <strong>Federation</strong> <strong>of</strong> <strong>Red</strong> <strong>Cross</strong> and <strong>Red</strong> Crescent Societies for<br />
example, in its Strategy 2020, addresses climate change adaptation “through scaling up<br />
disaster risk reduction measures and strengthening traditional methods <strong>of</strong> coping with<br />
disasters that are relevant in particular environmental contexts”.<br />
Climate change will have both a quantitative and a qualitative impact on the risks<br />
facing urban areas in coming decades. In particular, the inability to predict future<br />
emissions scenarios and the lack <strong>of</strong> precise knowledge about the impacts that these<br />
will have on the global climatic system means that urban residents and authorities will<br />
have to deal with an increasing level <strong>of</strong> uncertainty around the frequency and intensity<br />
<strong>of</strong> extreme weather events. Many countries still have some way to go in order to catch<br />
up with reality: a WMO survey in 2006 showed that more than 60 per cent <strong>of</strong> its 189<br />
members are inadequately equipped to warn populations against hazards, particularly<br />
in most vulnerable countries. It seems remarkable that it was only in April <strong>2010</strong> that<br />
30 ministers in charge <strong>of</strong> meteorology in Africa met for the first time under the auspices<br />
<strong>of</strong> WMO and the African Union, given that Africa is so poorly equipped to deal<br />
with climate change at both urban and rural levels.<br />
When combined with increasing levels <strong>of</strong> urbanization and ongoing social and environmental<br />
problems in towns and cities, risk and vulnerability for many urban residents<br />
are likely to be exacerbated. The impacts <strong>of</strong> climate change will be distributed<br />
unevenly within urban populations, with low-income groups being particularly vulnerable<br />
due to their greater exposure to hazards and their lower levels <strong>of</strong> adaptive<br />
capacity. A focus on building resilience to cope with uncertainty, rather than applying<br />
solutions based on specific scenarios, is therefore the best way <strong>of</strong> protecting the lives<br />
and livelihoods <strong>of</strong> urban residents.<br />
The actions taken by urban authorities, civil society organizations and humanitarian<br />
agencies in urban areas can make a substantial difference to the ability <strong>of</strong> towns and<br />
cities – and their residents – to respond to disasters and climate change. For city<br />
dwellers in low-income and many middle-income countries, the biggest single issue is<br />
the infrastructure deficit – the inability <strong>of</strong> urban systems to deal with current climate<br />
variability. Many <strong>of</strong> the hazards and risks facing cities as a result <strong>of</strong> climate change are<br />
modifications to existing hazards and risks – and cities that are unable to deal with<br />
the challenges <strong>of</strong> today will be unable to deal with the new climate challenges <strong>of</strong> the<br />
future. Improved planning for disaster risks, including better short-term forecasting<br />
<strong>of</strong> shocks, is therefore also a key component for responding to climate change. At the<br />
<strong>World</strong> <strong>Disasters</strong> <strong>Report</strong> <strong>2010</strong> – Focus on urban risk<br />
133
CHAPTER 6<br />
134<br />
same time, the development <strong>of</strong> sound responses to existing patterns <strong>of</strong> risk will form a<br />
solid basis with which to deal with those that are genuinely new. These measures need<br />
to be considered within an overall framework <strong>of</strong> a global transition to a low-carbon<br />
economy in order to minimize the risk <strong>of</strong> dangerous climate change taking place in the<br />
coming decades.<br />
Chapter 6 and Box 6.1 were written by David Dodman, Senior Researcher, Human<br />
Settlements and Climate Change Groups at the <strong>International</strong> Institute for Environment and<br />
Development, London. Box 6.2 was written by Khady Diagne from the NGO, Enda-Tiers<br />
Monde; Box 6.3 was written by Denis McClean, <strong>World</strong> <strong>Disasters</strong> <strong>Report</strong> editor; Box 6.4<br />
is a contribution from poet Derek Mahon; and Box 6.5 was written by the Institute for<br />
Social and Environmental Transition (ISET).
Sources and further information<br />
Adelekan, I. ‘Vulnerability <strong>of</strong> poor urban coastal communities to flooding in Lagos,<br />
Nigeria’ in Environment and Urbanization, Vol. 22, No. 2, <strong>2010</strong>.<br />
Alejandra, M. and Takanashi, K. ‘Vulnerability and Adaptation to Climate Change<br />
in Central Peruvian Andes Cities: report <strong>of</strong> pilot study’ in Proceedings <strong>of</strong> the<br />
8th <strong>International</strong> Conference on Southern Hemisphere Meteorology and Oceanography,<br />
24–28 April, Foz de Iguazu, Brazil, 2006.<br />
Awosika, L. et al. ‘Sea level rise on African coastal zone’ in Nigerian Institute for<br />
Oceanography and Marine Research, Vol. 12, No. 3, pp. 14–16, 1991.<br />
Ayers, J. ‘<strong>International</strong> funding to support urban adaptation to climate change’ in<br />
Environment and Urbanization, Vol. 21, No. 1, pp. 225–240, 2009.<br />
Bartlett, S. ‘Climate change and urban children: impacts and implications for adaptation<br />
in low- and middle-income countries’ in Environment and Urbanization,<br />
Vol. 20, No. 2, pp. 501–519, 2008.<br />
Bloomberg, M. and Aggarwala, R. ‘Think Locally, Act Globally: how curbing<br />
global warming emissions can improve local public health’ in American Journal <strong>of</strong><br />
Preventative Medicine, Vol. 35, No. 5, pp. 414–423, 2008.<br />
Boko, M. et al. ‘Africa’, in Parry, M.L. et al. (eds), Climate Change 2007: Impacts,<br />
Adaptation and Vulnerability. Contribution <strong>of</strong> Working Group II to the Fourth<br />
Assessment <strong>Report</strong> <strong>of</strong> the Intergovernmental Panel on Climate Change. Cambridge:<br />
Cambridge University Press, 2007.<br />
de Sherbinin, A., Schiller, A. and Pulsipher, A. ‘The vulnerability <strong>of</strong> global cities to<br />
climate hazards’ in Environment and Urbanization, Vol. 19, No. 1, pp. 39–64, 2007.<br />
Dodman, D. ‘Urban form, greenhouse gas emission and climate vulnerability’ in<br />
Guzmán, J. et al., Population Dynamics and Climate Change. United Nations<br />
Population Fund (UNFPA) and <strong>International</strong> Institute for Environment and<br />
Development (IIED), 2009.<br />
Dodman, D. ‘Blaming cities for climate change? An analysis <strong>of</strong> urban greenhouse<br />
gas emissions inventories’ in Environment and Urbanization, Vol. 21, No. 1,<br />
pp. 185–201, 2009.<br />
Dodman, D., Ayers, J. and Huq, S. ‘Building Resilience’ in <strong>World</strong>watch Institute, State<br />
<strong>of</strong> the <strong>World</strong> 2009: Into a Warming <strong>World</strong>. Washington DC: <strong>World</strong>watch Institute,<br />
2009.<br />
Dodman, D. and Satterthwaite, D. ‘Institutional capacity, climate change adaptation<br />
and the urban poor’ in IDS Bulletin, Vol. 39, No. 4, pp. 67–74, 2008.<br />
<strong>World</strong> <strong>Disasters</strong> <strong>Report</strong> <strong>2010</strong> – Focus on urban risk<br />
135
CHAPTER 6<br />
136<br />
Dossou, K. and Gléhouenou-Dossou, B. ‘The vulnerability to climate change <strong>of</strong><br />
Cotonou (Benin): the rise in sea level’ in Environment and Urbanization, Vol. 19,<br />
No. 1, pp. 65–79, 2007.<br />
El-Raey, M. ‘Vulnerability assessment <strong>of</strong> the coastal zone <strong>of</strong> the Nile Delta <strong>of</strong> Egypt<br />
to the impact <strong>of</strong> sea level rise’ in Ocean and Coastal Management, Vol. 37, No. 1,<br />
pp. 29–40, 1997.<br />
ICLEI. Preparing for Climate Change: a guidebook for local, regional and state governments.<br />
Center for Science in the Earth System (The Climate Impacts Group), Joint<br />
Institute for the Study <strong>of</strong> the Atmosphere and Ocean (University <strong>of</strong> Washington)<br />
and King County Washington, 2007. Available online: www.ecy.wa.gov/climatechange/docs/CCguidebook_localgovs_2007.pdf.<br />
Intergovernmental Panel on Climate Change (IPCC). Statement <strong>of</strong> R.K. Pachauri,<br />
Chairman, IPCC to the UN Summit on Climate Change, 22 September 2009.<br />
Available online: www.ipcc.ch/pdf/presentations/rkp-statement-unccs-09.pdf.<br />
IPCC. The Fourth Assessment <strong>Report</strong>: Climate Change 2007. Geneva: IPCC, 2007.<br />
Available online: www.ipcc.ch/publications_and_data/publications_and_data_<br />
reports.htm#1.<br />
IPCC. The Regional Impacts <strong>of</strong> Climate Change:An assessment <strong>of</strong> vulnerability. Geneva:<br />
IPCC, 2001. Available online: www.grida.no/climate/ipcc/regional/index.htm.<br />
<strong>International</strong> <strong>Federation</strong> <strong>of</strong> <strong>Red</strong> <strong>Cross</strong> and <strong>Red</strong> Crescent Societies. Strategy 2020.<br />
Geneva: IFRC, <strong>2010</strong>. Available online: www.ifrc.org.<br />
Institute for Social and Environmental Transition (ISET). Asian Cities Climate Change<br />
Resilience Network – Responding to the Urban Climate Challenge. Boulder, Colorado:<br />
ISET, 2009. Available online: www.rockefellerfoundation.org/news/publications/<br />
acccrn-responding-urban-climate.<br />
Irish Academy <strong>of</strong> Engineering. Ireland At Risk – Critical Infrastructure and Climate<br />
Change. Dublin: IAE, 2009. Available online: www.iae.ie/site_media/pressroom/<br />
documents/2009/Nov/17/Ireland_at_Risk_2.pdf.<br />
Kovats, R.S. and Koppe, C. ‘Heat waves past and future impacts on health’, in Ebi,<br />
K., Smith, J. and Burton, I. (eds.), Integration <strong>of</strong> Public Health with Adaptation<br />
to Climate Change: Lessons learned and new directions. London: Taylor & Francis<br />
Group, 2005.<br />
Kovats, R.S. and Akhtar, R. ‘Climate, climate change and health in Asian cities’ in<br />
Environment and Urbanization, Vol. 20, No. 1, pp. 165–175, 2008.<br />
Lebel, L. et al. ‘Integrating Carbon Management into the Development Strategies <strong>of</strong><br />
Urbanizing Regions in Asia: implications <strong>of</strong> urban function, form, and role’ in<br />
Journal <strong>of</strong> Industrial Ecology, Vol. 11, No. 2, pp. 61–81, 2007.
Mata, J. L. and Nobre, C. Background paper: Impacts, vulnerability and adaptation to<br />
climate change in Latin America. Presented at UNFCCC Regional Workshop on<br />
Latin American Adaptation, Lima, 18–20 April 2006.<br />
McGranahan, G., Balk, D. and Anderson, B. ‘The rising tide: assessing the risks<br />
<strong>of</strong> climate change and human settlements in low elevation coastal zones’ in<br />
Environment and Urbanization, Vol. 19, No. 1, pp. 17–37, 2007.<br />
Neira Carrasco, J. Medidas asumidas por el Municipio del Distrito de Quito para afrontar<br />
los efectos del cambio climático. 2007. Available online: www.comunidadandina.org/<br />
desarrollo/cl_JuanNeira.pdf.<br />
Patt, A., Dazé, A. and Suarez, P. ‘Gender and climate change vulnerability: what’s the<br />
problem, what’s the solution?’ in Ruth, M. and Ibarraran, M. (eds.), Distributional<br />
Impacts <strong>of</strong> Climate Change and <strong>Disasters</strong>: Concepts and Cases. Cheltenham: Edward<br />
Elgar, 2009.<br />
Schneider, S. et al. ‘Assessing key vulnerabilities and the risk from climate change’<br />
in Parry, M. et al. (eds.), Climate Change 2007: Impacts, Adaptation and<br />
Vulnerability. Contribution <strong>of</strong> Working Group II to the Fourth Assessment <strong>Report</strong> <strong>of</strong><br />
the Intergovernmental Panel on Climate Change. Cambridge: Cambridge University<br />
Press, 2007.<br />
Satterthwaite, D. and Dodman, D. ‘The costs <strong>of</strong> adapting infrastructure to climate<br />
change’ in Parry, M. et al., Assessing the costs <strong>of</strong> adaptation to climate change: a review<br />
<strong>of</strong> the UNFCCC and other recent estimates. London: IIED/Grantham Institute,<br />
2009.<br />
Tacoli, C. ‘Crisis or Adaptation? Migration and climate change in a context <strong>of</strong> high<br />
mobility’ in Guzmán, J. et al., Population Dynamics and Climate Change. UNFPA/<br />
IIED, 2009.<br />
United Nations Human Settlements Programme (UN-Habitat). Cities in Climate<br />
Change Initiative. Nairobi: UN-Habitat, 2008. Available online: www.unhabitat.<br />
org/pmss/listItemDetails.aspx?publicationID=2565.<br />
Wilbanks, T. et al. ‘Industry, Settlement and Society’ in Parry, M. et al. (eds.), Climate<br />
Change 2007: Impacts, Adaptation and Vulnerability. Contribution <strong>of</strong> Working Group<br />
II to the Fourth Assessment <strong>Report</strong> <strong>of</strong> the Intergovernmental Panel on Climate Change.<br />
Cambridge: Cambridge University Press, 2007.<br />
<strong>World</strong> Meteorological Organization (WMO). WMO statement on the status <strong>of</strong> the<br />
global climate in 2009. Geneva: WMO, <strong>2010</strong>. Available online: www.wmo.ch/<br />
pages/prog/wcp/wcdmp/documents/WMOStatement2009.pdf.<br />
WWF. Mega-Stress for Mega-Cities: A Climate Vulnerability Ranking <strong>of</strong> Major Coastal<br />
Cities in Asia. Gland, Switzerland: WWF, 2009. Available online: http://assets.<br />
panda.org/downloads/mega_cities_report.pdf.<br />
<strong>World</strong> <strong>Disasters</strong> <strong>Report</strong> <strong>2010</strong> – Focus on urban risk<br />
137
CHAPTER 7<br />
138
Urban governance and<br />
disaster risk reduction<br />
This year sees an unprecedented level <strong>of</strong> attention on urban governance and sustainable<br />
urban development, not least in the new campaign being launched by the United<br />
Nations <strong>International</strong> Strategy for Disaster <strong>Red</strong>uction (UNISDR), Making Cities<br />
Resilient, which seeks the commitment <strong>of</strong> mayors, city leaders and local governments<br />
to concrete measures to reduce disaster risk, and to work on their implementation with<br />
community organizations, the private sector and national governments.<br />
According to the United Nations Human Settlements Programme (UN-Habitat), the<br />
Millennium Development Goal ‘slum target’ has been reached, improving the lives<br />
<strong>of</strong> 227 million people, particularly in China and India, but the population <strong>of</strong> slum<br />
dwellers around the world continues to grow at around 10 per cent annually. Lessons<br />
clearly need to be learned from this about how good urban management practices in<br />
some parts <strong>of</strong> the world can facilitate learning and help reduce risk in other parts where<br />
little progress is being made, particularly among the urban populations <strong>of</strong> sub-Saharan<br />
Africa and west Asia.<br />
The quality and capacity <strong>of</strong> local government in a city have an enormous influence on<br />
the level <strong>of</strong> risk that its population faces from disasters and, in particular, on whether<br />
risk-reducing infrastructure serves everyone including those living in low-income areas.<br />
Local or municipal governments also influence whether provision has been made to<br />
remove or reduce disaster risk from events such as floods and large-scale fires or to build<br />
into the city the capacity to withstand potential disaster events such as earthquakes.<br />
The quality and capacity <strong>of</strong> local government also have an enormous influence on the<br />
levels <strong>of</strong> risk from everyday hazards that can contribute much to mortality, injury or<br />
illness but that are not considered disasters, such as vector-borne diseases and traffic<br />
accidents. These risks are not an inherent characteristic <strong>of</strong> cities but the result <strong>of</strong> the<br />
limitations <strong>of</strong> their governments in meeting their responsibilities and, more broadly, <strong>of</strong><br />
limitations <strong>of</strong> governance including the quality <strong>of</strong> their relations with the inhabitants<br />
and civil society organizations.<br />
Most <strong>of</strong> what local governments do, or should be doing, is about reducing risks for<br />
their populations through ensuring services such as good provision for water, sanitation,<br />
drainage, solid waste collection, healthcare, all-weather access roads, electricity,<br />
emergency services and provision for transport and traffic management. They should<br />
also ensure health and safety standards are met. Even if provision for some <strong>of</strong> these<br />
are contracted to private enterprises or provided by higher levels <strong>of</strong> government, it is<br />
usually the responsibility <strong>of</strong> local government to coordinate or oversee their provision.<br />
Local governments that support meeting development needs reduce disaster risk. In<br />
<strong>World</strong> <strong>Disasters</strong> <strong>Report</strong> <strong>2010</strong> – Focus on urban risk<br />
Photo opposite page:<br />
In Aceh, Indonesia,<br />
builders work in<br />
difficult conditions<br />
under a very hot sun<br />
to construct a large<br />
water reservoir, built<br />
with support from<br />
the Indonesian and<br />
American <strong>Red</strong> <strong>Cross</strong><br />
Societies.<br />
© Vina Agustina/<br />
American <strong>Red</strong> <strong>Cross</strong><br />
139
CHAPTER 7<br />
140<br />
addition to key roles in pre-disaster damage limitation they also have an important role<br />
in post-disaster response and rebuilding.<br />
The concentration <strong>of</strong> people and enterprises in cities is <strong>of</strong>ten seen as increasing risk and<br />
exposure but it also means economies <strong>of</strong> scale and proximity for most forms <strong>of</strong> infrastructure,<br />
including roads, electricity, water and sanitation, and services such as public<br />
transport, communications, education, healthcare or good waste collection systems<br />
– all <strong>of</strong> which can contribute greatly to the reduction <strong>of</strong> risk. In a well-governed city,<br />
much <strong>of</strong> the disaster risk in terms <strong>of</strong> death and serious injury is enormously reduced<br />
by good-quality buildings and infrastructure. If these interventions do not prevent<br />
disasters, they can dramatically cut the death and injury tolls and should limit the<br />
economic impacts. This applies not just in cases <strong>of</strong> extreme weather or earthquakes<br />
but also for industrial accidents and fires. In the past, fires devastated many <strong>of</strong> the<br />
world’s wealthiest cities. Indeed, the city <strong>of</strong> Venice pushed its glass-making industries<br />
to a separate island, Murano, in the 13th century to reduce the risk <strong>of</strong> fire. In more<br />
recent times, fire risk reduction was built into building regulations and controls over<br />
enterprises and into rapid response capacity from emergency services. Unfortunately,<br />
such risk reduction is not present for most cities in low- and middle-income nations,<br />
or at least for their low-income districts.<br />
Chapter 1 described the web <strong>of</strong> institutions that help reduce or remove disaster risk in<br />
urban areas. In addition, a combination <strong>of</strong> land-use planning and management and the<br />
application <strong>of</strong> building standards should ensure that this continues even in a rapidly<br />
expanding city. In disaster situations, it may be easier to <strong>of</strong>fer emergency assistance<br />
and care to concentrated populations because the health infrastructure, road networks,<br />
airports, ports and communications systems are all in place. However, in most cities in<br />
low- and middle-income nations, a high proportion <strong>of</strong> the population is not served by<br />
any <strong>of</strong> the risk reduction measures noted above. If cities are not well governed and thus<br />
pay little or no attention to the measures that reduce disaster risk, the consequences<br />
<strong>of</strong> a disaster can be drastic. The recent earthquake that devastated Port-au-Prince and<br />
its surrounds in Haiti is an example <strong>of</strong> how dangerous a city can be if it is externally<br />
dependent and poorly governed with little institutional capacity, no emergency plans<br />
and little capacity or will to address the structural causes <strong>of</strong> vulnerability.<br />
A mismatch between the city’s population growth and the capacity to keep down risks,<br />
support good-quality housing and provide infrastructure and services is <strong>of</strong>ten blamed<br />
on population growth or on ‘uncontrolled urbanization’. Usually though, it is an institutional<br />
failure to keep up with economic developments which attract migrants. Much<br />
<strong>of</strong> what contributes to reducing disaster risk is the same as what is needed to satisfy<br />
everyday needs.<br />
However, even in well-governed cities, it is a challenge to get disaster risk reduction<br />
embedded in all the relevant sectors and agencies, as Box 7.1 on Durban shows. Here,
the city government has developed a municipal climate protection programme that is<br />
working in partnership with its disaster management branch but it is difficult for both<br />
to get buy-in from key sectors and support for disaster risk reduction when the city<br />
faces many pressing development needs and its budget is constrained by the recession.<br />
The uncertainty around levels <strong>of</strong> risk for many potential catalysts <strong>of</strong> disasters makes it<br />
difficult to provide the needed economic rationale for preventive measures.<br />
Box 7.1 Disaster preparedness and climate change adaptation<br />
in Durban, South Africa<br />
Durban is one <strong>of</strong> the few cities worldwide that<br />
has a municipal government which has developed<br />
a locally rooted climate change adaptation<br />
strategy. Developing this strategy has also<br />
made evident the need to strengthen the city’s<br />
disaster management capacity – disaster risk reduction<br />
needs to be embedded in the city’s sectoral<br />
departments and investment programmes.<br />
Durban is the largest port and city on the<br />
east coast <strong>of</strong> Africa and has around 3.7 million<br />
inhabitants. The municipal climate protection<br />
programme was initiated in 2004 with an impact<br />
analysis to identify the range and severity<br />
<strong>of</strong> climate change-related risks and the needed<br />
adaptation responses. It was difficult to get most<br />
sectors <strong>of</strong> government to act because <strong>of</strong> high<br />
workloads, extensive development challenges,<br />
the perception <strong>of</strong> climate change as a distant<br />
threat and a shortage <strong>of</strong> skills and funds, so it<br />
was decided to develop sector-specific adaptation<br />
plans that could be integrated into existing<br />
business plans and funding. The health and water<br />
sectors were selected as pilots because <strong>of</strong><br />
their high-risk pr<strong>of</strong>ile and political importance.<br />
The risk analysis showed that adaptation in<br />
these two key sectors could not eliminate disaster<br />
risks so there was a need for both disaster risk<br />
reduction and disaster preparedness. A disaster<br />
management municipal adaptation plan (MAP)<br />
was developed. This highlighted how disaster<br />
management in the city was focused on shortterm<br />
relief, such as handing out food and blankets,<br />
rather than proactively addressing strategic<br />
planning issues focused on disaster prevention.<br />
Disaster management also lacked the staff and<br />
‘institutional muscle’ to ensure all municipal departments<br />
engage in risk assessment, monitoring<br />
and response. The disaster management MAP<br />
identified five priorities:<br />
1. Implementing the disaster risk management<br />
framework. This identifies the prerequisites<br />
for effective disaster management within<br />
the city, i.e., integrated institutional capacity,<br />
disaster risk assessment, disaster risk reduction,<br />
response and recovery, information management<br />
and communication, education, training, public<br />
awareness and research, and funding. This<br />
framework was submitted to the council but implementing<br />
it is likely to be a lengthy procedure<br />
given that it involves institutional change.<br />
2. Comprehensive city-wide risk assessment.<br />
This is being developed through a partnership<br />
between the environmental planning and<br />
climate protection department and the disaster<br />
management branch.<br />
3. Strengthen the disaster management<br />
branch. Although much needed, it is<br />
difficult to secure the support given the constraints<br />
on the city budget.<br />
4. Revision <strong>of</strong> contingency plans for<br />
key risk areas. There is an immediate need<br />
to update existing contingency plans (particularly<br />
for priority risk areas). These should include<br />
considerations such as the need to establish<br />
emergency operation centres linked to an early<br />
warning system and regular rehearsal exercises.<br />
<strong>World</strong> <strong>Disasters</strong> <strong>Report</strong> <strong>2010</strong> – Focus on urban risk<br />
141
The management <strong>of</strong> the major hazard installation<br />
regulations (which govern the notification, risk<br />
assessment and emergency planning required<br />
<strong>of</strong> new and existing hazardous installations) also<br />
needs improvement.<br />
5. Hosting a disaster management<br />
summit. To help raise the pr<strong>of</strong>ile and awareness<br />
<strong>of</strong> the disaster management MAP including<br />
disaster risk reduction.<br />
142<br />
What has emerged from the development<br />
<strong>of</strong> the disaster management MAP is the sobering<br />
realization that despite the serious risks<br />
posed by climate change, basic institutional<br />
and resource challenges within local government<br />
are delaying appropriate planning and<br />
responses. These challenges will have to be<br />
met but they inevitably depend on political will<br />
and the ability to access additional funding.��<br />
Land-use management and disaster risk<br />
For almost all urban centres, it falls to local government to manage land use and this<br />
should ensure that dangerous sites, such as flood plains, are not built on, that there is<br />
adequate provision for schools and other services, that open space for parks and playgrounds<br />
is protected and that watersheds and natural coastal protective defences, such<br />
as mangroves and dunes, are preserved in an ecological manner. Land-use management<br />
also has to ensure that sufficient land with infrastructure is available for housing and<br />
enterprises. Local regulations on site development and buildings should ensure that<br />
new buildings meet health and safety standards. All this helps to reduce risks from<br />
everyday hazards and from disasters, especially when combined with the provision <strong>of</strong><br />
essential infrastructure and services. Indeed, they help stop extreme weather events<br />
becoming disasters. They should also be the means by which risks from earthquakes<br />
are much reduced. However, it is hard for any politician to gain votes by pointing to<br />
a disaster that did not happen and it is difficult, or even impossible, for the agencies<br />
concerned with disaster response to get attention paid to these deficiencies.<br />
Informal settlements in a city are a reflection <strong>of</strong> governance failures – especially in<br />
land-use management. They reflect a failure <strong>of</strong> local authorities to ensure sufficient<br />
land with infrastructure is available for new housing in appropriate locations. Very<br />
<strong>of</strong>ten this is linked to the lack <strong>of</strong> power and resources available to city governments and<br />
the disinterest <strong>of</strong> national government and international agencies in addressing city<br />
problems. The results are visible in almost all cities in low-income nations and most<br />
cities in middle-income nations: urban expansion is haphazard, determined by where<br />
different households, residential areas, enterprises and public sector activities locate<br />
and build, legally or illegally. There is no plan to guide this process or if there is, it is<br />
ignored. There are usually many regulations to prevent this but these are avoided or<br />
bypassed by politicians and real estate interests.<br />
As cities expand in an unplanned patchwork <strong>of</strong> high and low density, this greatly<br />
increases the costs <strong>of</strong> providing risk-reducing infrastructure and services. It also means<br />
the segregation <strong>of</strong> low-income groups in illegal settlements on the most hazardous sites<br />
such as those affected by periodic floods, sea surges, seasonal storms and land subsidence.
For many cities, including those mentioned in Box 7.2, disasters are not new. They have<br />
a record <strong>of</strong> disasters at different scales. The cases mentioned highlight institutional incapacity<br />
to address urbanization issues from different angles. When combined with lack <strong>of</strong><br />
accountability to citizens and little scope for citizen participation, this means little action<br />
to reduce risks in urban areas, especially where low-income groups live. For much urban<br />
expansion, the ‘solution’ to the lack <strong>of</strong> institutional capacity to manage land use has been<br />
to be outside the legal framework <strong>of</strong> building codes and land-use regulations, and outside<br />
the scope <strong>of</strong> <strong>of</strong>ficially recorded and legally sanctioned land transactions. In many cities,<br />
some high- and middle-income groups also occupy dangerous land sites but the possibility<br />
to reduce risk and receive emergency assistance and insurance coverage is much<br />
greater. City and municipal governments can thus be key players in disaster risk creation<br />
and amplification or in disaster risk reduction. This has been acknowledged for some<br />
time by the development and disaster response community, and several governments at<br />
national and regional levels have designed structures to support local governments.<br />
Box 7.2 Latin American cities expand over high-risk areas<br />
Much <strong>of</strong> the housing in Caracas, Venezuela,<br />
is built on slopes crossed by gorges that lead<br />
to the Guaire, the city’s main river. Low-income<br />
groups have settled on unstable land and in<br />
gorges, where their houses <strong>of</strong>ten act as barriers<br />
to natural water run-<strong>of</strong>f. In December<br />
1999, Venezuela experienced one-in-100-year<br />
rainfall and this caused massive landslides and<br />
floods that killed hundreds <strong>of</strong> people.<br />
After the floods in the city <strong>of</strong> Santa Fe,<br />
Argentina, in 2003 and again in 2007, city<br />
authorities recognized that for the last 50 years<br />
there had been no urban land policy and that<br />
people settled where and how they could,<br />
prioritizing proximity to workplaces or social<br />
networks.<br />
Managua, Nicaragua, is located on a strip<br />
<strong>of</strong> land where there are 18 active faults and a<br />
chain <strong>of</strong> volcanoes. In this city <strong>of</strong> 1.4 million<br />
The local nature <strong>of</strong> disaster risk<br />
people, 79 per cent <strong>of</strong> the houses are <strong>of</strong> bad or<br />
mediocre construction quality and 18 per cent<br />
need complete renovation. About 45,000 families<br />
live in 274 informal settlements, which lack<br />
access to water, sanitation and electricity. It is<br />
estimated that each year in Managua 3,000<br />
homes are built without authorization and thus<br />
with no oversight <strong>of</strong> the quality <strong>of</strong> construction.<br />
During Hurricane Mitch in 1998, the cities<br />
<strong>of</strong> Tegucigalpa and Comayaguela in Honduras<br />
were seriously affected. Most damage was concentrated<br />
around the four rivers that cross these<br />
cities. Inadequate city infrastructure, especially<br />
water, sanitation and drainage, lack <strong>of</strong> zoning<br />
codes, the concentration <strong>of</strong> services and infrastructure<br />
in only a few areas, lack <strong>of</strong> <strong>of</strong>ficial prevention<br />
and mitigation strategies, together with<br />
an inappropriate management <strong>of</strong> river basins<br />
contributed to the vulnerability <strong>of</strong> these areas.��<br />
It is at the local level that disasters materialize: lives and livelihoods are lost, houses and<br />
infrastructure damaged and destroyed, health and education compromised. This is also<br />
<strong>World</strong> <strong>Disasters</strong> <strong>Report</strong> <strong>2010</strong> – Focus on urban risk<br />
143
CHAPTER 7<br />
Photo opposite page:<br />
On 27 May 2006,<br />
an earthquake<br />
caused widespread<br />
destruction around the<br />
city <strong>of</strong> Yogyakarta on<br />
Java, Indonesia, killing<br />
some 6,000 people.<br />
The Indonesian <strong>Red</strong><br />
<strong>Cross</strong> Society, backed<br />
by the IFRC, launched<br />
a massive relief<br />
operation to help the<br />
injured and those who<br />
were displaced<br />
by the quake.<br />
© Spanish <strong>Red</strong> <strong>Cross</strong><br />
144<br />
where the lack <strong>of</strong> attention to disaster risk reduction by local governments becomes<br />
evident – even as politicians and civil servants hide behind the term ‘natural disaster’ or<br />
find fault with their predecessors. But it is also at the local level that risk management<br />
becomes possible. Vulnerability and hazards interact generating specific risk conditions,<br />
which are socially and geographically specific, dynamic and in constant flux. It is<br />
at the local level that civil society can interact with government and together plan for<br />
disaster risk reduction within a local development framework.<br />
The 1990s – the <strong>International</strong> Decade for Disaster Risk <strong>Red</strong>uction – brought a shift<br />
in the way disasters are understood with much more attention being paid to the links<br />
between development, disasters and environmental degradation. From this came a<br />
widespread consensus that risks are a social construction and that risk reduction should<br />
be implemented locally and with local actors. For Latin America, two key factors contributed<br />
to this: decentralization processes and state reforms in many countries; and<br />
the occurrence <strong>of</strong> several major disasters in the region which affected large population<br />
centres. Several countries enacted new legislation or are in the process <strong>of</strong> making<br />
amendments so as to meet the challenges <strong>of</strong> development and disaster risk reduction;<br />
in many cases this includes the transformation <strong>of</strong> emergency response agencies into<br />
national risk reduction systems.<br />
Governments – many at the local level – have assumed new roles and responsibilities,<br />
including modifying their approach to risk management, integrating different actors<br />
into the process and implementing risk management within development planning.<br />
But these remain the exception and a wide gap exists between rhetoric and practice.<br />
Many governments at different levels continue to focus only on emergency and reconstruction<br />
efforts and the latter <strong>of</strong>ten fail to incorporate long-term actions that would<br />
reduce risk and vulnerability to disasters. Disaster risk reduction is not a one-<strong>of</strong>f activity<br />
but a continuous process.<br />
What makes cities and municipal governments<br />
address disaster risk reduction?<br />
Some city governments have shown how to incorporate disaster risk reduction into<br />
development, i.e., to go beyond provisions for disaster preparedness. They have implemented<br />
the development initiatives and associated controls, regulatory frameworks<br />
and governance mechanisms that are essential to reducing risks. These have included<br />
upgrading programmes for informal settlements, urban land-use management with<br />
associated zoning and building codes, housing improvements and expanding coverage<br />
<strong>of</strong> city-wide infrastructure and services. Most examples <strong>of</strong> this come from nations or<br />
cities where popular pressure and political reforms have made local governments more<br />
accountable and responsive to their citizens. Obviously, this has to include local governments<br />
which develop relations with those who live in informal settlements and develop<br />
the capacity to govern with, and for, them. One <strong>of</strong> the most important innovations in
many such cities is participatory budgeting, where the inhabitants <strong>of</strong> each district in<br />
the city are able to influence priorities for public investments and details <strong>of</strong> the city’s<br />
budget are published and made much more transparent. In the 1980s the Brazilian city<br />
<strong>of</strong> Porto Alegre pioneered participatory budgeting and in 2004, the city introduced the<br />
Local Solidarity Programme which allows residents in the city’s 17 municipal divisions<br />
to participate in forums where projects for the next city budget are proposed and prioritized.<br />
More than 70 cities worldwide have adopted participatory budgeting.<br />
This shift by local governments to disaster risk reduction has been driven by different<br />
factors. In some nations, it is driven by stronger local democracies (for instance,<br />
a shift to elected mayors and city councils) and decentralization so city governments<br />
have a stronger financial base. Sometimes the trigger has been a particular disaster,<br />
such as Hurricane Mitch in Central America, or a sequence <strong>of</strong> disaster events, such as<br />
the Armero and Popayan earthquakes and other disasters in Colombia, which helps<br />
drive countries and their city and municipal governments to adopt new approaches for<br />
disaster risk reduction.<br />
After Hurricane Mitch, governments in Central America finally realized that the<br />
best way to respond to disaster risk was to reduce it. They made efforts at legal<br />
reform in order to transform traditional emergency response frameworks into risk<br />
<strong>World</strong> <strong>Disasters</strong> <strong>Report</strong> <strong>2010</strong> – Focus on urban risk<br />
145
CHAPTER 7<br />
146<br />
reduction systems that were multi-sectoral and inter-institutional. In each country,<br />
a national commission for risk management and disaster prevention was set up. For<br />
instance, in Nicaragua, the Sistema Nacional para la Prevención, Mitigación y Atención<br />
de Desastres (national system for disaster prevention, mitigation and response,<br />
now known as SINAPRED) was created in 2000 to work with local governments<br />
to strengthen the country’s institutional capacity for disaster preparedness and management,<br />
integrating disaster mitigation and risk reduction into local development<br />
processes. Local governments are responsible for activities related to prevention,<br />
mitigation, preparation, response, rehabilitation and reconstruction within their<br />
territories, based on risk assessments. Several municipalities have incorporated<br />
preventive planning especially in regard to approving building licences and land<br />
use, and different sectors including health, education and planning share disaster<br />
risk information. The system operates with a national disaster fund. Most <strong>of</strong> these<br />
national systems are, however, relatively new and need time to consolidate. Another<br />
concern is that local governments may be allocated responsibilities for which they<br />
lack the capacity and resources.<br />
Addressing the limits in disaster risk reduction<br />
by municipal and city governments<br />
While local government engagement is essential for disaster risk reduction, many<br />
disaster risks need coordinated action across a range <strong>of</strong> local governments. For instance,<br />
many large cities are composed <strong>of</strong> different municipalities (local governments) and disaster<br />
risks are <strong>of</strong>ten concentrated in particular municipalities. For example, São Paulo<br />
is made up <strong>of</strong> a central city with about 11 million inhabitants and 38 separate municipalities,<br />
while Buenos Aires consists <strong>of</strong> a central city <strong>of</strong> some 3 million inhabitants and<br />
26 municipalities. The municipalities with the highest disaster risks are <strong>of</strong>ten among<br />
the weakest financially and have the largest concentrations <strong>of</strong> low-income groups living<br />
in informal settlements. They therefore have the largest deficits in provision for the<br />
infrastructure and services that underpin risk reduction.<br />
Most flood problems in urban areas require a river basin management approach but for<br />
large cities, this can require investments and coordination among many different local<br />
government units – <strong>of</strong>ten including local governments controlled by opposing political<br />
parties. Or extreme weather events can simply overwhelm the capacity <strong>of</strong> a local<br />
government or require actions outside its boundaries and competence.<br />
In December 2009, several small and medium-sized cities in Argentina, including<br />
Salto, Pergamino, Arrecifes, Carmen de Areco and San Antonio de Areco, were flooded<br />
after torrential rains led to local rivers overflowing their banks. San Antonio de Areco,<br />
a town <strong>of</strong> more than 21,000 inhabitants, was hit particularly hard and 3,000 people<br />
had to be evacuated. The city government could not address the causes <strong>of</strong> the flooding.<br />
In part this was linked to rainfall in the whole region being greater than normal,
due to El Niño. Many other factors contributed to the floods, however, including a<br />
lack <strong>of</strong> control within the Areco river basin, for example, narrow sections <strong>of</strong> the river<br />
were not dredged, bridges and highways impeded water flow, changes in land use had<br />
increased the speed <strong>of</strong> run-<strong>of</strong>f, and increased run-<strong>of</strong>f caused by local drainage channels<br />
constructed by property owners in an uncoordinated manner.<br />
However, there are examples <strong>of</strong> coordinated actions among neighbouring local governments.<br />
In San Salvador, El Salvador, mayors <strong>of</strong> the metropolitan area formed a<br />
committee to work together, with the support <strong>of</strong> the city planning unit, on certain<br />
issues such as water provision, solid waste treatment, environmental protection and<br />
city infrastructure. After the earthquakes in 2001, the planning unit started work on<br />
micro-zoning <strong>of</strong> risk in the Ilopango Lake basin, which also called for the involvement<br />
<strong>of</strong> other municipalities within the basin that were outside the metropolitan area.<br />
Perhaps the main barrier to risk reduction is translating what is known into what is<br />
done. Many city and municipal governments, if asked, know that they should have a<br />
long-term development plan for their city that includes disaster risk reduction. Many<br />
also know that this is important for climate change adaptation. The issue, therefore,<br />
is why this is not done. Obviously for many urban centres, it is because they have no<br />
development plan or if they do, it is not adhered to. But, as Box 7.1 illustrated, even<br />
for city governments that are able to implement their development plans, getting local<br />
disaster risk reduction included in the plans needs trained government staff in key<br />
positions and political support. It also needs local governments with funding capacity.<br />
It comes as no surprise that most <strong>of</strong> the innovations described so far in this chapter<br />
come from cities in middle-income nations where local governments have been<br />
strengthened. Disaster risk reduction needs long-term plans and support, especially<br />
where the backlogs in key infrastructure and services are largest – which brings us back<br />
to the very large mismatch between what needs to be done and local capacities.<br />
Civil society groups including local non-governmental organizations (NGOs) and<br />
grass-roots organizations have key roles in emergency responses after disasters but they<br />
struggle to influence physical reconstruction. In addition, the channels and vehicles for<br />
participation – necessary to allow them to influence disaster risk reduction – are <strong>of</strong>ten<br />
absent. The effectiveness <strong>of</strong> disaster risk reduction is not just what a local government<br />
does but also what it encourages and supports.<br />
Support from higher levels <strong>of</strong> government<br />
and budgetary constraints<br />
Very few city governments in Africa, Asia and Latin America have the financial resources<br />
to invest in disaster risk reduction without support from provincial or national government.<br />
That support may not be forthcoming if, for example, the city government’s<br />
political orientation differs from that at provincial or national level.<br />
<strong>World</strong> <strong>Disasters</strong> <strong>Report</strong> <strong>2010</strong> – Focus on urban risk<br />
147
148<br />
As large cities have grown without the necessary infrastructure, so the gap between<br />
what is needed and what is affordable can widen to an almost impossible degree (see<br />
Chapter 2). More than 50 per cent <strong>of</strong> the population <strong>of</strong> many large cities in Africa and<br />
Asia live in settlements without basic infrastructure. The haphazard spatial expansion<br />
<strong>of</strong> a city and the concentration <strong>of</strong> many low-income settlements on flood plains, steep<br />
slopes or other sites at risk add to the costs. The capacity <strong>of</strong> municipal governments in<br />
most cities in low-income nations to invest in necessary infrastructure remains limited,<br />
however, even if they have been able to modernize tax collection systems or have better<br />
cost-recovery for services such as water supplies. And this is not helped by the reluctance<br />
<strong>of</strong> most bilateral aid agencies to support urban development.<br />
Infrastructure to prevent disaster risks is <strong>of</strong>ten costly to both build and maintain. The<br />
devastating floods that affected Santa Fe, Argentina, in 2003 and 2007 were in part<br />
due to incomplete or unmaintained infrastructure. The city has increasingly expanded<br />
on to the Río Salado flood plain. To protect itself from floods, it had to create embankments<br />
and dykes, but the infrastructure to protect certain city areas was supposed to be<br />
in place shortly after 1998 but was never completed due to lack <strong>of</strong> resources. In addition,<br />
the pumps and drainage systems installed to evacuate water in protected areas did<br />
not work because <strong>of</strong> vandalism and lack <strong>of</strong> maintenance.<br />
Box 7.3 Good governance and disaster risk reduction in Aceh<br />
According to the Centre for Research on the<br />
Epidemiology <strong>of</strong> <strong>Disasters</strong>, more than 19 million<br />
<strong>of</strong> Indonesia’s 210 million people have<br />
been affected by 309 disasters in the last two<br />
decades. Aceh, the westernmost province <strong>of</strong><br />
Indonesia, is inhabited by some 4 million people.<br />
On 26 December 2004, Aceh was struck<br />
by an earthquake measuring 9.0 on the Richter<br />
scale and the subsequent tsunami left 130,000<br />
people dead, 37,000 missing and an additional<br />
500,000 people displaced. Damage<br />
and losses were estimated at US$ 4.8 billion.<br />
Aceh was also suffering from a 30-year conflict<br />
that had claimed the lives <strong>of</strong> 15,000 people<br />
by the time a peace agreement was signed in<br />
August 2005.<br />
The international and national shift in<br />
paradigm from focusing on disaster response<br />
to enhancing disaster risk reduction underpins<br />
the reform process in Indonesia. Collaboration<br />
between the government, civil society organizations<br />
and international agencies led to a<br />
disaster management law, which was enacted<br />
in 2007. The law authorizes the creation<br />
<strong>of</strong> a National Disaster Management Agency<br />
(BNPB), which reports directly to the president<br />
<strong>of</strong> Indonesia and has a mandate to coordinate<br />
all contingency, preparedness, mitigation,<br />
prevention, disaster management training<br />
and disaster risk reduction activities (i.e., risk<br />
assessment and mapping). The law also addresses<br />
and regulates the development and<br />
application <strong>of</strong> disaster management and disaster<br />
risk reduction plans at national and local<br />
levels. Following passage <strong>of</strong> the law, the president<br />
issued Presidential Regulation 8/2008,<br />
which formally established the BNPB. Soon<br />
afterwards, the minister <strong>of</strong> home affairs issued<br />
Decree No. 46/2008 mandating the establishment<br />
<strong>of</strong> local disaster management agencies in
all provinces by the end <strong>of</strong> 2009. The law has<br />
been further clarified with additional governmental<br />
regulations regarding the participation<br />
<strong>of</strong> international and non-government actors in<br />
all phases <strong>of</strong> the disaster management cycle.<br />
The Aceh provincial government now includes<br />
disaster risk reduction as one <strong>of</strong> the<br />
province’s seven development priorities, and<br />
has introduced measures to mainstream disaster<br />
risk reduction into all development sectors,<br />
including policy framework, setting up a local<br />
disaster management agency, developing a<br />
local action plan and standard operating procedures,<br />
and increasing partnerships with civil<br />
society organizations. The provincial government<br />
has also pursued other initiatives, such as<br />
implementing the Aceh Green Program (mangrove<br />
plantation, reforestation), improving<br />
spatial planning and building codes, introducing<br />
disaster risk reduction into school curricula,<br />
and constructing or improving infrastructure<br />
with disaster mitigation functions (such as river<br />
and coastal embankments, drainage and access<br />
to evacuation buildings).<br />
Promoting disaster risk reduction<br />
initiatives in Banda Aceh<br />
The city <strong>of</strong> Banda Aceh is the capital <strong>of</strong> Aceh<br />
province and inhabited by some 219,619<br />
people. It was among the most severely affected<br />
municipalities during the 2004 earthquake<br />
and tsunami.<br />
In line with the disaster risk reduction<br />
framework at national and provincial levels,<br />
the Banda Aceh city government has also integrated<br />
disaster risk reduction into its development<br />
plan, which includes the city’s spatial<br />
planning. While a city disaster management<br />
agency has not yet been set up, the city government<br />
has already developed a contingency<br />
plan and standard operating procedures for<br />
disaster response, both <strong>of</strong> which have been<br />
tested through several simulations (including the<br />
Indian Ocean wave exercise drill in December<br />
2009). The drills involved all stakeholders including<br />
government, civil society organizations<br />
and community members.<br />
In addition, the Banda Aceh government has<br />
worked closely with civil society groups, including<br />
the <strong>Red</strong> <strong>Cross</strong> and <strong>Red</strong> Crescent, to promote<br />
community awareness on disaster risks. It has<br />
also instituted various measures to mitigate disaster<br />
risks, including the integrated communitybased<br />
disaster preparedness and school-based<br />
disaster preparedness programmes implemented<br />
by the Indonesian <strong>Red</strong> <strong>Cross</strong> Society (PMI),<br />
improved access to evacuation buildings and<br />
fire brigades trained and equipped to take action<br />
at any time. The city’s mayor and deputy<br />
mayor have demonstrated their support and<br />
commitment by attending several disaster risk<br />
reduction-related activities. Finally, the city government<br />
has established a strong partnership<br />
with PMI, which has trained and equipped disaster<br />
response teams (known as SATGANA),<br />
which are ready to respond to any emergencies.<br />
With financial and technical assistance from<br />
the American <strong>Red</strong> <strong>Cross</strong>’ tsunami recovery programme,<br />
the PMI is implementing its integrated<br />
community-based risk reduction programme in<br />
Banda Aceh. The programme, which seeks to<br />
enhance the capacity <strong>of</strong> vulnerable communities<br />
to reduce the risk and minimize the impact<br />
<strong>of</strong> disasters, has four objectives:<br />
1. Build disaster preparedness and response<br />
capacity <strong>of</strong> targeted communities<br />
2. Develop disaster management capacity<br />
<strong>of</strong> targeted schools by conducting disaster<br />
preparedness and response sessions for<br />
students<br />
3. Enhance PMI’s disaster management<br />
capacity at national, provincial and district/<br />
sub-district levels<br />
4. Strengthen the capacity <strong>of</strong> the local<br />
government’s disaster management and<br />
research in disaster risk reduction.<br />
<strong>World</strong> <strong>Disasters</strong> <strong>Report</strong> <strong>2010</strong> – Focus on urban risk<br />
149
The programme helps communities to identify<br />
potential risks and hazards in their villages<br />
by establishing community disaster management<br />
committees and disaster response teams,<br />
which are trained in disaster risk reduction issues<br />
and disaster response skills. It also supports<br />
communities with mitigation activities,<br />
Photo opposite page:<br />
Nairobi, Kenya: A girl<br />
empties the contents<br />
<strong>of</strong> her bucket into a<br />
small stream that runs<br />
through Kibera, one<br />
<strong>of</strong> Africa’s largest<br />
slums. With more than<br />
600,000 people living<br />
within one square<br />
mile, Kibera’s lack<br />
<strong>of</strong> basic sanitation<br />
facilities makes its<br />
population vulnerable<br />
to a wide range <strong>of</strong><br />
infectious diseases.<br />
© Victor Lacken/IFRC<br />
150<br />
contingency funds and disaster drills and<br />
works to improve their awareness <strong>of</strong> disaster<br />
risk reduction issues. In addition to schools and<br />
communities, the programme works closely<br />
with local government and civil society organizations<br />
to strengthen government disaster<br />
management capacity.��<br />
Disaster risk reduction and urban development<br />
Much disaster risk reduction is implemented as part <strong>of</strong> local governments’ conventional<br />
responsibility to provide or improve infrastructure and services, and support<br />
improvements in housing. Perhaps the most important <strong>of</strong> these are programmes to<br />
upgrade slums, which improve the quality <strong>of</strong> housing and the provision <strong>of</strong> housingrelated<br />
infrastructure and services (including water, sanitation and drainage) to settlements<br />
that are considered (or <strong>of</strong>ficially designated) as slums, including those that<br />
developed illegally. In cases where these programmes are done well and in consultation<br />
with the inhabitants, they can transform the quality <strong>of</strong> low-income neighbourhoods<br />
and reduce or remove disaster risks. Upgrading programmes have been carried out for<br />
40 years, and in countries such as Argentina, Colombia, Dominican Republic, Egypt,<br />
Indonesia, Morocco and Thailand, they have reached a significant proportion <strong>of</strong> the<br />
urban population, reducing slum incidence in the best cases by nearly 50 per cent.<br />
How well-governed a city is, is also shown in the way its government responds to<br />
disasters. In Tegucigalpa, four years after Hurricane Mitch, bridges linking poor areas<br />
to the city centre had still not been rebuilt. In Caracas, eight months after the floods<br />
and landslides <strong>of</strong> 1999, many poor city dwellers were still living in emergency shelters<br />
in very difficult conditions. At that time, the government was criticized for prioritizing<br />
actions that benefited certain economic interests (rebuilding roads and economic<br />
infrastructure) at the expense <strong>of</strong> addressing social issues. Again, the importance for risk<br />
reduction <strong>of</strong> good relations between local governments and their lower-income citizens<br />
is illustrated.<br />
City and municipal governments are <strong>of</strong>ten among the main providers <strong>of</strong> healthcare<br />
and emergency services. The quality <strong>of</strong> these services and the extent <strong>of</strong> their coverage<br />
will obviously influence their effectiveness in disaster response. In well-governed cities,<br />
such services are also active in promoting disaster risk reduction and, where needed,<br />
in making early warning systems work. However, for much <strong>of</strong> the urban population<br />
in low- and middle-income nations, especially those living in informal settlements,<br />
there is no public healthcare or emergency service, or if there is, it is <strong>of</strong> poor quality<br />
and difficult to access. Ironically, it may be that private healthcare is more important
in informal settlements than in the rest <strong>of</strong> the city although its quality and coverage are<br />
always limited by what local inhabitants can afford.<br />
<strong>Disasters</strong> also provide obvious challenges for services: not only do they have to respond<br />
to the emergency but they also have to restore healthcare for displaced people and<br />
those with chronic diseases who need regular treatment and medicines. After the January<br />
<strong>2010</strong> earthquake in Haiti, there was much concern about the disruption to treatment<br />
for people living with HIV/AIDS and tuberculosis. Another problem that occurs<br />
when settlements need to be evacuated is assisting people who need help to move.<br />
The provision <strong>of</strong> efficient emergency services is an essential role <strong>of</strong> city and municipal<br />
governments in furthering disaster risk reduction.<br />
Many city and municipal governments do risk management at the local level but not<br />
local risk management. They support projects that contribute to aspects <strong>of</strong> risk reduction<br />
(local organization for prevention and mitigation, reforestation, building codes,<br />
land-use norms, physical protection works and early warning systems) but these do<br />
not as yet contribute to, or become embedded in, local development. Similarly, most<br />
national systems and the international community support some elements <strong>of</strong> locally<br />
implemented risk reduction but do not address the social vulnerability which defines<br />
levels <strong>of</strong> disaster risk and which is <strong>of</strong>ten associated with prevailing chronic or everyday<br />
risk conditions. Local risk reduction will be a priority for local actors according to how<br />
<strong>World</strong> <strong>Disasters</strong> <strong>Report</strong> <strong>2010</strong> – Focus on urban risk<br />
151
CHAPTER 7<br />
152<br />
much they contribute to reducing everyday risks and to their understanding <strong>of</strong> how<br />
vulnerability factors are embedded in the local development process.<br />
In Latin America, over the last 20 years, a network <strong>of</strong> academics and practitioners<br />
from different countries and institutions has promoted new approaches to disaster risk<br />
management which stressed disaster risk reduction, local action and local government<br />
responsibility, and worked with vulnerable groups to understand and address disaster<br />
risk. Much <strong>of</strong> this work has been promoted directly or indirectly by La <strong>Red</strong> de Estudios<br />
Sociales en Prevención de Desastres en America Latina (Network <strong>of</strong> social studies in disaster<br />
prevention in Latin America).<br />
Many nations in Latin America now have well-established institutional structures<br />
to support disaster risk reduction. In addition to the Colombian and Nicaraguan<br />
systems mentioned above, other nations have focused on broadening national emergency<br />
systems. For example, Peru’s national system and its civil protection committee,<br />
both <strong>of</strong> which are emergency response structures, focus on capacity building,<br />
training and awareness-raising. In El Salvador, many associations <strong>of</strong> municipalities or<br />
micro-regions exist, for example, the association for land-use planning in the Jiboa<br />
Valley.<br />
Associations and networks <strong>of</strong> local governments have also been created to unite efforts<br />
in addressing risk reduction. After Hurricane Mitch in Honduras, the municipalities<br />
<strong>of</strong> La Masica, Arizona, Esparta, San Francisco and El Porvenir established an association,<br />
MAMUCA (Community <strong>of</strong> central Atlántida municipalities), to unite efforts<br />
and create a platform for dialogue and cooperation in preparing for extreme events and<br />
coordinating local response. This helped shift national disaster management systems to<br />
community level. It involved participatory diagnosis and planning, awareness- raising,<br />
prioritizing strategic reconstruction activities and participating in local decision-<br />
making through public meetings. MAMUCA also became involved in the national<br />
and regional disaster risk management systems, which helped improve evacuations<br />
during storms, through community-based disaster reduction practices, and encouraged<br />
the formation <strong>of</strong> local emergency committees integrated with municipal, regional and<br />
national emergency committees. The municipal emergency committees are chaired by<br />
the mayors and include representatives <strong>of</strong> the local council and local institutions, such<br />
as the police, the fire department and the <strong>Red</strong> <strong>Cross</strong>.<br />
It is still difficult to get national programmes and networks to support local action<br />
and encourage coordination between local governments. Risk reduction needs to be<br />
promoted and supported in most sectors <strong>of</strong> local government and coordinated between<br />
them – no easy task institutionally. Reviews on the actions, programmes and structures<br />
set up after Hurricane Mitch show mixed results in terms <strong>of</strong> how they managed to<br />
embed disaster risk within local development and thus address the structural causes <strong>of</strong><br />
vulnerability.
Conclusion<br />
As we pointed out at the beginning <strong>of</strong> this chapter, disaster risk can be greatly reduced<br />
or removed by ‘good’ local governance and support for better-quality housing and<br />
infrastructure, and service provision. This is especially true for cities that are exposed to<br />
extreme weather or earthquakes. Special provision also needs to be made for identifying<br />
and acting on disaster risk reduction. For local governments, it should be easier to<br />
get involved in local risk management when the process is embedded within the local<br />
development process and when it is clear that actions that can reduce disaster risk also<br />
work to reduce everyday risks and contribute to local development. Of course, this also<br />
depends on higher levels <strong>of</strong> government allowing local governments the financial and<br />
institutional capacity to act.<br />
For the international agencies that fund risk reduction or development, there is a need<br />
to support local-level institutional changes which engage local governments with civil<br />
society organizations. Local governments are <strong>of</strong>ten bypassed as external funding goes<br />
to national governments or through international NGOs. Institutional change <strong>of</strong>ten<br />
requires long-term support. It may also require more staff, presenting problems for<br />
international agencies that face strong pressures to keep down their staff costs. But most<br />
international agencies feel more comfortable funding projects not processes. Despite a<br />
commitment to ‘good governance’, local ownership and coordinated approaches, most<br />
agencies still monitor and evaluate their work with traditional frameworks, measuring<br />
advances and results for quantifiable and visible products and short-term objectives.<br />
There are also still too many disaster risk reduction programmes designed by outside<br />
experts with no real ownership or assimilation by local stakeholders from local government,<br />
community organizations and the private sector. This has to change.<br />
This chapter and Box 7.2 was written by Jorgelina Hardoy <strong>of</strong> the <strong>International</strong> Institute<br />
<strong>of</strong> Environment and Development (IIED) – Latin America (Instituto Internacional de<br />
Medio Ambiente y Desarrollo – America Latina) with contributions from Debra Roberts,<br />
Deputy Head, Environmental Planning and Climate Protection Department, Ethekwini<br />
Municipality, Durban, South Africa, Mark Pelling, Reader in Human Geography, King’s<br />
College London, and David Satterthwaite, Senior Fellow <strong>of</strong> IIED’s Human Settlements<br />
Programme. Debra Roberts wrote Box 7.1. Box 7.3 was contributed by Dino Argianto,<br />
Disaster Management Coordinator, and Syarifah Marlina, Deputy Head <strong>of</strong> Programs,<br />
Tsunami Recovery Program, Indonesia, American <strong>Red</strong> <strong>Cross</strong>.<br />
<strong>World</strong> <strong>Disasters</strong> <strong>Report</strong> <strong>2010</strong> – Focus on urban risk<br />
153
CHAPTER 7<br />
154<br />
Sources and further information<br />
Almansi, F. ‘Rosario’s Development’ in Environment and Urbanization, Vol. 21, No. 1,<br />
pp. 19–35, 2009.<br />
Asociación Civil Canoa. www.canoa.org.ar/PrPe-Recons.html.<br />
Bollin, C. and Mascher, F. Honduras: Community-based disaster risk management and<br />
intermunicipal cooperation. A review <strong>of</strong> experience gathered by the special intermunicipal<br />
association MAMUCA. Eschborn, Germany: GTZ, 2005.<br />
Boonyabancha, S. ‘Land for housing the poor by the poor: experiences from the Baan<br />
Mankong nationwide slum upgrading programme in Thailand’ in Environment<br />
and Urbanization, Vol. 21, No. 2, pp. 309–330, 2009.<br />
Boonyabancha, S. ‘Baan Mankong: going to scale with ‘slum’ and squatter upgrading<br />
in Thailand’ in Environment and Urbanization, Vol. 17, No. 1, pp. 21–46, 2005.<br />
Cabannes, Y. ‘Participatory budgeting: a significant contribution to participatory<br />
democracy’ in Environment and Urbanization, Vol. 16, No. 1, 2004.<br />
Caputo, G. et al. Desastres y Sociedad en America Latina. Buenos Aires: IIED–AL/GEL.<br />
Cardona, A. et al. ‘Organización Institucional para la Gestión de Riesgos’, in Clarke,<br />
C. and Pineda Mannheim, C. (eds.), Riesgo y Desastres. Su Gestion Municipal en<br />
Centro America. Publicaciones especiales sobre el Desarrollo No 3. BID, 2007.<br />
Christoplos, I., Mitchell, J. and Liljelund, A. ‘Re-framing risk: the changing context <strong>of</strong><br />
disaster mitigation and preparedness’ in <strong>Disasters</strong>, Vol. 25, No. 3, pp. 185–198, 2001.<br />
Cilento Sarli, A. La vulnerabilidad urbana de Caracas. 2007. Available online:<br />
http://168.96.200.17/ar/libros/venezuela/rvecs/3.2002/sarli.doc.<br />
Colina, F. et al. Pilot Study <strong>of</strong> Community Based Disaster Management Strategy for<br />
Earthquakes. Case <strong>of</strong> La Vega, FUNDAPRIS – JICA. ProVention CRA Toolkit Case<br />
Study, 2004.<br />
Centre for Research on the Epidemiology <strong>of</strong> <strong>Disasters</strong> (CRED). Annual Disaster<br />
Statistical Review 2007. Brussels: CRED, 2008.<br />
Díaz Palacios, J. and Miranda, L. ‘Concertación (reaching agreement) and planning<br />
for sustainable development in Ilo, Peru’, in Bass, S. et al. (eds.), <strong>Red</strong>ucing Poverty<br />
and Sustaining the Environment. London: Earthscan Publications, 2005.<br />
Dodman, D., Hardoy, J. and Satterthwaite, D. ‘Urban development and intensive<br />
and extensive risk’ in United Nations <strong>International</strong> Strategy for Disaster <strong>Red</strong>uction<br />
(UNISDR), Global Assessment <strong>Report</strong> on Disaster Risk <strong>Red</strong>uction: Risk and Poverty in<br />
a Changing Climate. Geneva: UNISDR, 2009.<br />
Elguezabal, S. Refugiados ambientales: los exiliados del Mundo, Telenoche Investiga. 2007.
Fay, M., Ghesquiere, F. and Solo, T. ‘Natural Disaster and the Urban Poor’ in En Breve,<br />
October, No. 23, pp. 1–4, 2003.<br />
Gavidia, J. ‘Priority Goals in Central America. The development <strong>of</strong> sustainable mechanisms<br />
for participation in local risk management’ in Milenio Ambiental, Journal <strong>of</strong><br />
the Urban Environment Programme <strong>of</strong> the <strong>International</strong> Development Research<br />
Centre, Montevideo, No. 4, pp. 56–59, 2006.<br />
González, V. ‘Confronting the Seismic Threat in the City <strong>of</strong> Managua. Institutional<br />
Cooperation for Integrated Risk Management’ in Milenio Ambiental, Journal <strong>of</strong><br />
the Urban Environment Programme <strong>of</strong> the <strong>International</strong> Development Research<br />
Centre, Montevideo, No. 4, pp. 36–39, 2006.<br />
Hardoy, J. and Pandiella, G. ‘Urban Poverty and Vulnerability to climate change in<br />
Latin America’ in Environment and Urbanization, Vol. 21, No. 1, pp. 203–224,<br />
2009.<br />
Hardoy, J., Mitlin, D. and Satterthwaite, D. Environmental Problems in an Urbanizing<br />
<strong>World</strong>: Finding Solutions for Cities in Africa, Asia and Latin America. London:<br />
Earthscan Publications, 2001.<br />
Hasan, A. Participatory Development: The Story <strong>of</strong> the Orangi Pilot Project-Research<br />
and Training Institute and the Urban Resource Centre, Karachi. Oxford: Oxford<br />
University Press, <strong>2010</strong>.<br />
Jiménez, V. <strong>Report</strong>: Taller Vivencial de Intercambio de Experiencias Municipales en<br />
<strong>Red</strong>ucción de Riesgos, Caracas, Venezuela, 9 – 12 de Noviembre, 2006. Within the<br />
framework <strong>of</strong> Proyecto RLA/51467 “Fortalecimiento Regional y <strong>Red</strong>ucción de<br />
Riesgos en Ciudades Mayores de la Comunidad Andina”, 2006.<br />
Kelly, P.F. ‘The politics <strong>of</strong> urban-rural relationships: land conversion in the Philippines’<br />
in Environment and Urbanization, Vol. 10, No. 1, pp. 35–54, 1998.<br />
Lavell A. La Gestión Local del Riesgo. Conceptos y prácticas. Programa Regional para la<br />
Gestión del Riesgo en América Central. CEPREDENAC–PNUD, 2005.<br />
Lavell, A. ‘The Lower Lempa River Valley, El Salvador: Risk <strong>Red</strong>uction and<br />
Development Project’, in Bank<strong>of</strong>f, G. et al. (eds.), Mapping Vulnerability: <strong>Disasters</strong>,<br />
development and people. London: Earthscan Publications, 2004.<br />
Lavell, A. La <strong>Red</strong> de Estudios Sociales en Prevención de Desastres en América Latina,<br />
La <strong>Red</strong>: Antecedentes, Formación y Contribución al Desarrollo de los Conceptos,<br />
Estudios y la Práctica en el tema de los Riesgos y Desastres en América Latina. Mimeo.<br />
2004.<br />
Lavell, A. Desastres Urbanos: Una Vision Global, Seminar on El Impacto de los Desastres<br />
Naturales en Areas Urbanas y en la Salud Publica Urbana en Centro America y el<br />
Caribe. ASIES, Guatemala, 2000.<br />
<strong>World</strong> <strong>Disasters</strong> <strong>Report</strong> <strong>2010</strong> – Focus on urban risk<br />
155
CHAPTER 7<br />
156<br />
Lopez Follegatti, J. ‘Ilo: a city in transformation’ in Environment and Urbanization,<br />
Vol. 11, No. 2, pp. 191–202, 1999.<br />
Lungo, M. ‘Gestión de Riesgos nacional y local’, in Clarke, C. and Pineda Mannheim,<br />
C. (eds.), Riesgo y Desastres. Su Gestión Municipal en Centro América. Publicaciones<br />
especiales sobre el Desarrollo No. 3. BID, pp.19–27, 2007.<br />
Mansilla, E. Centro América a 10 años de Mitch. Reflexiones en torno a la <strong>Red</strong>ucción de<br />
Riesgo. CEPREDENAC and <strong>World</strong> Bank, 2008.<br />
Marulanda, L.M. El Biomanizales: Política Ambiental local. Documentación de la<br />
Experiencia de Gestión Ambiental Urbana de Manizales, Colombia. Instituto de<br />
Estudios de Vivienda y Desarrollo Urbano dentro del marco de implementación<br />
del proyecto: Apoyo para la implementación de Planes Nacionales de Acción del<br />
Habitat II (SINPA). Mimeo, 2000.<br />
Mata, J.L. and Nobre, C. Background paper: Impacts, vulnerability and adaptation<br />
to climate change in Latin America. Presented at Regional Workshop on Latin<br />
American Adaptation, UNFCCC, Lima, Peru, 18–20 April 2006.<br />
Mehrotra, S. et al. Framework for Urban Climate Risk Assessment. <strong>Report</strong> prepared for<br />
the <strong>World</strong> Bank Fifth Urban Research Symposium: Cities and Climate Change:<br />
Responding to an Urgent Agenda, Marseilles, 2009.<br />
Mejia, F.Y. Construyendo una Ciudad mas Saludable y Sostenible Ambientalmente.<br />
Estrategia Municipal para la Superacion de Condiciones de Vulnerabilidad del Distrito<br />
Central, Capital de Honduras. ASIES, Guatemala, 2000.<br />
Menegat, R. ‘Participatory democracy and sustainable development: integrated<br />
urban environmental management in Porto Alegre, Brazil’ in Environment and<br />
Urbanization, Vol. 14, No. 2, pp. 181–206, 2002.<br />
Natenzon, C. Inundaciones catastróficas, vulnerabilidad social y adaptación en un caso<br />
argentino actual. Cambio climático, elevación del nivel medio del mar y sus implicancias.<br />
Paper submitted to Climate Change Impact and Integrated Assessment, EMF<br />
Workshop IX, Snowmass, Colorado, 28 July–7 August 2006.<br />
Rabinovitch, J. ‘Curitiba: towards sustainable urban development’ in Environment and<br />
Urbanization, Vol. 4, No. 2, pp. 62–77, 1992.<br />
Rayos, J. Community-driven Disaster Intervention: Experiences <strong>of</strong> the Homeless People’s<br />
<strong>Federation</strong> in the Philippines. Manila and London: HPFP, PACSII and IIED, 2009.<br />
Roberts, D. ‘Thinking Globally, Acting Locally: Institutionalizing Climate Change<br />
at the Local Government level in Durban, South Africa’, in Bicknell J., Dodman,<br />
D. and Satterthwaite, D. (eds.), Adapting Cities to Climate Change. Understanding<br />
and Addressing the Development Challenges. London: Earthscan Publications, 2009.
Satterthwaite, D. et al. ‘Adapting to climate change in urban areas; the possibilities<br />
and constraints in low- and middle-income nations’, in Bicknell J., Dodman, D.<br />
and Satterthwaite, D. (eds.), Adapting Cities to Climate Change. Understanding and<br />
Addressing the Development Challenges. London: Earthscan Publications, 2009.<br />
United Nations Human Settlements Programme (UN-Habitat). State <strong>of</strong> the <strong>World</strong>’s<br />
Cities <strong>2010</strong>/2011 – Bridging The Urban Divide. Geneva: UN-Habitat, <strong>2010</strong>.<br />
Velásquez, L.S. ‘The Bioplan: Decreasing poverty in Manizales, Colombia, through<br />
shared environmental management’, in Bass, S. et al. (eds.), <strong>Red</strong>ucing Poverty and<br />
Sustaining the Environment. London: Earthscan Publications, 2005.<br />
Velásquez, L.S. ‘Agenda 21; a form <strong>of</strong> joint environmental management in Manizales,<br />
Colombia’ in Environment and Urbanization, Vol. 10, No. 2, pp. 9–36, 1998.<br />
von Hesse, M., Kamiche, J. and de la Torre C., Contribución temática de América<br />
Latina al Informe Bienal y Evaluación Mundial Sobre la <strong>Red</strong>ucción de Riesgo ISDR.<br />
GTZ-PNUD, 2008.<br />
Wang, H.G., Montoliu-Munoz, M. and Fatou D. Gueye, N. Preparing to Manage<br />
Natural Hazards and Climate Change Risks in Dakar, Senegal; A Spatial and<br />
Institutional Approach. Pilot Study <strong>Report</strong>, 2009.<br />
<strong>World</strong> Bank. ‘Supporting Natural Disaster <strong>Red</strong>uction at the National and Municipal<br />
Level in Nicaragua’, in UNISDR, Global Assessment <strong>Report</strong> on Disaster Risk<br />
<strong>Red</strong>uction: Risk and Poverty in a Changing Climate. Geneva: UNISDR, 2009.<br />
Zeballos Moreno, O. ‘Ocupación de laderas: incremento del riesgo por degradación<br />
ambiental urbana en Quito, Ecuador’, in Fernández, M.A. (ed.), Ciudades en Riesgo,<br />
Degradación Ambiental, Riesgos Urbanos y Desastres. Lima: La <strong>Red</strong>, 1996.<br />
<strong>World</strong> <strong>Disasters</strong> <strong>Report</strong> <strong>2010</strong> – Focus on urban risk<br />
157
ANNEXES<br />
158<br />
Disclaimer<br />
The data and opinions expressed in these annexes do not<br />
necessarily represent the <strong>of</strong>fi cial policy <strong>of</strong> the <strong>International</strong><br />
<strong>Federation</strong> <strong>of</strong> <strong>Red</strong> <strong>Cross</strong> and <strong>Red</strong> Crescent Societies<br />
or <strong>of</strong> individual National <strong>Red</strong> <strong>Cross</strong> or <strong>Red</strong> Crescent Societies.<br />
For further information regarding the fi gures, data and analysis<br />
provided in Annexes 1 and 2, please contact the Centre<br />
for Research on the Epidemiology <strong>of</strong> <strong>Disasters</strong> (CRED) and<br />
the UN <strong>International</strong> Strategy for Disaster <strong>Red</strong>uction (UNISDR).
<strong>World</strong> <strong>Disasters</strong> <strong>Report</strong> <strong>2010</strong> – Disaster data<br />
Forewarned is<br />
forearmed. Volunteers<br />
from National<br />
Societies help<br />
communities become<br />
more resilient to<br />
disaster risks through<br />
activities such as<br />
hazard mapping and<br />
disaster preparedness.<br />
© Knud Falk/Danish <strong>Red</strong><br />
<strong>Cross</strong><br />
159
ANNEX 1<br />
160<br />
Disaster data<br />
According to the Centre for Research on the Epidemiology <strong>of</strong> <strong>Disasters</strong> (CRED), 351<br />
natural disasters and 225 technological disasters were reported worldwide in 2009.<br />
These two figures are both the lowest <strong>of</strong> the decade, in relation to casualties (natural<br />
disasters: 10,551; technological disasters: 6,707) and to the number <strong>of</strong> persons affected<br />
(natural disasters: 142 million; technological disasters: 33,000).<br />
The deadliest disaster in 2009 was an earthquake in southern Sumatra (Indonesia),<br />
which resulted in 1,117 deaths, a figure far below the major catastrophes <strong>of</strong> the decade,<br />
such as the Indian Ocean tsunami in 2004 (226,408 deaths), Cyclone Nargis<br />
in Myanmar in 2008 (138,366 deaths) or the 2008 Sichuan earthquake in China<br />
(87,476 deaths). Nevertheless, the Sumatra earthquake appears in 36th place in a ranking<br />
<strong>of</strong> disasters based on the number <strong>of</strong> persons killed. The technological disaster that<br />
resulted in the highest number <strong>of</strong> deaths was the shipwreck <strong>of</strong> the ferry Teratai Prima<br />
in Indonesia, with 247 people considered dead or missing.<br />
The disaster that resulted in the largest number <strong>of</strong> affected persons (almost 40 million<br />
people affected) in 2009 was a flood in July in China. Droughts in north-eastern and<br />
eastern Africa (Ethiopia, Sudan, Kenya, Somalia, Uganda, Djibouti, Burundi) affected<br />
almost 20 million people. Typhoon Morakot affected more than 13 million people in<br />
China, Taiwan and the Philippines in August, and a local storm affected 10 million<br />
people in China in November. In May, Cyclone Aila affected 9 million people in India<br />
and Bangladesh, and in September, Tropical Storm Ondoy (or Ketsana) affected nearly<br />
8 million people in the Philippines, Viet Nam, Lao People’s Democratic Republic and<br />
Cambodia. Twelve other major natural disasters affected between 1 and 6 million people<br />
each; nine <strong>of</strong> these events occurred in Asia, two in the Americas and one in Africa.<br />
All <strong>of</strong> these major disasters accounted for 90 per cent <strong>of</strong> the total number <strong>of</strong> people<br />
affected by natural disasters. By comparison, technological disasters affect few people.<br />
An explosion in an ammunitions camp in Tanzania in April was the technological disaster<br />
that affected the most people (19,366) in 2009.<br />
Natural disaster costs (US$ 41.5 billion) were the third lowest <strong>of</strong> the decade – after the<br />
lowest values <strong>of</strong> 2001 (US$ 35.5 billion) and 2006 (US$ 36.3 billion) – and represent<br />
less than one-fifth <strong>of</strong> the record <strong>of</strong> 2005, when Hurricane Katrina caused damages<br />
amounting to almost US$ 137 billion.<br />
In 2009, the costliest disaster was winter storm Klaus, which caused damages totalling<br />
US$ 5.1 billion in France and Spain. Damages from the Aquila earthquake in Italy cost<br />
US$ 2.5 billion. Three tornadoes in the United States cost a total <strong>of</strong> US$ 6.2 billion;<br />
the earthquake in southern Sumatra caused damages amounting to US$ 2.2 billion<br />
and a flood in India in September also cost US$ 2.2 billion. Eleven other disasters
(eight windstorms, one flood, one wild fire and one extreme temperature) cost more<br />
than US$ 1 billion. These disasters accounted for 73 per cent <strong>of</strong> the total reported<br />
damages. By comparison, the most costly technological disaster was an explosion in<br />
an oil storage facility, which led to damages for a total amount <strong>of</strong> US$ 6.4 million in<br />
Puerto Rico.<br />
EM-DAT: A specialized disaster database<br />
Tables 1–13 on natural and technological disasters and their human impact over the<br />
last decade were drawn from CRED’s EM-DAT. Established in 1973 as a non-pr<strong>of</strong>it<br />
institution, CRED is based at the School <strong>of</strong> Public Health <strong>of</strong> the Catholic University<br />
<strong>of</strong> Louvain in Belgium and became a <strong>World</strong> Health Organization collaborating centre<br />
in 1980. Although CRED’s main focus is on public health, the centre also studies the<br />
socio-economic and long-term effects <strong>of</strong> large-scale disasters.<br />
Since 1988, with the sponsorship <strong>of</strong> the United States Agency for <strong>International</strong> Development’s<br />
Office <strong>of</strong> Foreign Disaster Assistance (OFDA), CRED has maintained EM-<br />
DAT, a worldwide database on disasters. It contains essential core data on the occurrence<br />
and effects <strong>of</strong> more than 17,000 disasters in the world from 1900 to the present.<br />
The database is compiled from various sources, including United Nations (UN) agencies,<br />
non-governmental organizations, insurance companies, research institutes and<br />
press agencies.<br />
Priority is given to data from UN agencies, followed by OFDA, governments and the<br />
<strong>International</strong> <strong>Federation</strong> <strong>of</strong> <strong>Red</strong> <strong>Cross</strong> and <strong>Red</strong> Crescent Societies. This prioritization<br />
is not a reflection <strong>of</strong> the quality or value <strong>of</strong> the data but the recognition that most<br />
reporting sources do not cover all disasters or may have political limitations that could<br />
affect the figures. The entries are constantly reviewed for redundancies, inconsistencies<br />
and the completion <strong>of</strong> missing data. CRED consolidates and updates data on a daily<br />
basis. A further check is made at monthly intervals. Revisions are made annually at<br />
the end <strong>of</strong> the calendar year. The database’s main objectives are to assist humanitarian<br />
action at both national and international levels; to rationalize decision-making for disaster<br />
preparedness; and to provide an objective basis for vulnerability assessment and<br />
priority setting.<br />
Data definitions and methodology<br />
CRED defines a disaster as “a situation or event, which overwhelms local capacity,<br />
necessitating a request to national or international level for external assistance (definition<br />
considered in EM-DAT); an unforeseen and <strong>of</strong>ten sudden event that causes great<br />
damage, destruction and human suffering”. For a disaster to be entered into the data-<br />
base, at least one <strong>of</strong> the following criteria must be fulfilled:<br />
�� Ten or more people reported killed<br />
�� 100 people or more reported affected<br />
<strong>World</strong> <strong>Disasters</strong> <strong>Report</strong> <strong>2010</strong> – Disaster data<br />
ANNEX 1<br />
161
ANNEX 1<br />
162<br />
�� Declaration <strong>of</strong> a state <strong>of</strong> emergency<br />
�� Call for international assistance.<br />
The number <strong>of</strong> people killed includes people confirmed as dead and people missing<br />
and presumed dead. People affected are those requiring immediate assistance during<br />
a period <strong>of</strong> emergency (i.e., requiring basic survival needs such as food, water, shelter,<br />
sanitation and immediate medical assistance). People reported injured or homeless are<br />
aggregated with those reported affected to produce a ‘total number <strong>of</strong> people affected’.<br />
The economic impact <strong>of</strong> a disaster usually consists <strong>of</strong> direct consequences on the local<br />
economy (e.g., damage to infrastructure, crops, housing) and indirect consequences<br />
(e.g., loss <strong>of</strong> revenues, unemployment, market destabilization). In EM-DAT, the registered<br />
figure corresponds to the damage value at the moment <strong>of</strong> the event and usually<br />
only to the direct damage, expressed in US dollars (2009 prices).<br />
In 2007, a new natural disaster category classification was introduced in EM-DAT.<br />
This new classification was initiated by CRED and Munich Re and brought together<br />
CRED, Munich Re, Swiss Re, the Asian Disaster <strong>Red</strong>uction Center (ADRC) and the<br />
UN Development Programme (UNDP). The goals were to create and agree on a common<br />
hierarchy and terminology for all global and regional databases on natural disasters<br />
and to establish a common and agreed definition <strong>of</strong> sub-events that is simple and<br />
self-explanatory.<br />
This classification is a first step in the development <strong>of</strong> a standardized international classification<br />
<strong>of</strong> disasters. It distinguishes two generic categories for disasters (natural and<br />
technological), the natural disasters category being divided into five sub-groups, which<br />
in turn cover 12 disaster types and more than 32 sub-types. The five sub-groups and<br />
12 types are as follows:<br />
�� Biological disasters: Insect infestations, epidemics and animal attacks (the last<br />
two categories are not included in the <strong>World</strong> <strong>Disasters</strong> <strong>Report</strong>)<br />
�� Geophysical disasters: Earthquakes and tsunamis, volcanic eruptions, dry mass<br />
movements (avalanches, landslides, rockfalls and subsidence <strong>of</strong> geophysical<br />
origin)<br />
�� Climatological disasters: Droughts (with associated food insecurities), extreme<br />
temperatures and wildfires<br />
�� Hydrological disasters: Floods (including waves and surges), wet mass move-<br />
ments (avalanches, landslides, rockfalls and subsidence <strong>of</strong> hydrological origin)<br />
�� Meteorological disasters: Storms (divided into nine sub-categories).<br />
The technological disasters remain unchanged and comprise three groups:<br />
�� Industrial accidents: Chemical spills; collapse <strong>of</strong> industrial infrastructure; explosions;<br />
fires; gas leaks; poisoning; radiation<br />
�� Transport accidents: Transportation by air, rail, road or water
�� Miscellaneous accidents: Collapse <strong>of</strong> domestic / non-industrial structures; explosions;<br />
fires.<br />
In Tables 1–13, ‘disasters’ refer to disasters with a natural or a technological trigger<br />
only, and do not include wars, conflict-related famines, diseases or epidemics. The<br />
classification <strong>of</strong> countries as ‘very high’, ‘high’, ‘medium’ or ‘low human development’<br />
is based on UNDP’s 2009 Human Development Index (HDI). For a small number <strong>of</strong><br />
countries, which do not appear in the HDI, the <strong>World</strong> Bank’s classification <strong>of</strong> economies<br />
by the countries’ level <strong>of</strong> income is used as reference (‘high’, ‘upper middle’ ‘lower<br />
middle’ and ‘low’).<br />
In both EM-DAT and the tables in this annex, data are considered at country level for<br />
many reasons, including the fact that it is at this level that they are reported most <strong>of</strong> the<br />
time and also due to issues regarding possible aggregation and disaggregation <strong>of</strong> data.<br />
For droughts or food insecurities, which are <strong>of</strong>ten multi-year events, their impact over<br />
time is taken into account.<br />
Bearing in mind that data on deaths and economic damage from drought are infrequently<br />
reported, CRED has adopted the following rules regarding data for droughts:<br />
�� The total number <strong>of</strong> deaths reported for a drought is divided by the number <strong>of</strong><br />
years for which the drought persists. The resulting number is registered for each<br />
year <strong>of</strong> the drought’s duration.<br />
�� The same calculation is done for the reported economic damages.<br />
�� For the total number <strong>of</strong> people reported to be affected, CRED considers that the<br />
same number is affected each year that the disaster persists.<br />
Some disasters begin at the end <strong>of</strong> a year and may last some weeks or months into the<br />
following year. In such case, CRED has adopted the following rules:<br />
�� With regard to the number <strong>of</strong> people reported affected, the total number is<br />
recorded for both the start year and the end year.<br />
�� For the number <strong>of</strong> people reported killed, CRED distinguishes between suddenonset<br />
disasters (earthquakes, flash floods, landslides, etc.) and slow-onset disasters<br />
(wildfires, some floods, extreme temperatures, etc.) as follows:<br />
– Sudden-onset disasters – all those killed are registered according to the start year<br />
<strong>of</strong> the disaster<br />
– Slow-onset disasters – the total <strong>of</strong> all those killed is divided by two and a half is<br />
attributed to each year <strong>of</strong> persistence.<br />
�� <strong>Report</strong>ed economic damages are always attributed to the end year <strong>of</strong> the disaster.<br />
This is because damage is related to both the strength <strong>of</strong> a disaster and its duration.<br />
By using these rules, some data bias correction is attempted. However, they are far<br />
from perfect and CRED will try to improve them, as well as the database as a whole,<br />
in the future.<br />
<strong>World</strong> <strong>Disasters</strong> <strong>Report</strong> <strong>2010</strong> – Disaster data<br />
ANNEX 1<br />
163
ANNEX 1<br />
164<br />
Caveats<br />
Key problems with disaster data include the lack <strong>of</strong> standardized collection methodologies<br />
and definitions. The original information, collected from a variety <strong>of</strong> public<br />
sources, is not specifically gathered for statistical purposes. So, even when the compilation<br />
applies strict definitions for disaster events and parameters, the original suppliers<br />
<strong>of</strong> information may not. Moreover, data are not always complete for each disaster. The<br />
quality <strong>of</strong> completion may vary according to the type <strong>of</strong> disaster (for example, the<br />
number <strong>of</strong> people affected by transport accidents is rarely reported) or its country <strong>of</strong><br />
occurrence.<br />
Data on deaths are usually available because they are an immediate proxy for the severity<br />
<strong>of</strong> the disaster. However, the numbers put forward immediately after a disaster may<br />
sometimes be seriously revised, occasionally several months later.<br />
Data on the number <strong>of</strong> people affected by a disaster can provide some <strong>of</strong> the most<br />
potentially useful figures, for planning both disaster preparedness and response, but<br />
they are sometimes poorly reported. Moreover, the definition <strong>of</strong> people affected<br />
remains open to interpretation, political or otherwise. Even in the absence <strong>of</strong> manipulation,<br />
data may be extrapolated from old census information, with assumptions being<br />
made about percentages <strong>of</strong> an area’s population affected.<br />
Data can also be skewed because <strong>of</strong> the rationale behind data gathering. Reinsurance<br />
companies, for instance, systematically gather data on disaster occurrence in order to<br />
assess insurance risk, but with a priority in areas <strong>of</strong> the world where disaster insurance<br />
is widespread. Their data may therefore miss out poor, disaster-affected regions where<br />
insurance is unaffordable or unavailable.<br />
For natural disasters over the last decade, data on deaths are missing for around onetenth<br />
<strong>of</strong> reported disasters; data on people affected are missing for around one-fifth<br />
<strong>of</strong> disasters; and data on economic damages are missing for 67 per cent <strong>of</strong> disasters.<br />
The figures should therefore be regarded as indicative. Relative changes and trends are<br />
more useful to look at than absolute, isolated figures.<br />
Dates can be a source <strong>of</strong> ambiguity. For example, a declared date for a famine is both<br />
necessary and meaningless – a famine does not occur on a single day. In such cases,<br />
the date the appropriate body declares an <strong>of</strong>ficial emergency has been used. Changes<br />
in national boundaries cause ambiguities in the data and may make long-term trend<br />
analysis more complicated.<br />
However, in some cases, available data may differ greatly according to sources, be more<br />
or less documented estimations and / or subject to controversies. In these cases, CRED<br />
always compiles all available data or analysis to try to make its own documented estimation,<br />
which can be revised when more accurate data are provided.
Information systems have improved vastly in the last 25 years and statistical data are<br />
now more easily available, intensified by an increasing sensitivity to disaster occurrence<br />
and consequences. Nevertheless there are still discrepancies. An analysis <strong>of</strong> the quality<br />
and accuracy <strong>of</strong> disaster data, performed by CRED in 2002, showed that occasionally,<br />
for the same disaster, differences <strong>of</strong> more than 20 per cent may exist between the<br />
quantitative data reported by the three major databases – EM-DAT (CRED), NatCat<br />
(Munich Re) and Sigma (Swiss Re).<br />
Despite efforts to verify and review data, the quality <strong>of</strong> disaster databases can only be<br />
as good as the reporting system. This, combined with the different aims <strong>of</strong> the three<br />
major disaster databases (risk and economic risk analysis for reinsurance companies,<br />
development agenda for CRED), may explain differences between data provided for<br />
some disasters. However, in spite <strong>of</strong> these differences, the overall trends indicated by<br />
the three databases remain similar.<br />
The lack <strong>of</strong> systematization and standardization <strong>of</strong> data collection is a major weakness<br />
when it comes to long-term planning. Fortunately, due to increased pressures<br />
for accountability from various sources, many donors and development agencies have<br />
started paying attention to data collection and its methodologies.<br />
Part <strong>of</strong> the solution to this data problem lies in retrospective analysis. Data are most<br />
<strong>of</strong>ten publicly quoted and reported during a disaster event, but it is only long after<br />
the event, once the relief operation is over, that estimates <strong>of</strong> damage and death can be<br />
verified. Some data gatherers, like CRED, revisit the data; this accounts for retrospective<br />
annual disaster figures changing one, two and sometimes even three years after the<br />
event.<br />
Philippe Hoyois, senior research fellow with CRED, Regina Below, manager <strong>of</strong> CRED’s<br />
EM-DAT disaster database, and Debarati Guha-Sapir, director <strong>of</strong> CRED, prepared<br />
the statistics annex. For further information, please contact: Centre for Research on the<br />
Epidemiology <strong>of</strong> <strong>Disasters</strong> (CRED), School <strong>of</strong> Public Health, Catholic University <strong>of</strong><br />
Louvain, 30.94, Clos Chapelle-aux-Champs, 1200 Brussels, Belgium, tel.: +32 2 764<br />
3327, fax: +32 2 764 3441, e-mail: contact@emdat.be, web site: www.emdat.be<br />
<strong>World</strong> <strong>Disasters</strong> <strong>Report</strong> <strong>2010</strong> – Disaster data<br />
ANNEX 1<br />
165
ANNEX 1<br />
166<br />
Table 1 Total number <strong>of</strong> reported disasters, 1 by continent, by year and by level <strong>of</strong> human development (2000 to 2009)<br />
2000 2001 2002 2003 2004 2005 2006 2007 2008 2009 Total2 Africa 202 184 197 170 164 170 200 181 168 146 1,782<br />
Americas 151 134 156 126 137 139 103 133 144 111 1,334<br />
Asia 303 295 310 294 318 359 304 257 238 225 2,903<br />
Europe 130 96 115 96 98 127 98 104 57 75 996<br />
Oceania 13 18 19 20 22 16 18 11 13 19 169<br />
Very high human<br />
131 114 132 115 106 111 98 95 85 78 1,065<br />
development<br />
High human development 156 125 143 124 149 145 109 132 99 107 1,289<br />
Medium human<br />
454 415 450 399 422 468 420 365 362 318 4,073<br />
development<br />
Low human development 58 73 72 68 62 87 96 94 74 73 757<br />
Total 799 727 797 706 739 811 723 686 620 576 7,184<br />
Source: EM-DAT, CRED, University <strong>of</strong> Louvain, Belgium<br />
Among continents, Africa and Asia experienced their smallest number <strong>of</strong><br />
disasters <strong>of</strong> the decade. In the Americas and in Europe, this number was the<br />
second lowest <strong>of</strong> the last ten years.<br />
In 2009, the number <strong>of</strong> disasters for Oceania was the third highest <strong>of</strong> the<br />
decade.<br />
Numbers <strong>of</strong> disasters were at their lowest level in 2009 in countries with very<br />
high human development and medium human development, and near their<br />
lowest level in countries with high human development. On the other hand, this<br />
number remained proportionaly high in countries with low human development.<br />
With 39 per cent <strong>of</strong> all disasters, Asia remains the most frequently hit continent<br />
and is, in 2009, just below its decade’s average <strong>of</strong> 40 per cent.<br />
1 In Tables 1–13,’disasters’ refer to those with a natural and/or technological<br />
trigger only, and do not include wars, conflict-related famines, diseases or<br />
epidemics.<br />
2 Since slow-onset disasters can affect the same country over a number <strong>of</strong> years,<br />
it is best to use figures on total numbers to calculate annual averages over a<br />
decade rather than as absolute totals (see the methodology chapter <strong>of</strong> this<br />
annex).<br />
See note on UNDP’s Human Development Index country status in the section on<br />
disaster definitions in the introduction to this annex.<br />
With 576 disasters, 2009 is the year with the lowest number <strong>of</strong> disasters <strong>of</strong> the<br />
decade, far below the peaks <strong>of</strong> 2000, 2002 and 2005.
Table 2 Total number <strong>of</strong> people reported killed, by continent, by year and by level <strong>of</strong> human development (2000 to 2009)<br />
2000 2001 2002 2003 2004 2005 2006 2007 2008 2009 Total<br />
Africa 5,392 4,520 7,639 6,160 4,246 3,184 5,789 3,695 3,039 3,142 46,806<br />
Americas 2,066 3,077 2,108 2,082 8,437 5,438 1,558 2,921 2,730 2,160 32,577<br />
Asia 88,056 105,960 89,427 39,030 238,404 90,796 20,634 15,581 235,618 9,744 933,250<br />
Europe 1,622 2,338 1,810 73,373 1,259 1,044 5,837 1,665 787 1,319 91,054<br />
Oceania 205 9 91 64 35 46 24 273 25 893 1,665<br />
Very high human<br />
1,518 1,433 1,431 72,889 1,102 2,925 4,152 1,017 883 2,090 89,440<br />
development<br />
High human development 2,478 2,905 2,843 2,983 2,572 1,961 2,707 3,182 1,589 2,804 26,024<br />
Medium human<br />
15,049 33,643 16,085 43,446 247,165 93,414 24,318 17,391 237,373 11,000 738,884<br />
development<br />
Low human development 78,296 77,923 80,716 1,391 1,542 2,208 2,665 2,545 2,354 1,364 251,004<br />
Total 97,341 115,904 101,075 120,709 252,381 100,508 33,842 24,135 242,199 17,258 1,105,352<br />
Source: EM-DAT, CRED, University <strong>of</strong> Louvain, Belgium<br />
The number <strong>of</strong> people reported dead was also the lowest <strong>of</strong> the decade in<br />
countries <strong>of</strong> medium and low human development.<br />
The deadliest disaster in 2009 was an earthquake in southern Sumatra<br />
(Indonesia), which caused 1,117 deaths. This figure is far below the death<br />
tolls caused by the Indian Ocean tsunami in 2004 (226,408 deaths), Cyclone<br />
Nargis in Myanmar in 2008 (138,366 deaths) and earthquakes in Sichuan,<br />
China in 2008 (87,476 deaths), Kashmir in 2005 (73,338 deaths) Bam, Iran<br />
in 2003 (26,796 deaths) and Gujurat, India in 2001 (20,005 deaths).<br />
See note on UNDP’s Human Development Index country status in the section on<br />
disaster definitions in the introduction to this annex.<br />
In 2009 the number <strong>of</strong> people reported killed was the lowest <strong>of</strong> the decade, far<br />
below the decade’s average <strong>of</strong> 110,535.<br />
On the other hand, in Oceania, the number <strong>of</strong> people killed largely surpassed<br />
its peaks <strong>of</strong> 2000 and 2007.<br />
In 2009, 56 per cent <strong>of</strong> people killed by disasters lived in Asia, far below the<br />
decade’s average <strong>of</strong> 84 per cent.<br />
Inversely the proportions <strong>of</strong> people killed in Africa (18 per cent), in the Americas<br />
(13 per cent) and in Oceania (5 per cent) were significantly higher than their<br />
decade’s average (4, 3 and 0.2 per cent, respectively).<br />
<strong>World</strong> <strong>Disasters</strong> <strong>Report</strong> <strong>2010</strong> – Disaster data<br />
ANNEX 1<br />
167
ANNEX 1<br />
168<br />
Table 3 Total number <strong>of</strong> people reported affected, by continent, by year and by level <strong>of</strong> human development<br />
(2000 to 2009), in thousands<br />
2000 2001 2002 2003 2004 2005 2006 2007 2008 2009 Total1 Africa 46,000 45,545 44,601 29,266 36,902 22,856 22,965 12,526 21,465 24,468 306,595<br />
Americas 975 10,913 2,517 3,995 9,698 8,308 1,450 9,119 20,410 5,776 73,161<br />
Asia 206,644 186,203 663,070 235,689 132,290 129,716 119,660 192,185 182,465 111,793 2,159,715<br />
Europe 2,929 787 1,493 1,546 538 527 260 1,651 268 146 10,144<br />
Oceania 7 31 41 38 119 28 38 172 105 77 658<br />
Very high human<br />
781 1,238 1,006 575 5,560 1,176 142 1,176 13,489 2,470 27,613<br />
development<br />
High human development 911 8,162 2,675 4,633 4,024 6,878 1,400 8,037 5,495 2,591 44,806<br />
Medium human<br />
228,503 206,084 680,839 242,503 155,556 135,414 122,889 195,814 190,231 123,149 2,280,981<br />
development<br />
Low human development 26,361 27,996 27,203 22,822 14,406 17,968 19,942 10,625 15,499 14,050 196,872<br />
Total 256,556 243,480 711,722 270,533 179,546 161,436 144,373 215,652 224,714 142,260 2,550,272<br />
Source: EM-DAT, CRED, University <strong>of</strong> Louvain, Belgium<br />
In 2009, the number <strong>of</strong> people affected living in countries <strong>of</strong> low human<br />
development and <strong>of</strong> medium human development was the second lowest <strong>of</strong> the<br />
decade.<br />
Three major disasters, affecting more than 10 million people, occurred in China:<br />
floods in July (almost 40 million people affected) and two windstorms in August<br />
and November (11 and 10 million people affected, respectively).<br />
1 Since slow-onset disasters can affect the same people a number <strong>of</strong> years, it is<br />
best to use figures on total numbers affected to calculate annual averages over<br />
a decade rather than as absolute totals.<br />
See note on UNDP’s Human Development Index country status in the section on<br />
disaster definitions in the introduction to this annex.<br />
In 2009, the number <strong>of</strong> 142 million people affected by disasters was the lowest<br />
<strong>of</strong> the decade, far below the annual average <strong>of</strong> 255 million people affected.<br />
In Asia and Europe, the number <strong>of</strong> people affected was, in 2009, the lowest <strong>of</strong><br />
the decade.
Table 4 Total amount <strong>of</strong> disaster estimated damage, by continent, by year and by level <strong>of</strong> human development<br />
(2000 to 2009) – in millions <strong>of</strong> US dollars (2009 prices)<br />
2000 2001 2002 2003 2004 2005 2006 2007 2008 2009 Total<br />
Africa 1,243 805 436 6,455 1,908 38 244 782 863 173 12,947<br />
Americas 6,800 15,946 15,386 25,085 74,679 189,370 7,226 16,625 64,162 13,337 428,616<br />
Asia 27,108 15,687 15,855 27,630 75,332 30,494 24,873 35,747 117,927 15,449 386,102<br />
Europe 22,176 2,395 40,283 21,415 2,072 17,261 2,584 22,796 4,644 10,789 146,414<br />
Oceania 668 696 2,601 691 627 241 1,368 1,488 2,506 1,726 12,612<br />
Very high human<br />
39,272 16,087 60,332 50,959 122,083 192,144 11,694 46,461 64,178 24,655 627,865<br />
development<br />
High human development 2,259 3,952 3,328 2,907 7,058 14,607 2,041 11,564 6,360 2,412 56,488<br />
Medium human<br />
8,370 15,421 10,842 27,178 24,878 30,641 22,557 18,922 119,537 14,234 292,579<br />
development<br />
Low human development 8,094 69 60 233 600 12 3 489 27 173 9,760<br />
Total 57,995 35,528 74,561 81,277 154,619 237,404 36,295 77,436 190,102 41,474 986,691<br />
Source: EM-DAT, CRED, University <strong>of</strong> Louvain, Belgium<br />
In 2009, Europe accounted for 26 per cent <strong>of</strong> damage, above its 15 per cent<br />
average <strong>of</strong> the decade.<br />
Very high human development countries experienced 59 per cent <strong>of</strong> damage in<br />
2009, compared to 64 per cent for the entire decade.<br />
Inversely, the contribution <strong>of</strong> medium human development countries to the<br />
total amount <strong>of</strong> damages climbed to 34 per cent, up from 30 per cent for the<br />
decade.<br />
Windstorm Klaus, in France, was the costliest disaster in 2009 (more than US$<br />
3 billion reported damages), but it appears only at the 51st place in the ranking<br />
<strong>of</strong> the most expensive disasters.<br />
See note on UNDP’s Human Development Index country status in the section on<br />
disaster definitions in the introduction to this annex.<br />
As mentioned in the introduction, damage assessment is frequently unreliable.<br />
Even for the existing data, the methodologies are not standardized and the<br />
financial coverage can vary significantly.<br />
Depending on where the disaster occurs and who reports it, estimations may<br />
vary from zero to billions <strong>of</strong> US dollars. The total amount <strong>of</strong> damage reported in<br />
2009 was the third lowest <strong>of</strong> the decade, after 2001 and 2006.<br />
Inversely, in Oceania, the amount <strong>of</strong> damages was the third highest <strong>of</strong> the<br />
decade, after 2002 and 2008.<br />
<strong>World</strong> <strong>Disasters</strong> <strong>Report</strong> <strong>2010</strong> – Disaster data<br />
ANNEX 1<br />
169
ANNEX ANNEX 11<br />
170<br />
Table 5 Total number <strong>of</strong> reported disasters, by type <strong>of</strong> phenomenon and by year (2000 to 2009)<br />
2000 2001 2002 2003 2004 2005 2006 2007 2008 2009 Total1 Droughts / food insecurity 43 43 40 23 19 28 20 14 20 23 273<br />
Earthquakes / tsunamis 31 25 37 40 42 25 24 21 23 22 290<br />
Extreme temperatures 31 23 15 26 19 29 32 25 11 26 237<br />
Floods2 158 157 171 160 132 195 229 218 169 150 1,739<br />
Forest / scrub fires 30 14 22 14 8 13 9 18 5 9 142<br />
Insect infestation 2 2 n.d.r. n.d.r. 12 n.d.r. n.d.r. n.d.r. n.d.r. 1 17<br />
Mass movement: dry3 1 n.d.r. 1 n.d.r. 1 n.d.r. 1 n.d.r. 3 1 8<br />
Mass movement: wet4 28 24 20 21 15 12 20 10 12 31 193<br />
Volcanic eruptions 5 6 7 2 5 8 12 6 7 3 61<br />
Windstorms 102 108 124 86 127 130 76 105 111 85 1,054<br />
Subtotal climato-, hydro- &<br />
394 371 392 330 332 407 386 390 328 325 3,655<br />
meteorological disasters<br />
Subtotal geophysical<br />
37 31 45 42 48 33 37 27 33 26 359<br />
disasters<br />
Total natural disasters 431 402 437 372 380 440 423 417 361 351 4,014<br />
Industrial accidents 51 54 48 52 81 76 62 52 38 43 557<br />
Miscellaneous accidents 58 50 52 45 62 66 33 43 30 27 466<br />
Transport accidents 259 221 260 237 216 229 205 174 191 155 2,147<br />
Total technological<br />
368 325 360 334 359 371 300 269 259 225 3,170<br />
disasters<br />
Total 799 727 797 706 739 811 723 686 620 576 7,184<br />
Among natural disasters, the most frequent were floods (43 per cent),<br />
in a proportion equal to the decade’s average (also 43 per cent).<br />
Extreme temperatures (7 per cent) and mass movements <strong>of</strong> hydrological origin<br />
(9 per cent) surpassed their decade’s average (6 and 5 per cent, respectively).<br />
All other natural disasters were sligthly below their decade’s average.<br />
Among technological disasters, transport accidents were the most frequent, but<br />
their number was the lowest <strong>of</strong> the decade.<br />
The number <strong>of</strong> miscellaneous accidents was also the lowest <strong>of</strong> the decade.<br />
1 Since slow-onset disasters can affect the same country over a number <strong>of</strong> years,<br />
it is best to use figures on total numbers to calculate annual averages over a<br />
decade rather than as absolute totals (see the methodology chapter <strong>of</strong> this<br />
annex).<br />
2 Includes waves and surges.<br />
3 Landslides, rockfalls, subsidence <strong>of</strong> geophysical origin.<br />
4 Landslides, avalanches, subsidence <strong>of</strong> hydrological origin.<br />
Note: ’n.d.r.’ denotes ‘no disaster reported’.<br />
In 2009, the number <strong>of</strong> both natural and technological disasters was the lowest<br />
<strong>of</strong> the decade, far below their peak <strong>of</strong> 2005.
Table 6 Total number <strong>of</strong> people reported killed, by type <strong>of</strong> phenomenon and by year (2000 to 2009)<br />
2000 2001 2002 2003 2004 2005 2006 2007 2008 2009 Total<br />
Droughts / food insecurity 76,379 76,476 76,903 38 80 88 208 n.a. 6 3 230,181<br />
Earthquakes / tsunamis 216 21,348 1,636 29,617 227,290 76,241 6,692 780 87,918 1,815 453,553<br />
Extreme temperatures 941 1,787 3,019 74,748 556 814 5,104 1,044 1,608 1,122 90,743<br />
Floods<br />
ANNEX 1<br />
1 6,025 5,014 4,236 3,772 7,100 5,764 5,863 8,565 4,037 3,419 53,795<br />
Forest / scrub fires 47 33 6 47 14 50 13 150 86 190 636<br />
Insect infestation n.a. n.a. n.d.r. n.d.r. n.a. n.d.r. n.d.r. n.d.r. n.d.r. n.a. n.a.<br />
Mass movement: dry2 11 n.d.r. 60 n.d.r. 44 n.d.r. 11 n.d.r. 120 36 282<br />
Mass movement: wet3 1,012 786 1,089 706 313 646 1,638 271 504 658 7,623<br />
Volcanic eruptions n.a. n.a. 200 n.a. 2 3 5 11 9 n.a. 230<br />
Windstorms 1,354 1,914 1,475 1,031 6,653 5,250 4,329 6,035 140,985 3,308 172,334<br />
Subtotal climato-, hydro- &<br />
85,758 86,010 86,728 80,342 14,716 12,612 17,155 16,065 147,226 8,700 555,312<br />
meteorological disasters<br />
Subtotal geophysical<br />
227 21,348 1,896 29,617 227,336 76,244 6,708 791 88,047 1,851 454,065<br />
disasters<br />
Total natural disasters 85,985 107,358 88,624 109,959 242,052 88,856 23,863 16,856 235,273 10,551 1,009,377<br />
Industrial accidents 1,807 1,279 1,112 1,444 1,797 2,281 1,832 1,656 776 933 14,917<br />
Miscellaneous accidents 1,341 1,341 2,013 1,438 2,115 2,669 1,126 909 895 916 14,763<br />
Transport accidents 8,208 5,926 9,326 7,868 6,417 6,702 7,021 4,714 5,255 4,858 66,295<br />
Total technological<br />
11,356 8,546 12,451 10,750 10,329 11,652 9,979 7,279 6,926 6,707 95,975<br />
disasters<br />
Total 97,341 115,904 101,075 120,709 252,381 100,508 33,842 24,135 242,199 17,258 1,105,352<br />
Source: EM-DAT, CRED, University <strong>of</strong> Louvain, Belgium<br />
1 Includes waves and surges.<br />
Conversely, forest / scrub fires resulted in the highest number and proportion<br />
2 Landslides, rockfalls, subsidence <strong>of</strong> geophysical origin.<br />
<strong>of</strong> deaths.<br />
3 Landslides, avalanches, subsidence <strong>of</strong> hydrological origin.<br />
Deaths from industrial and transport accidents were the second lowest <strong>of</strong> the<br />
Note: ’n.a.’ denotes ’no data available’; ’n.d.r.’ signifies ‘no disaster reported’. decade; deaths from miscellaneous accidents, the third lowest.<br />
For more information, see section on caveats in introductory text.<br />
Most reported deaths caused by droughts and food insecurity during the decade<br />
In 2009, deaths from both natural and technological disasters were at their were attributable to the famine in the Democratic People’s Republic <strong>of</strong> Korea,<br />
lowest level for the entire decade.<br />
although the estimates provided are disputed (see caveats in the introductory<br />
Among natural disasters, the number <strong>of</strong> deaths from floods is the lowest <strong>of</strong> the text).<br />
decade, but in proportion (32 per cent), it surpasses its 5 per cent decennial<br />
average.<br />
<strong>World</strong> <strong>Disasters</strong> <strong>Report</strong> <strong>2010</strong> – Disaster data<br />
171
ANNEX 1<br />
Table 7 Total number <strong>of</strong> people reported affected, by type <strong>of</strong> phenomenon and by year (2000 to 2009), in thousands<br />
172<br />
2000 2001 2002 2003 2004 2005 2006 2007 2008 2009 Total1 Droughts / food insecurity 164,579 166,772 428,879 81,842 35,272 30,643 41,971 9,578 36,411 29,498 1,025,446<br />
Earthquakes / tsunamis 2,479 9,711 851 4,194 3,147 6,187 3,859 1,382 47,580 3,221 82,612<br />
Extreme temperatures 28 213 104 1,890 2,140 2 63 988 79,172 1,050 85,651<br />
Floods2 73,905 34,552 167,769 169,515 117,212 75,028 30,383 177,836 45,660 57,253 949,112<br />
Forest / scrub fires 39 6 26 184 21 7 2 1,785 59 12 2,140<br />
Insect infestation n.a. n.a. n.d.r. n.d.r. n.a. n.d.r. n.d.r. n.d.r. n.d.r. 500 500<br />
Mass movement: dry3 n.a. n.d.r. n.a. n.d.r. n.a. n.d.r. n.a. n.d.r. 1 3 4<br />
Mass movement: wet4 215 71 305 459 12 10 432 9 5 52 1,570<br />
Volcanic eruptions 127 110 278 25 53 341 379 51 136 57 1,556<br />
Windstorms 15,137 31,991 113,441 11,758 21,383 49,117 67,109 23,974 15,651 50,583 400,144<br />
Subtotal climato-, hydro- &<br />
253,902 233,605 710,524 265,647 176,039 154,808 139,960 214,170 176,958 138,947 2,464,562<br />
meteorological disasters<br />
Subtotal geophysical<br />
2,605 9,822 1,130 4,219 3,200 6,528 4,237 1,433 47,717 3,280 84,172<br />
disasters<br />
Total natural disasters 256,508 243,426 711,654 269,867 179,239 161,336 144,198 215,604 224,675 142,227 2,548,734<br />
Industrial accidents 17 19 2 646 157 16 137 3 14 6 1,017<br />
Miscellaneous accidents 24 31 61 15 102 77 35 41 21 23 430<br />
Transport accidents 7 3 6 5 48 6 4 4 4 4 91<br />
Total technological<br />
48 53 68 667 307 100 175 48 39 33 1,538<br />
disasters<br />
Total 256,556 243,480 711,722 270,533 179,546 161,436 144,373 215,652 224,714 142,260 2,550,272<br />
Source: EM-DAT, CRED, University <strong>of</strong> Louvain, Belgium<br />
In 2009, for both natural and technological disasters, the numbers <strong>of</strong> people<br />
affected were at their lowest level for the decade.<br />
<strong>Disasters</strong> which affected the most people in 2009 were floods (57 million<br />
people affected: 40 per cent <strong>of</strong> those affected by disasters).<br />
Windstorms (50 million people affected) accounted for 36 per cent <strong>of</strong> those<br />
affected by disasters, far above their annual average (16 per cent).<br />
In Liberia, 500,000 people were affected by an insect infestation.<br />
1 Since slow-onset disasters can affect the same people over a number <strong>of</strong> years,<br />
it is best to use figures on total numbers affected to calculate annual averages<br />
over a decade rather than as absolute totals.<br />
2 Includes waves and surges.<br />
3 Landslides, rockfalls, subsidence <strong>of</strong> geophysical origin.<br />
4 Landslides, avalanches, subsidence <strong>of</strong> hydrological origin.<br />
Note: ’n.a.’ denotes ’no data available’; ’n.d.r.’ denotes ’no disaster reported’.<br />
For more information, see section on caveats in introductory text.
Table 8 Total amount <strong>of</strong> disaster estimated damage, by type <strong>of</strong> phenomenon and by year (2000 to 2009) – in millions <strong>of</strong> US<br />
dollars (2009 prices)<br />
2000 2001 2002 2003 2004 2005 2006 2007 2008 2009 Total<br />
Droughts / food insecurity 5,107 2,787 9,884 863 1,700 2,149 3,337 524 216 245 26,811<br />
Earthquakes / tsunamis 514 8,920 2,466 9,622 43,844 7,366 3,652 15,492 85,491 6,059 183,425<br />
Extreme temperatures 461 242 n.a. 14,598 n.a. 439 1,064 n.a. 21,862 1,131 39,798<br />
Floods1 32,148 5,757 31,990 24,152 11,965 19,707 8,307 25,181 19,655 7,723 186,584<br />
Forest / scrub fires 3,188 109 432 7,107 3 4,226 893 4,757 2,421 1,515 24,651<br />
Insect infestation 150 n.a. n.d.r. n.d.r. n.a. n.d.r. n.d.r. n.d.r. n.d.r. n.a. 150<br />
Mass movement: dry2 n.a. n.d.r. n.a. n.d.r. n.a. n.d.r. n.a. n.d.r. n.a. n.a. n.a.<br />
Mass movement: wet3 576 86 230 61 4 60 43 n.a. n.a. 154 1,212<br />
Volcanic eruptions 3 20 11 n.a. n.a. n.a. 160 n.a. n.a. n.a. 193<br />
Windstorms 15,523 17,589 17,597 24,874 95,616 202,996 18,839 30,584 60,457 24,641 508,717<br />
Subtotal climato-, hydro- &<br />
57,152 26,570 60,132 71,655 109,289 229,577 32,482 61,045 104,612 35,409 787,923<br />
meteorological disasters<br />
Subtotal geophysical<br />
517 8,940 2,477 9,622 43,844 7,366 3,811 15,492 85,491 6,059 183,618<br />
disasters<br />
Total natural disasters 57,669 35,510 62,609 81,277 153,133 236,943 36,293 76,537 190,102 41,468 971,541<br />
Industrial accidents n.a. 12 11,878 n.a. 1,022 450 n.a. 899 n.a. 6 14,268<br />
Miscellaneous accidents 326 6 74 n.a. n.a. 11 1 n.a. n.a. n.a. 418<br />
Transport accidents n.a. n.a. n.a. n.a. 463 n.a. n.a. n.a. n.a. n.a. 463<br />
Total technological<br />
326 18 11,952 n.a. 1,486 462 1 899 n.a. 6 15,150<br />
disasters<br />
Total 57,995 35,528 74,561 81,277 154,619 237,404 36,295 77,436 190,102 41,474 986,691<br />
Source: EM-DAT, CRED, University <strong>of</strong> Louvain, Belgium<br />
The costliest disasters <strong>of</strong> the decade were windstorms (51.6 per cent), floods<br />
(19 per cent) and earthquakes / tsunamis (18.5 per cent).<br />
In 2009, hydrometeorological disasters accounted for 85 per cent <strong>of</strong> reported<br />
damages, with windstorms accounting for 59 per cent.<br />
Damages reported for droughts and floods were the second lowest <strong>of</strong> the<br />
decade.<br />
The proportion <strong>of</strong> damages attributable, in 2009, to windstorms (59 per cent<br />
1 Includes waves and surges.<br />
2 Landslides, rockfalls, subsidence <strong>of</strong> geophysical origin.<br />
3 Landslides, avalanches, subsidence <strong>of</strong> hydrological origin.<br />
Note: ’n.a.’ denotes ‘no data available’; ’n.d.r.’ denotes ‘no disaster reported’.<br />
For more information, see section on caveats in introductory text.<br />
Estimates <strong>of</strong> disaster damage must be treated with caution, as the financial<br />
value attached to infrastructures in developed countries is much higher than<br />
in developing countries. While reporting is better for large disasters, the low<br />
reporting rates <strong>of</strong> direct damage make analysis difficult.<br />
<strong>World</strong> <strong>Disasters</strong> <strong>Report</strong> <strong>2010</strong> – Disaster data<br />
<strong>of</strong> reported damages) was higher than their decennial average (52 per cent).<br />
ANNEX 1<br />
173
ANNEX 1<br />
174<br />
Table 9 Total number <strong>of</strong> reported disasters, by type <strong>of</strong> phenomenon, by continent and by level <strong>of</strong> human development1 (2000 to 2009)<br />
Africa Americas Asia Europe Oceania VHHD HHD MHD LHD Total<br />
Droughts / food insecurity 126 57 73 15 2 15 29 154 75 273<br />
Earthquakes / tsunamis 24 43 173 39 11 38 55 177 20 290<br />
Extreme temperatures 5 40 60 130 2 72 91 70 4 237<br />
Floods2 421 356 655 259 48 236 372 870 261 1,739<br />
Forest / scrub fires 13 53 14 52 10 77 37 23 5 142<br />
Insect infestation 12 1 1 1 2 2 2 6 7 17<br />
Mass movement: dry3 1 3 3 n.d.r. 1 n.d.r. 2 6 n.d.r. 8<br />
Mass movement: wet4 13 38 122 14 6 8 40 137 8 193<br />
Volcanic eruptions 7 23 19 1 11 4 18 35 4 61<br />
Windstorms 94 329 416 150 65 366 159 489 40 1,054<br />
Subtotal climato-, hydro- &<br />
684 874 1,341 621 135 776 730 1,749 400 3,655<br />
meteorological disasters<br />
Subtotal geophysical<br />
32 69 195 40 23 42 75 218 24 359<br />
disasters<br />
Total natural disasters 716 943 1,536 661 158 818 805 1,967 424 4,014<br />
Industrial accidents 68 23 414 52 n.d.r. 22 51 454 30 557<br />
Miscellaneous accidents 114 66 212 72 2 56 91 283 36 466<br />
Transport accidents 884 302 741 211 9 169 342 1,369 267 2,147<br />
Total technological<br />
1,066 391 1,367 335 11 247 484 2,106 333 3,170<br />
disasters<br />
Total 1,782 1,334 2,903 996 169 1,065 1,289 4,073 757 7,184<br />
Source: EM-DAT, CRED, University <strong>of</strong> Louvain, Belgium
During the decade:<br />
Asia accounted for 40 per cent <strong>of</strong> the total number <strong>of</strong> disasters but for 74 per<br />
cent <strong>of</strong> industrial accidents, 63 per cent <strong>of</strong> mass movements <strong>of</strong> hydrological<br />
origin, 60 per cent <strong>of</strong> earthquakes / tsunamis and 45 per cent <strong>of</strong> miscellaneous<br />
accidents.<br />
1 VHHD stands for very high human development, HHD stands for high human<br />
development, MHD for medium human development and LHD for low human<br />
development.<br />
See note on UNDP’s Human Development Index country status in the section on<br />
disaster definitions in the introduction to this annex.<br />
Africa accounted for 25 per cent <strong>of</strong> the total number <strong>of</strong> disasters but for 71 per<br />
cent <strong>of</strong> insect infestations, 46 per cent <strong>of</strong> droughts / food insecurity events and<br />
41 per cent <strong>of</strong> transport accidents.<br />
2 Includes waves and surges.<br />
3 Landslides, rockfalls, subsidence <strong>of</strong> geophysical origin.<br />
Americas accounted for 19 per cent <strong>of</strong> the total number <strong>of</strong> disasters but for<br />
38 per cent <strong>of</strong> volcanic eruptions 37 per cent <strong>of</strong> wild fires and 31 per cent<br />
<strong>of</strong> windstorms.<br />
4 Landslides, avalanches, subsidence <strong>of</strong> hydrological origin.<br />
Europe accounted for 14 per cent <strong>of</strong> the total number <strong>of</strong> disasters but for 55 per<br />
cent <strong>of</strong> extreme temperatures and for 37 per cent <strong>of</strong> wild fires.<br />
Note: ’n.a.’ signifies ’no data available’; ’n.d.r.’ signifies ’no disaster reported’.<br />
For more information, see section on caveats in introductory text.<br />
Oceania accounted for 2 per cent <strong>of</strong> the total number <strong>of</strong> disasters but for 18 per<br />
cent <strong>of</strong> volcanic eruptions, 7 per cent <strong>of</strong> wild fires and 6 per cent <strong>of</strong> windstorms.<br />
<strong>World</strong> <strong>Disasters</strong> <strong>Report</strong> <strong>2010</strong> – Disaster data<br />
ANNEX 1<br />
175
ANNEX 1<br />
176<br />
Table 10 Total number <strong>of</strong> people reported killed, by type <strong>of</strong> phenomenon, by continent and by level <strong>of</strong> human development1 (2000 to 2009)<br />
Africa Americas Asia Europe Oceania VHHD HHD MHD LHD Total<br />
Droughts / food insecurity 1,069 54 229,056 2 n.a. n.a. n.a. 728 229,453 230,181<br />
Earthquakes / tsunamis 3,335 2,047 447,320 601 250 420 1,252 450,244 1,637 453,553<br />
Extreme temperatures 125 1,406 8,738 80,127 347 75,801 5,278 7,999 1,665 90,743<br />
Floods2 7,934 7,662 36,856 1,250 93 1,017 4,250 42,341 6,187 53,795<br />
Forest / scrub fires 154 73 3 200 206 424 50 112 50 636<br />
Insect infestation n.a. n.a. n.a. n.a. n.a. n.a. n.a. n.a. n.a. n.a.<br />
Mass movement: dry3 98 108 66 n.d.r. 10 n.d.r. 72 210 n.d.r. 282<br />
Mass movement: wet4 202 1,041 6,068 229 83 96 981 6,436 110 7,623<br />
Volcanic eruptions 206 16 8 n.a. n.a. n.a. 14 11 205 230<br />
Windstorms 1,273 9,998 160,242 521 300 5,758 788 165,240 548 172,334<br />
Subtotal climato-, hydro- &<br />
10,757 20,234 440,963 82,329 1,029 83,096 11,347 222,856 238,013 555,312<br />
meteorological disasters<br />
Subtotal geophysical<br />
3,639 2,171 447,394 601 260 420 1,338 450,465 1,842 454,065<br />
disasters<br />
Total natural disasters 14,396 22,405 888,357 82,930 1,289 83,516 12,685 673,321 239,855 1,009,377<br />
Industrial accidents 2,576 382 10,915 1,044 n.d.r. 177 1,021 12,807 912 14,917<br />
Miscellaneous accidents 3,361 2,302 7,524 1,540 36 1,205 3,199 9,679 680 14,763<br />
Transport accidents 26,473 7,488 26,454 5,540 340 4,542 9,119 43,077 9,557 66,295<br />
Total technological<br />
32,410 10,172 44,893 8,124 376 5,924 13,339 65,563 11,149 95,975<br />
disasters<br />
Total 46,806 32,577 933,250 91,054 1,665 89,440 26,024 738,884 251,004 1,105,352<br />
Source: EM-DAT, CRED, University <strong>of</strong> Louvain, Belgium
During the decade:<br />
Medium human development countries accounted for 67 per cent <strong>of</strong> the total<br />
number <strong>of</strong> reported deaths but for almost all deaths from earthquakes, 96 per<br />
cent <strong>of</strong> deaths due to windstorms, 86 per cent <strong>of</strong> those caused by industrial<br />
accidents and 79 per cent <strong>of</strong> deaths from floods.<br />
1 VHHD stands for very high human development, HHD stands for high human<br />
development, MHD for medium human development and LHD for low human<br />
development.<br />
See note on UNDP’s Human Development Index country status in the section on<br />
disaster definitions in the introduction to this chapterannex.<br />
Low human development countries accounted for 23 per cent <strong>of</strong> the total<br />
number <strong>of</strong> reported deaths but almost all deaths were caused by droughts / food<br />
insecurity and 89 per cent <strong>of</strong> deaths following a volcanic eruption.<br />
2 Includes waves and surges.<br />
3 Landslides, rockfalls, subsidence <strong>of</strong> geophysical origin.<br />
Very high human development countries accounted for 8 per cent <strong>of</strong> the total<br />
number <strong>of</strong> reported deaths, but for 67 per cent <strong>of</strong> deaths from wild fires.<br />
4 Landslides, avalanches, subsidence <strong>of</strong> hydrological origin.<br />
High human development countries accounted for 2 per cent <strong>of</strong> the total number<br />
<strong>of</strong> reported deaths but for 22 per cent <strong>of</strong> deaths from miscellaneous accidents<br />
and for 14 per cent <strong>of</strong> those from transport accidents.<br />
Note: ’n.a.’ signifies ’no data available’; ’n.d.r.’ signifies ’no disaster reported’.<br />
For more information, see section on caveats in introductory text.<br />
<strong>World</strong> <strong>Disasters</strong> <strong>Report</strong> <strong>2010</strong> – Disaster data<br />
ANNEX 1<br />
177
ANNEX 1<br />
178<br />
Table 11 Total number <strong>of</strong> people reported affected, by type <strong>of</strong> phenomenon, by continent and by level <strong>of</strong> human development1 (2000 to 2009), in thousands<br />
Africa Americas Asia Europe Oceania VHHD HHD MHD LHD Total<br />
Droughts / food insecurity 276,890 7,308 739,975 1,273 n.a. n.a. 3,260 846,128 176,059 1,025,446<br />
Earthquakes / tsunamis 387 3,092 78,380 731 23 296 2,093 79,969 255 82,612<br />
Extreme temperatures n.a. 4,944 80,596 107 2 6 4,964 80,309 371 85,650<br />
Floods2 23,596 29,245 892,535 3,570 167 13,330 16,561 901,380 17,841 949,112<br />
Forest / scrub fires 11 942 6 1,163 18 981 1,004 151 5 2,140<br />
Insect infestation 500 n.a. n.a. n.a. n.a. n.a. n.a. n.a. 500 500<br />
Mass movement: dry3 1 3 n.a. n.d.r. n.a. n.d.r. n.a. 4 n.d.r. 4<br />
Mass movement: wet4 16 187 1,352 3 11 2 178 1,076 313 1,570<br />
Volcanic eruptions 405 691 391 n.a. 69 16 688 730 121 1,556<br />
Windstorms 4,455 26,162 365,913 3,247 368 12,914 15,480 370,505 1,245 400,144<br />
Subtotal climato-, hydro- &<br />
305,467 68,787 2,080,378 9,364 566 27,233 41,446 2,199,549 196,333 2,464,561<br />
meteorological disasters<br />
Subtotal geophysical<br />
793 3,786 78,771 731 92 312 2,781 80,703 376 84,172<br />
disasters<br />
Total natural disasters 306,259 72,573 2,159,149 10,094 657 27,545 44,227 2,280,252 196,710 2,548,733<br />
Industrial accidents 104 566 325 23 n.d.r. 49 553 319 96 1,017<br />
Miscellaneous accidents 215 12 179 24 n.a. 10 20 382 18 430<br />
Transport accidents 16 10 61 4 n.a. 8 6 28 49 91<br />
Total technological<br />
335 587 566 50 n.a. 68 579 729 162 1,538<br />
disasters<br />
Total 306,595 73,161 2159715 10,144 658 27,613 44,806 2,280,981 196,872 2,550,272<br />
Source: EM-DAT, CRED, University <strong>of</strong> Louvain, Belgium
During the decade:<br />
Medium human development countries accounted for almost 89 per cent <strong>of</strong><br />
the total number <strong>of</strong> people reported affected by disasters but for 97 per cent<br />
<strong>of</strong> those affected by earthquakes / tsunamis, 95 per cent <strong>of</strong> people affected by<br />
floods, 94 per cent <strong>of</strong> those affected by extreme temperature and 93 per cent<br />
<strong>of</strong> those affected by windstorms.<br />
1 VHHD stands for very high human development, HHD stands for high human<br />
development, MHD for medium human development and LHD for low human<br />
development.<br />
See note on UNDP’s Human Development Index country status in the section on<br />
disaster definitions in the introduction to this annex.<br />
Low human development countries accounted for almost 8 per cent <strong>of</strong> the<br />
total number <strong>of</strong> people reported affected by disasters but for 54 per cent <strong>of</strong><br />
those affected by transport accidents and 21 per cent <strong>of</strong> people affected by<br />
droughts / food insecurities.<br />
2 Includes waves and surges.<br />
3 Landslides, rockfalls, subsidence <strong>of</strong> geophysical origin.<br />
4 Landslides, avalanches, subsidence <strong>of</strong> hydrological origin.<br />
High human development countries for 2 per cent <strong>of</strong> the total number <strong>of</strong> people<br />
reported affected by disasters but for 54 per cent <strong>of</strong> those affected by industrial<br />
accidents, 47 per cent <strong>of</strong> those affected by wild fires and 44 per cent <strong>of</strong> people<br />
affected by volcanic eruptions.<br />
Note: ’n.a.’ signifies ’no data available’; ’n.d.r.’ signifies ’no disaster reported’.<br />
For more information, see section on caveats in introductory text.<br />
Very high human development countries countries for 1 per cent <strong>of</strong> the total<br />
number <strong>of</strong> people reported affected by disasters but for 46 per cent <strong>of</strong> those<br />
affected by wild fires.<br />
<strong>World</strong> <strong>Disasters</strong> <strong>Report</strong> <strong>2010</strong> – Disaster data<br />
ANNEX 1<br />
179
ANNEX 1<br />
180<br />
Table 12 Total amount <strong>of</strong> disaster estimated damage, by type <strong>of</strong> phenomenon, by continent and by level <strong>of</strong> human<br />
development1 (2000 to 2009) – in millions <strong>of</strong> US dollars (2009 prices)<br />
Africa Americas Asia Europe Oceania VHHD HHD MHD LHD Total<br />
Droughts / food insecurity 737 8,113 11,937 3,639 2,385 9,458 4,180 13,173 n.a. 26,811<br />
Earthquakes / tsunamis 6,574 6,656 164,456 5,579 160 56,018 2,818 124,468 121 183,425<br />
Extreme temperatures 1 1,112 22,359 16,083 242 15,742 1,590 22,466 n.a. 39,798<br />
Floods2 3,474 28,159 85,477 64,601 4,873 91,067 17,880 75,982 1,655 186,584<br />
Forest / scrub fires 441 13,420 15 8,810 1,966 23,982 182 487 n.a. 24,651<br />
Insect infestation n.a. n.a. n.a. n.a. 150 150 n.a. n.a. n.a. 150<br />
Mass movement: dry3 n.a. n.a. n.a. n.d.r. n.a. n.d.r. n.a. n.a. n.d.r. n.a.<br />
Mass movement: wet4 n.a. 122 465 626 n.a. 626 122 465 n.a. 1,212<br />
Volcanic eruptions 11 173 6 4 n.a. 4 173 6 11 193<br />
Windstorms 785 370,779 100,451 33,864 2,837 418,509 29,460 53,241 7,507 508,717<br />
Subtotal climato-, hydro- &<br />
5,438 421,704 220,704 127,624 12,452 559,533 53,414 165,814 9,162 787,923<br />
meteorological disasters<br />
Subtotal geophysical<br />
6,585 6,829 164,461 5,583 160 56,021 2,991 124,474 131 183,618<br />
disasters<br />
Total natural disasters 12,023 428,533 385,166 133,207 12,612 615,554 56,405 290,289 9,293 971,541<br />
Industrial accidents 921 6 452 12,889 n.d.r. 11,992 6 2,270 n.a. 14,268<br />
Miscellaneous accidents 3 77 20 319 n.a. 319 77 20 3 418<br />
Transport accidents n.a. n.a. 463 n.a. n.a. n.a. n.a. n.a. 463 463<br />
Total technological<br />
923 83 936 13,208 n.a. 12,311 83 2,290 466 15,150<br />
disasters<br />
Total 12,947 428,616 386,102 146,414 12,612 627,865 56,488 292,579 9,760 986,691<br />
Source: EM-DAT, CRED, University <strong>of</strong> Louvain, Belgium
During the decade:<br />
Americas accounted for 43 per cent <strong>of</strong> the reported damages but for 89 per<br />
cent <strong>of</strong> costs related to volcanic eruptions and 73 per cent <strong>of</strong> those related<br />
to windstorms.<br />
1 VHHD stands for very high human development, HHD stands for high human<br />
development, MHD for medium human development and LHD for low human<br />
development.<br />
Asia accounted for 39 per cent <strong>of</strong> the reported damages but for 100 per cent<br />
<strong>of</strong> those caused by transport accidents, 90 per cent <strong>of</strong> costs related<br />
to earthquakes / tsunamis, 56 per cent <strong>of</strong> those caused by extreme temperatures<br />
and 46 per cent <strong>of</strong> those caused by floods.<br />
See note on UNDP’s Human Development Index country status in the section on<br />
disaster definitions in the introduction to this annex.<br />
2 Includes waves and surges.<br />
3 Landslides, rockfalls, subsidence <strong>of</strong> geophysical origin.<br />
Europe accounted for 15 per cent <strong>of</strong> the reported damages but for 90 per<br />
cent <strong>of</strong> those caused by industrial accidents, 76 per cent <strong>of</strong> those related to<br />
miscellaneous accidents, 40 per cent <strong>of</strong> those caused by extreme temperatures,<br />
36 per cent <strong>of</strong> those caused by wild fires and 35 per cent <strong>of</strong> those caused by<br />
floods.<br />
4 Landslides, avalanches, subsidence <strong>of</strong> hydrological origin.<br />
Note: ’n.a.’ signifies ’no data available’; ’n.d.r.’ signifies ’no disaster reported’.<br />
For more information, see section on caveats in introductory text.<br />
Africa accounted for 1 per cent <strong>of</strong> the reported damages but for 6 per cent <strong>of</strong><br />
those caused by industrial accidents and 6 per cent <strong>of</strong> those caused by volcanic<br />
eruptions.<br />
Estimates <strong>of</strong> disaster damage must be treated with caution, as the financial<br />
value attached to infrastructures in developed countries is much higher than<br />
in developing countries. While reporting is better for large disasters, the low<br />
reporting rates <strong>of</strong> direct damage make analysis difficult.<br />
Oceania accounted also for 1 per cent <strong>of</strong> the reported damages but for 9 per<br />
cent <strong>of</strong> those caused by droughts and 8 per cent <strong>of</strong> those caused by wild fires.<br />
Very high human development countries accounted for 64 per cent <strong>of</strong> all<br />
reported damages and low human development countries for less than<br />
1 per cent.<br />
<strong>World</strong> <strong>Disasters</strong> <strong>Report</strong> <strong>2010</strong> – Disaster data<br />
ANNEX 1<br />
181
Table 13 Total number <strong>of</strong> people reported killed and affected by disasters by country and<br />
territory (1990 to 1999; 2000 to 2009; and 2009)<br />
182<br />
Total<br />
number<br />
<strong>of</strong> people<br />
reported<br />
killed<br />
(1990–1999)<br />
Total<br />
number<br />
<strong>of</strong> people<br />
reported<br />
affected<br />
(1990–1999)<br />
Total<br />
number<br />
<strong>of</strong> people<br />
reported<br />
killed<br />
(2000–2009)<br />
Total<br />
number<br />
<strong>of</strong> people<br />
reported<br />
affected<br />
(2000–2009)<br />
Total<br />
number<br />
<strong>of</strong> people<br />
reported<br />
killed<br />
(2009)<br />
Total<br />
number<br />
<strong>of</strong> people<br />
reported<br />
affected<br />
(2009)<br />
Africa 27,913 180,081,852 46,806 306,594,733 3,142 24,468,380<br />
Algeria 469 68,389 4,200 411,903 103 2,628<br />
Angola 864 210,197 1,113 866,704 94 225,105<br />
Benin 37 834,196 385 290,774 60 120,449<br />
Botswana 20 105,500 3 148,792 0 5,056<br />
Burkina Faso 28 2,839,940 369 314,528 49 150,541<br />
Burundi 2 680,810 481 8,037,581 45 270,549<br />
Cameroon 555 378,164 764 37,916 36 305<br />
Cape Verde 18 16,306 60 30,001 3 n.a.<br />
Central African<br />
Republic<br />
7 76,618 294 73,279 4 23,972<br />
Chad 41 911,206 260 1,176,338 6 12,915<br />
Comoros 240 200 342 286,855 184 2,512<br />
Congo 665 78,500 138 139,668 n.d.r. n.d.r.<br />
Congo, Democratic<br />
Republic <strong>of</strong> the<br />
1,049 141,867 3,493 270,721 463 5,638<br />
Côte d’Ivoire 178 268 357 107,633 27 10,006<br />
Djibouti 145 240,775 197 1,223,173 13 340,024<br />
Egypt 2,561 261,830 3,257 7,147 83 73<br />
Equatorial Guinea n.d.r. n.d.r. 105 5,050 n.d.r. n.d.r.<br />
Eritrea1 133 3,915,725 56 10,907,043 n.d.r. n.d.r.<br />
Ethiopia1 836 6,788,247 1,717 49,334,051 n.a. 6,400,000<br />
Gabon 102 n.a. 94 811 n.a. 800<br />
Gambia 153 37,000 62 32,035 5 16,608<br />
Ghana 436 3,024,611 747 696,784 58 159,545<br />
Guinea 488 6,091 478 287,082 15 40,000<br />
Guinea Bissau 217 5,222 117 134,164 73 3<br />
Kenya 1,610 34,911,866 2,058 87,149,813 298 3,846,674<br />
Lesotho 22 994,750 41 1,956,561 n.d.r. n.d.r.<br />
Liberia 10 1,007,000 63 521,424 2 500,584<br />
Libya 252 n.a. 492 102 221 23<br />
Madagascar 501 1,510,056 1,116 5,905,799 27 130,799<br />
Malawi 494 31,368,500 854 15,035,023 26 37,134<br />
Mali 84 310,666 300 2,180,922 25 20,406<br />
Mauritania 147 514,194 187 3,132,763 1 9,000<br />
Mauritius 5 10,800 5 1,050 n.d.r. n.d.r.<br />
Mayotte (F) n.d.r. n.d.r. 21 12 n.d.r. n.d.r.<br />
Morocco 1,390 373,365 1,574 622,116 29 9,520
Total<br />
number<br />
<strong>of</strong> people<br />
reported<br />
killed<br />
(1990–1999)<br />
Total<br />
number<br />
<strong>of</strong> people<br />
reported<br />
affected<br />
(1990–1999)<br />
Total<br />
number<br />
<strong>of</strong> people<br />
reported<br />
killed<br />
(2000–2009)<br />
Total<br />
number<br />
<strong>of</strong> people<br />
reported<br />
affected<br />
(2000–2009)<br />
Total<br />
number<br />
<strong>of</strong> people<br />
reported<br />
killed<br />
(2009)<br />
<strong>World</strong> <strong>Disasters</strong> <strong>Report</strong> <strong>2010</strong> – Disaster data<br />
ANNEX 1<br />
183<br />
Total<br />
number<br />
<strong>of</strong> people<br />
reported<br />
affected<br />
(2009)<br />
Mozambique 647 9,824,663 1,609 11,317,161 31 14,057<br />
Namibia 20 876,400 167 1,164,309 92 350,000<br />
Niger 117 3,383,387 153 13,439,751 3 79,129<br />
Nigeria 3,763 805,377 8,662 596,449 273 150,072<br />
Reunion (F) 59 n.a. 4 3,790 n.d.r. n.d.r.<br />
Rwanda 160 1,058,682 280 5,944,806 n.d.r. n.d.r.<br />
Saint Helena (UK) n.d.r. n.d.r. n.a. 300 n.d.r. n.d.r.<br />
Sao Tome and Principe n.d.r. n.d.r. 33 34 n.d.r. n.d.r.<br />
Senegal 356 418,807 1,558 815,801 6 264,000<br />
Seychelles 5 1,237 3 11,630 n.d.r. n.d.r.<br />
Sierra Leone 815 200,025 662 21,046 257 1,477<br />
Somalia 2,656 1,240,610 1,060 10,251,843 15 3,301,753<br />
South Africa 1,705 366,742 1,544 15,255,780 94 20,300<br />
Sudan 1,031 22,078,538 1,074 9,927,696 31 4,411,455<br />
Swaziland n.a. 1,500,000 55 4,573,744 n.d.r. n.d.r.<br />
Tanzania 1,886 14,011,208 1,357 7,180,971 157 70,048<br />
Togo 3 341,905 96 188,167 19 n.a.<br />
Tunisia 78 152,089 546 33,851 110 217<br />
Uganda 477 1,170,737 1,222 5,649,666 11 750,000<br />
Zambia 163 5,973,455 385 4,260,442 31 614,964<br />
Zimbabwe 213 25,055,131 536 24,631,878 62 2,100,039<br />
Americas 77,918 52,474,486 32,577 73,160,749 2,160 5,775,652<br />
Anguilla (UK) n.a. 150 n.d.r. n.d.r. n.d.r. n.d.r.<br />
Antigua and Barbuda 6 11,684 n.a. 25,800 n.d.r. n.d.r.<br />
Argentina 452 571,831 575 754,421 23 45,534<br />
Aruba (NL) n.d.r. n.d.r. n.d.r. n.d.r. n.d.r. n.d.r.<br />
Bahamas 5 1,700 68 20,578 n.d.r. n.d.r.<br />
Barbados n.a. n.a. 1 2,881 n.d.r. n.d.r.<br />
Belize 31 62,600 55 150,570 n.d.r. n.d.r.<br />
Bermuda n.d.r. n.d.r. 22 n.a. n.d.r. n.d.r.<br />
Bolivia 513 754,886 911 2,204,254 19 90,523<br />
Brazil 2,057 20,345,253 2,664 7,370,878 n.d.r. 1,871,486<br />
Canada 510 82,765 76 34,756 18 204<br />
Cayman Islands (UK) n.d.r. n.d.r. 2 300 n.d.r. n.d.r.<br />
Chile 447 335,550 247 765,071 24 3<br />
Colombia 2,919 1,926,254 1,988 4,693,859 83 31,850<br />
Costa Rica 163 1,023,851 139 469,336 31 128,618<br />
Cuba 818 2,536,690 201 9,839,475 14 30<br />
Dominica 13 5,716 5 7,805 n.d.r. n.d.r.<br />
Dominican Republic 843 1,024,425 1,237 300,467 7 14,565<br />
Ecuador 999 463,815 559 1,039,275 3 119,307
ANNEX 1<br />
184<br />
Total<br />
number<br />
<strong>of</strong> people<br />
reported<br />
killed<br />
(1990–1999)<br />
Total<br />
number<br />
<strong>of</strong> people<br />
reported<br />
affected<br />
(1990–1999)<br />
Total<br />
number<br />
<strong>of</strong> people<br />
reported<br />
killed<br />
(2000–2009)<br />
Total<br />
number<br />
<strong>of</strong> people<br />
reported<br />
affected<br />
(2000–2009)<br />
Total<br />
number<br />
<strong>of</strong> people<br />
reported<br />
killed<br />
(2009)<br />
Total<br />
number<br />
<strong>of</strong> people<br />
reported<br />
affected<br />
(2009)<br />
El Salvador 674 101,480 1,754 2,182,807 275 90,000<br />
Falkland Islands (UK) n.d.r. n.d.r. n.d.r. n.d.r. n.d.r. n.d.r.<br />
French Guiana (F) n.a. 70,000 n.d.r. n.d.r. n.d.r. n.d.r.<br />
Greenland (DK) n.d.r. n.d.r. n.d.r. n.d.r. n.d.r. n.d.r.<br />
Grenada n.a. 1,210 40 61,650 n.d.r. n.d.r.<br />
Guadeloupe (F) 4 899 21 153 n.d.r. n.d.r.<br />
Guatemala 830 150,703 2,251 3,422,077 36 2,513,828<br />
Guyana n.a. 1,252,600 44 409,774 n.d.r. n.d.r.<br />
Haiti 4,112 2,604,514 6,936 1,191,958 88 12,787<br />
Honduras 15,276 2,860,970 434 1,849,813 7 300,136<br />
Jamaica 28 556,512 55 429,410 n.d.r. n.d.r.<br />
Martinique (F) 10 5,110 2 106 n.d.r. n.d.r.<br />
Mexico 4,136 2,420,218 1,598 6,792,601 121 252,299<br />
Montserrat (UK) 32 13,000 n.a. 200 n.d.r. n.d.r.<br />
Netherlands Antilles (NL) 2 40,000 15 4 n.d.r. n.d.r.<br />
Nicaragua 3,690 1,919,740 335 569,807 n.a. 26,782<br />
Panama 147 49,102 143 100,671 22 4,258<br />
Paraguay 114 470,654 456 591,955 n.a. 212,735<br />
Peru 2,909 5,577,770 3,586 6,678,647 641 25,775<br />
Puerto Rico (USA) 67 156,005 113 16,999 n.a. 1,500<br />
Saint Kitts and Nevis 5 12,980 n.d.r. n.d.r. n.d.r. n.d.r.<br />
Saint Lucia 4 1,125 1 n.a. n.d.r. n.d.r.<br />
Saint Pierre et<br />
Miquelon (F)<br />
n.d.r. n.d.r. n.d.r. n.d.r. n.d.r. n.d.r.<br />
Saint Vincent and<br />
The Grenadines<br />
3 300 4 1,534 n.d.r. n.d.r.<br />
Suriname n.d.r. n.d.r. 35 31,548 n.d.r. n.d.r.<br />
Trinidad and Tobago 5 1,627 3 1,760 n.d.r. n.d.r.<br />
Turks and Caicos<br />
Islands (UK)<br />
43 n.a. 89 1,818 85 118<br />
United States 5,283 4,407,989 5,198 20,850,645 215 11,314<br />
Uruguay 110 19,087 41 158,712 12 22,000<br />
Venezuela 30,648 623,718 673 136,374 18 n.a.<br />
Virgin Islands (UK) n.a. 3 n.d.r. n.d.r. n.d.r. n.d.r.<br />
Virgin Islands (US) 10 10,000 n.a. n.a. n.d.r. n.d.r.<br />
Asia 756,124 1,894,409,821 933,250 2,159,714,852 9,744 111,793,234<br />
Afghanistan 10,796 536,177 5,043 10,882,311 140 65,883<br />
Armenia2 106 7,022,954 1 297,000 n.d.r. n.d.r.<br />
Azerbaijan2 561 2,443,312 142 39,819 n.a. 5,000<br />
Bahrain 10 n.a. 212 60 n.d.r. n.d.r.<br />
Bangladesh 149,430 81,879,521 13,430 72,415,045 433 4,568,000<br />
Bhutan 39 65,600 223 1,012 23 12
Total<br />
number<br />
<strong>of</strong> people<br />
reported<br />
killed<br />
(1990–1999)<br />
Total<br />
number<br />
<strong>of</strong> people<br />
reported<br />
affected<br />
(1990–1999)<br />
Total<br />
number<br />
<strong>of</strong> people<br />
reported<br />
killed<br />
(2000–2009)<br />
Total<br />
number<br />
<strong>of</strong> people<br />
reported<br />
affected<br />
(2000–2009)<br />
Total<br />
number<br />
<strong>of</strong> people<br />
reported<br />
killed<br />
(2009)<br />
<strong>World</strong> <strong>Disasters</strong> <strong>Report</strong> <strong>2010</strong> – Disaster data<br />
ANNEX 1<br />
185<br />
Total<br />
number<br />
<strong>of</strong> people<br />
reported<br />
affected<br />
(2009)<br />
Brunei Darussalam n.a. n.a. n.d.r. n.d.r. n.d.r. n.d.r.<br />
Cambodia 816 18,789,379 526 8,392,339 36 178,104<br />
China’s People<br />
Republic3 36,381 1,258,680,092 111,768 1,126,067,999 1,152 72,464,797<br />
Georgia2 379 4,665 89 1,422,552 n.a. 7,306<br />
Hong Kong (China) 3 350 8,795 60 4,466 n.a. 350<br />
India 59,846 315,125,127 64,478 659,134,721 2,044 8,997,490<br />
Indonesia 8,705 7,065,982 182,999 11,668,855 1,946 2,876,919<br />
Iran, Islamic Republic 45,067 38,941,198 31,412 76,359,370 234 336<br />
Iraq 118 500 1,508 72,547 13 3,005<br />
Israel 156 1,343 49 885 n.d.r. n.d.r.<br />
Japan 6,602 1,441,107 1,128 1,654,816 89 32,848<br />
Jordan 59 198,340 145 150,322 n.d.r. n.d.r.<br />
Kazakhstan2 244 638,036 212 81,177 63 43<br />
Korea, Democratic<br />
People’s Republic4 381,865 49,554,203 230,313 26,402,902 n.d.r. n.d.r.<br />
Korea, Republic 2,451 446,138 1,355 521,840 17 14<br />
Kuwait 2 200 43 76 43 76<br />
Kyrgyzstan2 255 205,464 323 29,570 n.d.r. n.d.r.<br />
Lao People’s<br />
Democratic Republic<br />
180 2,860,862 77 1,386,082 26 128,887<br />
Lebanon 70 104,075 93 17,609 44 39<br />
Macau (China) 3 n.a. 3,986 n.a. 133 n.d.r. n.d.r.<br />
Malaysia 890 49,574 287 460,282 n.a. 10,875<br />
Maldives 10 23,849 133 28,963 n.d.r. n.d.r.<br />
Mongolia 280 105,061 165 4,841,665 29 910,007<br />
Myanmar 775 684,323 138,962 2,752,674 24 1,351<br />
Nepal 3,446 865,442 2,946 2,574,231 203 175,104<br />
Oman n.d.r. n.d.r. 192 20,115 n.d.r. n.d.r.<br />
Pakistan 9,318 20,514,524 78,779 26,319,733 244 75,183<br />
Palestine (West Bank<br />
and Gaza) 5 14 20 5 765 n.d.r. n.d.r.<br />
Philippines 15,965 38,820,297 11,705 50,230,127 1,409 13,353,441<br />
Qatar n.d.r. n.d.r. 30 n.a. 30 n.a.<br />
Saudi Arabia 2,550 1,936 1,369 24,530 161 10,000<br />
Singapore 3 1,437 n.d.r. n.d.r. n.d.r. n.d.r.<br />
Sri Lanka 635 3,325,964 35,892 7,241,738 3 380,000<br />
Syrian Arab Republic 145 329,091 363 5539676 22 1,300,007<br />
Taiwan (China) 3,189 531,221 1,519 2,981,258 630 2,307,523<br />
Tajikistan2 1,868 379,584 202 9,306,479 22 22,836<br />
Thailand 2,705 22,079,796 9,913 28,220,118 96 200,286<br />
Timor-Leste6 n.d.r. n.d.r. 5 13,685 n.d.r. n.d.r.
ANNEX 1<br />
186<br />
Total<br />
number<br />
<strong>of</strong> people<br />
reported<br />
killed<br />
(1990–1999)<br />
Total<br />
number<br />
<strong>of</strong> people<br />
reported<br />
affected<br />
(1990–1999)<br />
Total<br />
number<br />
<strong>of</strong> people<br />
reported<br />
killed<br />
(2000–2009)<br />
Total<br />
number<br />
<strong>of</strong> people<br />
reported<br />
affected<br />
(2000–2009)<br />
Total<br />
number<br />
<strong>of</strong> people<br />
reported<br />
killed<br />
(2009)<br />
Total<br />
number<br />
<strong>of</strong> people<br />
reported<br />
affected<br />
(2009)<br />
Turkmenistan 2 40 420 11 n.a. n.d.r. n.d.r.<br />
United Arab Emirates 97 101 97 46 n.d.r. n.d.r.<br />
Uzbekistan 2 141 74,388 60 1,205,030 n.d.r. n.d.r.<br />
Viet Nam 8,603 20,247,866 4,015 20,918,620 410 3,717,512<br />
Yemen 7 962 357,871 971 31,609 158 n.a.<br />
Europe 35,503 52,351,392 91,054 10,144,275 1,319 145,660<br />
Albania 75 48,600 68 616,584 n.a. 11,150<br />
Austria 124 10,212 553 61,733 3 n.a.<br />
Azores (P) 74 1,215 n.d.r. n.d.r. n.d.r. n.d.r.<br />
Belarus 2 61 63,468 36 1,851 n.d.r. n.d.r.<br />
Belgium 99 3,040 2,161 2,779 1 n.a.<br />
Bosnia and<br />
Herzegovina8 12 1,090 66 366,819 1 13,730<br />
Bulgaria 31 6,792 118 14,062 17 19<br />
Canary Islands (SP) n.a. n.a. 168 1,280 22 6<br />
Croatia8 96 2,025 873 2,306 n.d.r. n.d.r.<br />
Cyprus 54 2,657 40 448 n.d.r. n.d.r.<br />
Czech Republic9 54 102,171 511 218,915 15 14,462<br />
Czechoslovakia9 41 n.a. n.d.r. n.d.r. n.d.r. n.d.r.<br />
Denmark 8 100 6 2,072 n.d.r. n.d.r.<br />
Estonia2 912 140 25 130 n.d.r. n.d.r.<br />
Finland 11 33 24 415 n.d.r. n.d.r.<br />
France 770 3,530,410 21,353 80,017 18 200<br />
Germany10 392 237,574 9,643 333,212 9 n.a.<br />
Gibraltar (UK) n.d.r. n.d.r. n.d.r. n.d.r. n.d.r. n.d.r.<br />
Greece 430 152,195 551 24,405 12 1,040<br />
Hungary 106 133,774 757 46,660 n.d.r. n.d.r.<br />
Iceland 34 83 n.a. 199 n.d.r. n.d.r.<br />
Ireland 46 4,200 1 500 n.a. n.a.<br />
Isle <strong>of</strong> Man (UK) n.d.r. n.d.r. n.d.r. n.d.r. n.d.r. n.d.r.<br />
Italy 852 74,270 21,017 129,377 364 61,147<br />
Latvia2 6 n.a. 76 n.a. n.d.r. n.d.r.<br />
Lithuania2 50 780,000 45 n.a. n.d.r. n.d.r.<br />
Luxembourg n.a. n.a. 190 n.a. n.d.r. n.d.r.<br />
Macedonia, FYR8 198 11,515 59 1,110,149 15 38<br />
Malta 295 n.a. 112 31 n.d.r. n.d.r.<br />
Moldova2 59 54,537 19 2,821,394 n.d.r. n.d.r.<br />
Montenegro11 n.d.r. n.d.r. n.a. 1,536 n.a. 450<br />
Netherlands 204 265,170 2,021 3,196 n.d.r. n.d.r.<br />
Norway 411 4,000 37 2,242 n.d.r. n.d.r.<br />
Poland 462 226,006 1,158 21,245 199 274
Total<br />
number<br />
<strong>of</strong> people<br />
reported<br />
killed<br />
(1990–1999)<br />
Total<br />
number<br />
<strong>of</strong> people<br />
reported<br />
affected<br />
(1990–1999)<br />
Total<br />
number<br />
<strong>of</strong> people<br />
reported<br />
killed<br />
(2000–2009)<br />
Total<br />
number<br />
<strong>of</strong> people<br />
reported<br />
affected<br />
(2000–2009)<br />
Total<br />
number<br />
<strong>of</strong> people<br />
reported<br />
killed<br />
(2009)<br />
<strong>World</strong> <strong>Disasters</strong> <strong>Report</strong> <strong>2010</strong> – Disaster data<br />
ANNEX 1<br />
187<br />
Total<br />
number<br />
<strong>of</strong> people<br />
reported<br />
affected<br />
(2009)<br />
Portugal 136 3,377 2,891 150,897 n.a. 0<br />
Romania 472 177,801 607 217,266 78 27<br />
Russian <strong>Federation</strong> 2 5,301 2,090,161 4,461 1,974,446 363 85<br />
Serbia 11 n.d.r. n.d.r. n.a. 16,080 n.a. 3,710<br />
Serbia-Montenegro 8 11 115 77,103 77 49,182 n.d.r. n.d.r.<br />
Slovakia 9 67 48,015 67 10,787 32 20<br />
Slovenia 8 n.a. 700 309 1,655 n.d.r. n.d.r.<br />
Soviet Union 2 784 346,384<br />
Spain 541 36,068,625 15,797 9,666 20 n.a.<br />
Sweden 79 184 8 n.a. n.d.r. n.d.r.<br />
Switzerland 119 5,211 1,125 7,400 n.a. n.a.<br />
Turkey 20,958 5,286,686 1,864 773,348 81 35,137<br />
Ukraine2 364 2,060,758 1,713 661,098 45 38<br />
United Kingdom 423 470,990 447 408,893 24 4,127<br />
Yugoslavia8 177 120<br />
Oceania 3,562 39,073,198 1,665 657,658 893 76,966<br />
American Samoa (USA) n.d.r. n.d.r. 40 25,563 34 2,500<br />
Australia 320 36,649,932 831 98,218 560 36,569<br />
Cook Islands (NZ) 20 900 n.a. 1,352 n.d.r. n.d.r.<br />
Fiji 76 436,730 70 51,362 14 14,401<br />
French Polynesia (F) 13 511 20 n.a. n.d.r. n.d.r.<br />
Guam (USA) 229 12,033 5 15,644 n.d.r. n.d.r.<br />
Kiribati n.a. 84,000 n.a. 85 n.d.r. n.d.r.<br />
Marshall Islands n.a. 6,000 n.a. 600 n.d.r. n.d.r.<br />
Micronesia Federated<br />
States<br />
n.a. 28,800 48 8,631 n.d.r. n.d.r.<br />
Nauru n.d.r. n.d.r. n.d.r. n.d.r. n.d.r. n.d.r.<br />
New Caledonia (F) n.a. n.a. 2 1,100 n.d.r. n.d.r.<br />
New Zealand 4 3,365 24 7,650 n.d.r. n.d.r.<br />
Niue (NZ) n.a. 200 1 702 n.d.r. n.d.r.<br />
Northern Mariana Is n.d.r. n.d.r. n.a. 300 n.d.r. n.d.r.<br />
Palau 1 12,004 n.d.r. n.d.r. n.d.r. n.d.r.<br />
Papua New Guinea 2,685 1,426,506 287 325,198 32 n.a.<br />
Samoa 21 283,000 158 5,585 148 5,585<br />
Solomon Islands 37 88,904 73 10,919 21 7,000<br />
Tokelau (NZ) n.a. 102 0 26 n.d.r. n.d.r.<br />
Tonga 1 9,674 84 17,061 84 561<br />
Tuvalu n.a. 850 18 n.a. n.d.r. n.d.r.<br />
Vanuatu 150 29,667 4 87,662 n.a. 10,350<br />
Wallis and Futuna (F) 5 20 n.d.r. n.d.r. n.d.r. n.d.r.<br />
<strong>World</strong> 901,020 2,218,390,749 1,105,352 2,550,272,267 17,258 142,259,892
Note: ’n.a.’ denotes ’no data available’; ’n.d.r.’ signifies<br />
’no disaster reported’. For more information, see section<br />
on caveats in introductory text.<br />
ANNEX 1<br />
1 Prior to 1993, Ethiopia was considered one country, after<br />
this date it was separated into Eritrea and Ethiopia.<br />
2 Prior to 1991 the Soviet Union was considered one<br />
country, after this date it became separate countries.<br />
The western former republics <strong>of</strong> the USSR (Belarus,<br />
Estonia, Latvia, Lithuania, Moldova, Russian <strong>Federation</strong>,<br />
Ukraine) are included in Europe; the southern former<br />
republics (Armenia, Azerbaijan, Georgia, Kazakhstan,<br />
Kyrgyzstan, Tajikistan, Turkmenistan, Uzbekistan) are<br />
included in Asia.<br />
3 Hong Kong became part <strong>of</strong> China in July 1997; Macau<br />
became part <strong>of</strong> China in December 1999.<br />
4 The estimates provided are disputed. See the caveats in<br />
the introductory pages <strong>of</strong> the statistical data for further<br />
information.<br />
5 Since September 1993 and the Israel-PLO Declaration<br />
<strong>of</strong> Principles, the Gaza Strip and the West Bank have<br />
a Palestinian self-government. Direct negotiations to<br />
determine the permanent status <strong>of</strong> these territories<br />
began in September 1999 but are far from a permanent<br />
agreement.<br />
6 Since May 2002, East Timor has been an independent<br />
country: Timor-Leste.<br />
7 Prior to May 1990, Yemen was divided into Arab<br />
and People’s Democratic Republics; after this date it<br />
is considered one country.<br />
8 Prior to 1992 Yugoslavia was considered one country,<br />
after this date it became separate countries: Bosnia and<br />
Herzegovina, Croatia, Serbia, Slovenia, Former Yugoslav<br />
Republic <strong>of</strong> Macedonia.<br />
188<br />
9 Prior to 1993, Czechoslovakia was considered one<br />
country, after this date it was divided into separate<br />
countries: Czech Republic and Slovakia.<br />
10 Prior to October 1990, Germany was divided into the<br />
Federal and Democratic Republics. After this date it was<br />
considered as one country.<br />
11 Between 1992 and 2006, Serbia and Montenegro<br />
were considered one country. In 2006 they became<br />
two independent countries.<br />
Over the last decade, the highest numbers <strong>of</strong> deaths<br />
per continent were reported in Nigeria (Africa), Haiti<br />
(Americas), the Democratic People’s Republic <strong>of</strong> Korea<br />
(Asia) (see note 4 above), France (Europe) and Australia<br />
(Oceania).<br />
The highest numbers <strong>of</strong> people affected by disaster, by<br />
continent, were reported in Kenya (Africa), United States<br />
<strong>of</strong> America (Americas), People’s Republic <strong>of</strong> China (Asia),<br />
Moldova (Europe) and Papua New Guinea (Oceania).<br />
Compared to 1990–1999, the past decade has seen<br />
disaster deaths rise by 23 per cent and the numbers<br />
affected by disasters rise by 15 per cent.<br />
The number <strong>of</strong> deaths has risen by 68 per cent in Africa,<br />
23 per cent in Asia and 156 per cent in Europe. It has<br />
decreased by 58 per cent in Americas and by 53 per cent<br />
in Oceania.<br />
The number <strong>of</strong> people affected by disasters has risen<br />
<strong>of</strong> 70 per cent in Africa, 39 per cent in Americas and<br />
14 per cent in Asia. It has decreased by 81 per cent in<br />
Europe and by 98 per cent in Oceania.
<strong>World</strong> <strong>Disasters</strong> <strong>Report</strong> <strong>2010</strong> – Disaster data<br />
ANNEX 1<br />
189
ANNEX 2<br />
190
Making cities resilient:<br />
A ten-point checklist for<br />
local governments<br />
Cities and local governments need to get ready, reduce the risks and become resilient<br />
to disasters. For the next two years and beyond, the United Nations <strong>International</strong><br />
Strategy for Disaster <strong>Red</strong>uction (UNISDR) will campaign together with its partners<br />
for this to happen.<br />
Making cities resilient, the <strong>2010</strong>–2011 <strong>World</strong> Disaster <strong>Red</strong>uction campaign, addresses<br />
issues <strong>of</strong> local governance and urban risk while drawing upon previous UNISDR<br />
campaigns for safer schools and hospitals, as well as on the sustainable urbanizations<br />
principles developed in the United Nations Human Settlements Programme (UN-<br />
Habitat) <strong>World</strong> Urban Campaign 2009–2013.<br />
Overall, the campaign seeks to raise awareness and effect change by urging local<br />
governments to take immediate action and to build multi-stakeholder partnerships to<br />
achieve the implementation <strong>of</strong> the Hyogo Framework for Action at the local level. The<br />
following ten-point checklist <strong>of</strong> ‘essentials’ for making cities resilient, which builds on<br />
the priorities identified in Hyogo Framework for Action 2005–2015: Building the resilience<br />
<strong>of</strong> nations and communities to disasters (available online: www.unisdr.org / hfa), will<br />
serve as a guide for commitment during the campaign.<br />
Ten essentials for making cities resilient<br />
1. Put in place organization and coordination to understand and reduce disaster<br />
risk, based on participation <strong>of</strong> citizen groups and civil society. Build local alliances.<br />
Ensure that all departments understand their role in disaster risk reduction<br />
and preparedness.<br />
2. Assign a budget for disaster risk reduction and provide incentives for homeowners,<br />
low-income families, communities, businesses and the public sector to<br />
invest in reducing the risks they face.<br />
3. Maintain up-to-date data on hazards and vulnerabilities, prepare risk assessments<br />
and use these as the basis for urban development plans and decisions.<br />
Ensure that this information and the plans for your city’s resilience are readily<br />
available to the public and fully discussed with them.<br />
<strong>World</strong> <strong>Disasters</strong> <strong>Report</strong> <strong>2010</strong> – Disaster data<br />
Photo opposite page:<br />
Cities need to be<br />
able to respond to<br />
the needs <strong>of</strong> both<br />
inhabitants and<br />
visitors. Not an<br />
easy task in cities<br />
attracting large<br />
numbers <strong>of</strong> visitors,<br />
such as Mecca,<br />
which is visited by<br />
millions <strong>of</strong> people<br />
during the annual<br />
Hajj pilgrimage,<br />
the world’s largest<br />
gathering.<br />
© Saudi Arabian <strong>Red</strong><br />
Crescent Society<br />
191
ANNEX 2<br />
192<br />
4. Invest in and maintain critical infrastructure that reduces risk, such as flood<br />
drainage, adjusted where needed to cope with climate change.<br />
5. Assess the safety <strong>of</strong> all schools and health facilities and upgrade these as necessary.<br />
6. Apply and enforce realistic, risk-compliant building regulations and landuse<br />
planning principles. Identify safe land for low-income citizens and develop<br />
upgrading <strong>of</strong> informal settlements, wherever feasible.<br />
7. Ensure education programmes and training on disaster risk reduction are in<br />
place in schools and local communities.<br />
8. Protect ecosystems and natural buffers to mitigate floods, storm surges and<br />
other hazards to which your city may be vulnerable. Adapt to climate change by<br />
building on good risk reduction practices.<br />
9. Install early warning systems and emergency management capacities in your<br />
city and hold regular public preparedness drills.<br />
10. After any disaster, ensure that the needs <strong>of</strong> the survivors are placed at the centre<br />
<strong>of</strong> reconstruction with support for them and their community organizations to<br />
design and help implement responses, including rebuilding homes and livelihoods.<br />
Case studies<br />
The selected case studies illustrate how resilience can be put into practice by focusing<br />
on the ten essentials for making cities resilient. These case studies cover a number <strong>of</strong><br />
different areas, ranging from risk assessment to risk communication, as well as different<br />
government levels and types <strong>of</strong> hazard.<br />
Essential 1<br />
Empowering local government as leaders in disaster reduction<br />
and recovery<br />
Municipal governments <strong>of</strong> Chincha, Pisco, Cañete and Ica, Peru<br />
(From UNISDR, Local Governments and Disaster Risk <strong>Red</strong>uction – Good practices and<br />
lessons learned, Geneva, April <strong>2010</strong>.)<br />
After the 2007 earthquake in Peru, reconstruction and recovery in the affected regions<br />
were typically fragmented and not well integrated into overall development and risk<br />
reduction work. Local government institutions, which were themselves affected by<br />
the quake, were cast into a passive role. A United Nations Development Programme<br />
(UNDP) project partnered with municipal governments to help them enhance their<br />
roles as leaders and coordinators <strong>of</strong> local development and recovery.
The UNDP Country Office intervention provided technical disaster risk reduction<br />
and recovery assistance to municipal governments. Although the project is a UNDP<br />
initiative, it relied on the unique position <strong>of</strong> local governments to identify local priorities<br />
to reduce disaster risk. The municipal governments prioritized four areas, to which<br />
UNDP provided close and permanent guidance: local governance; housing and territorial<br />
management; economic reactivation; and information management.<br />
Results include the initiation <strong>of</strong> a process for updating and redesigning the municipalities’<br />
development plans (ten years) and annual plans for promoting sustained recovery<br />
and risk reduction as well as the inclusion <strong>of</strong> development and capacity-building<br />
issues into the reconstruction, such as livelihoods, gender, information management<br />
and institutional strengthening. Furthermore, the municipal governments’ regular<br />
tools and methods, such as their public investments system and information systems<br />
for monitoring and disseminating information, were improved. Land-use plans were<br />
revised and made risk-sensitive. The comprehensive range <strong>of</strong> results has been an indication<br />
<strong>of</strong> what can be achieved by local governments with the right support.<br />
Essential 2<br />
Changing standards for land-for-housing in Namibia<br />
Windhoek, Namibia<br />
(From <strong>International</strong> Institute for Environment and Development (IIED), Urban<br />
Development and Intensive and Extensive Risk, Contribution to the Global Assessment<br />
<strong>Report</strong> on Disaster Risk <strong>Red</strong>uction, 2009.)<br />
The city authorities in Windhoek recognized that to reach low-income households,<br />
they had to cut unit costs in their government-funded serviced-site programme. This<br />
programme had to recover the costs <strong>of</strong> developing land (both for housing and with<br />
infrastructure to <strong>of</strong>ficial standards), but this made it too expensive for low-income<br />
groups. This example from Namibia is interesting in that it shows how a change in<br />
approach by the city government greatly increased the possibilities for low-income<br />
households to be able to get their own housing.<br />
A new government policy, developed with the Shack Dwellers <strong>Federation</strong> <strong>of</strong> Namibia<br />
(a federation <strong>of</strong> savings groups formed mostly by low-income women), showed a<br />
willingness to overturn conventional approaches to standards and regulations, for<br />
instance in plot sizes and in infrastructure standards, to make their serviced sites more<br />
affordable to low-income households. Plots can be rented, group purchased or leased.<br />
Significantly, families are allowed to upgrade services as they can afford to make the<br />
investments, extending sewerage and water lines from mains provision into their<br />
homes. Groups that belong to the Shack Dwellers <strong>Federation</strong> have access to their own<br />
loan fund from which they can borrow for such service improvements, and around<br />
1,000 groups have taken such loans at an average household cost <strong>of</strong> US$ 150. However,<br />
this underestimates the number <strong>of</strong> improvements, because once households have<br />
<strong>World</strong> <strong>Disasters</strong> <strong>Report</strong> <strong>2010</strong> – Disaster data<br />
193
ANNEX 2<br />
194<br />
a system they can respond to, many can afford to make the improvements using their<br />
own resources without the need to use loan finance.<br />
Essential 3<br />
Hazard identification and risk assessment at the provincial level<br />
Ontario, Canada<br />
(From UNISDR, Local Governments and Disaster Risk <strong>Red</strong>uction – Good practices and<br />
lessons learned, Geneva, April <strong>2010</strong>.)<br />
Ontario passed its provincial Emergency Management and Civil Protection Act in<br />
2003. The act required all provincial ministries and municipal governments to identify<br />
and rank all known and suspected emerging hazards and risks to community safety. This<br />
included carrying out a Hazard Identification and Risk Assessment (HIRA) process to<br />
assess risk, identify vulnerabilities and plan for comprehensive disaster risk reduction.<br />
The Ontario provincial government tasked Emergency Management Ontario with the<br />
implementation <strong>of</strong> the province-wide HIRA report and methodology, on which the<br />
ministry and municipal assessments would be based.<br />
Emergency Management Ontario produced an initial HIRA in 2003 which identified<br />
37 main risks for the province. All provincial government ministries are now working<br />
on assessments based on this. A specialist <strong>of</strong>ficer in Emergency Management Ontario<br />
is currently reviewing the 37 hazards, identifying emerging hazards and developing a<br />
methodology to make the HIRA process even more effective and accurate. Emergency<br />
Management Ontario continues to provide comprehensive guidelines and technical<br />
support for this risk assessment process.<br />
As a result, the provincial HIRA has improved the Ontario government’s ability to<br />
anticipate and mitigate the potential effects <strong>of</strong> hazards, throughout all ministry sectors.<br />
It is already helping to guide the creation <strong>of</strong> effective exercises, public awareness campaigns<br />
and training programmes focused on the most likely and dangerous hazards.<br />
This will improve disaster prevention, preparedness, mitigation, response and recovery.<br />
Essential 4<br />
A city government in a highly vulnerable flood-prone area<br />
develops a climate change plan with comprehensive disaster<br />
management measures<br />
Pune, India<br />
(From UNISDR, Adaptation to climate change by reducing disaster risks: country practices<br />
and lessons, Briefing Note 2, Geneva, November 2009.)<br />
The city <strong>of</strong> Pune in Maharashtra State, India, has a population <strong>of</strong> nearly 5 million<br />
people and is located at the confluence <strong>of</strong> the Mutha, Mula and Pavana rivers. It has<br />
been affected by several severe floods over the last six decades, the most significant <strong>of</strong>
which was the 1961 flood that involved a major dam failure. Anticipating an increased<br />
frequency <strong>of</strong> floods due to climate change, a number <strong>of</strong> programmes have been put<br />
in place to build capacity, assess hazards and vulnerability, construct dams, dykes and<br />
seawalls, establish early warning systems, as well as projects concerning land-use planning,<br />
environmental protection and community education and resilience.<br />
A systematic city-wide plan <strong>of</strong> practical action to reduce flooding was implemented. A<br />
first step was to assess the flood risks by analysing hourly rainfall intensity and examining<br />
the likely changes in impacts in low-lying areas and places where natural drainage was<br />
blocked by the construction <strong>of</strong> houses or by roads without adequate bridges. A detailed<br />
city drainage map was developed. The plan introduced structural and planning measures<br />
for restoring natural drainage, widening streams, extending bridges and applying natural<br />
soil infiltration methodologies. Watershed conservation techniques, such as afforestation<br />
and building small earthen check dams, were undertaken in the hill zone. Property tax<br />
incentives were provided to encourage households to recycle wastewater or use rainwater<br />
harvesting by storing run-<strong>of</strong>f from their ro<strong>of</strong>s for domestic use. These efforts were complemented<br />
by improvements in flood monitoring and warning systems and social protection<br />
for affected families. The initiative was driven jointly by the elected municipal<br />
government, the municipal commissioner and Alert (active citizen groups), and involves<br />
many different city departments. It demonstrates that local governments can prepare for<br />
climate change by reducing and managing the local factors that lead to disasters.<br />
Essential 5<br />
Making all healthcare facilities safer<br />
Cayman Islands<br />
(From UNISDR, 2008–2009 <strong>World</strong> Disaster <strong>Red</strong>uction Campaign – Hospitals Safe from<br />
<strong>Disasters</strong>, Geneva, January 2008.)<br />
The Cayman Islands, which is made up <strong>of</strong> three islands, has experienced the largest<br />
number <strong>of</strong> hurricane strikes in the Atlantic basin. In September 2004, the biggest<br />
island, Grand Cayman, was hit by Hurricane Ivan, the islands’ worst hurricane<br />
in 86 years. Ivan destroyed or damaged 90 per cent <strong>of</strong> buildings. Power, water and<br />
communications were disrupted for months in some areas. But the island began a<br />
major rebuilding process, including in the health sector.<br />
The Cayman Islands adopted a National Strategic Framework for Disaster Risk <strong>Red</strong>uction.<br />
Within this framework, the Health Services Authority, as the islands’ primary<br />
provider <strong>of</strong> healthcare, implemented several activities to make all its facilities safer.<br />
These activities address structural, non-structural, functional and workforce issues.<br />
For instance, at the structural level, the 124-bed Cayman Islands Hospital (the territory’s<br />
principal healthcare facility) was built to Category 5 hurricane standards. Older<br />
facilities were upgraded to new local and international building codes and protocols<br />
for healthcare facilities, and seismic risk reduction elements were introduced in the<br />
<strong>World</strong> <strong>Disasters</strong> <strong>Report</strong> <strong>2010</strong> – Disaster data<br />
195
ANNEX 2<br />
196<br />
design <strong>of</strong> health facilities. The anticipated damage and recovery time was reduced and<br />
the continuity <strong>of</strong> operations improved. The Cayman Islands Hospital, for instance,<br />
remained functional during and after Hurricane Ivan in 2004 while providing an<br />
impromptu shelter to more than 1,000 people.<br />
Essential 6<br />
National policy with national government, local government<br />
and community funding<br />
Thailand<br />
(From IIED, Urban Development and Intensive and Extensive Risk, Contribution to the<br />
Global Assessment <strong>Report</strong> on Disaster Risk <strong>Red</strong>uction, 2009.)<br />
The Thai government is implementing one <strong>of</strong> the most ambitious ‘slum’ and squatter<br />
upgrading initiatives currently under way. Managed by the government’s Community<br />
Organizations Development Institute (CODI), the Baan Mankong (secure housing)<br />
programme channels funds in the form <strong>of</strong> infrastructure subsidies and housing loans<br />
direct to community organizations formed by low-income inhabitants in informal settlements.<br />
It is also significant in that it draws almost entirely from domestic resources – a<br />
combination <strong>of</strong> national government, local government and community contributions.<br />
Each community organization develops the solution that works best for them in regard<br />
to land. Within this national programme, there are a variety <strong>of</strong> means by which those<br />
in illegal settlements can get legal land tenure, for instance, by the inhabitants purchasing<br />
the land from the landowner (supported by a government loan), negotiating<br />
a community lease, agreeing to move to another location provided by the government<br />
agency on whose land they are squatting, or agreeing with the landowner to move to<br />
part <strong>of</strong> the site they are occupying in return for tenure <strong>of</strong> that site (land sharing).<br />
CODI also provides loans to community organizations to ‘on-lend’ to their members<br />
to help build or improve their homes. It also supports city governments in taking the<br />
initiative to collaborate with urban poor organizations, for instance, providing a site<br />
on which those living in various ‘mini’ squatter settlements in their jurisdiction could<br />
relocate, with the land provided on a 30-year lease.<br />
Essential 7<br />
Watch and learn: Children and communities study mountain<br />
and urban risks<br />
Saijo City, Japan<br />
(From UNISDR, Local Governments and Disaster Risk <strong>Red</strong>uction – Good practices and<br />
lessons learned, Geneva, April <strong>2010</strong>.)<br />
In 2004, Saijo City in Shikoku island’s Ehime Prefecture was hit by record typhoons<br />
that led to flooding in its urban areas and landslides in the mountains. A small city
with semi-rural mountainous areas, Saijo City faces unique challenges in disaster risk<br />
reduction. First, Japan’s ageing population represents a particular problem. Young ablebodied<br />
people are very important to community systems <strong>of</strong> mutual aid and emergency<br />
preparedness. And as young people tend to move away to bigger cities, smaller towns in<br />
Japan have an even older population than the already imbalanced national average. Second,<br />
smaller cities like Saijo City are <strong>of</strong>ten spread over a mix <strong>of</strong> geographic terrains – an<br />
urban plain, semi-rural and isolated villages on hills and mountains, and a coastal area.<br />
To meet these challenges, the Saijo City government instigated in 2005 a risk-awareness<br />
programme targeting schoolchildren. Focusing on the city’s various physical environments,<br />
the ‘mountain-watching’ and ‘town-watching’ project takes 12-year-olds, accompanied<br />
by teachers, local residents, forest workers and municipal <strong>of</strong>ficials, on risk education<br />
field trips. The young urban dwellers meet with the elderly in the mountains to<br />
learn together about the risks Saijo City faces and to remember the lessons learned <strong>of</strong><br />
the 2004 typhoons. Meanwhile, a ‘mountain- and town-watching’ handbook has been<br />
developed, and a teachers’ association for disaster education, a children’s disaster prevention<br />
club and a disaster prevention forum, also for children, have been set up. The initiative<br />
serves as an excellent example <strong>of</strong> a local government leading a multi-stakeholder and<br />
community-based disaster risk awareness initiative that then becomes self-sustaining.<br />
Essential 8<br />
A rapidly growing municipality addresses the increasing risk<br />
<strong>of</strong> droughts by implementing a water resource management<br />
programme<br />
Overstrand, South Africa<br />
(From UNISDR, Local Governments and Disaster Risk <strong>Red</strong>uction – Good practices and<br />
lessons learned, Geneva, April <strong>2010</strong>.)<br />
The Overstrand municipality, located along the coast <strong>of</strong> Western Cape Province in<br />
South Africa, has been faced with rapid and seasonal population growth and projected<br />
shortages <strong>of</strong> water supply in the district <strong>of</strong> Hermanus. In addition, there has been a<br />
decline in rainfall since 1997 and climate change threatens to bring more variable<br />
rainfall and more extreme temperatures to the Western Cape region. In response, the<br />
municipality adopted a comprehensive water resource management and development<br />
programme, which draws on the national policy and legislative platform developed by<br />
the South African National Department <strong>of</strong> Water Affairs and Forestry.<br />
The municipality strived to implement a longer-term, multi-stakeholder programme<br />
with growing public recognition <strong>of</strong> drought risk. The programme employed two<br />
main strategies: better water demand management and finding additional, sustainable<br />
sources <strong>of</strong> water. The municipality conducted comprehensive water demand management<br />
measures including clearing invasive alien plants, a public awareness campaign<br />
and a programme <strong>of</strong> leak detection and repair.<br />
<strong>World</strong> <strong>Disasters</strong> <strong>Report</strong> <strong>2010</strong> – Disaster data<br />
197
ANNEX 2<br />
198<br />
In order to find local water sources, groundwater drilling was initiated after careful<br />
analysis <strong>of</strong> various options. The permanent coordinating role <strong>of</strong> the local government<br />
was vital in conducting such a long-term, multi-stakeholder programme involving<br />
national and provincial water agencies, a regional biodiversity conservation institute<br />
and a group <strong>of</strong> community-based organizations. Uncertainty and scepticism among<br />
stakeholders regarding extracting groundwater was overcome by establishing a participatory<br />
monitoring committee and preparing relevant sets <strong>of</strong> baseline data.<br />
Essential 9<br />
Many partners, one system: An integrated flood early<br />
warning system for Jakarta<br />
Jakarta, Indonesia<br />
(From UNISDR, Local Governments and Disaster Risk <strong>Red</strong>uction – Good practices and<br />
lessons learned, Geneva, April <strong>2010</strong>.)<br />
Jakarta, the capital <strong>of</strong> Indonesia, has a high flood risk – it is a coastal city and is the exit<br />
point <strong>of</strong> 13 rivers. Some 40 per cent <strong>of</strong> Jakarta lies below sea level and the provincial<br />
authority area includes 110 islands. Hydrometeorological hazards have inflicted much<br />
damage in coastal areas and on residential areas near the river banks. During the annual<br />
and five-yearly floods, Jakarta has lost billions <strong>of</strong> dollars’ worth <strong>of</strong> investment in building<br />
and infrastructure.<br />
Integrating improvements into the flood early warning system for Jakarta has been a<br />
true multi-stakeholder process, involving a huge range <strong>of</strong> local authorities and partners.<br />
By managing everyone’s interests and roles and improving coordination, the early<br />
warning system was upgraded from top to bottom. Technical improvements mean that<br />
earlier flood warnings are now possible. But more importantly, preparedness capacity<br />
has been built and streamlined. Key coordination hubs and standard operating procedures<br />
have been established and tested with comprehensive drills, so that institutions<br />
and communities are now more ready to act on warnings.<br />
Essential 10<br />
Institution building and capacity building for local<br />
governments<br />
Pakistan<br />
(From UNISDR, Local Governments and Disaster Risk <strong>Red</strong>uction – Good practices and<br />
lessons learned, Geneva, April <strong>2010</strong>.)<br />
The earthquake that struck the northern border area <strong>of</strong> Pakistan on 8 October 2005<br />
was the nation’s most devastating disaster ever. It claimed more than 73,000 lives,<br />
injured more than 128,000 people, rendered 2.8 million people homeless and affected<br />
3.5 million people in an area <strong>of</strong> 30,000 square kilometres. The response from the government,<br />
civil society and international donors was swift. The government established
a Federal Relief Commission and an Earthquake Rehabilitation and Reconstruction<br />
Authority (ERRA) to support medium- to long-term recovery and reconstruction<br />
efforts.<br />
Since its founding in October 2005, ERRA has integrated disaster risk reduction in all<br />
its reconstruction work and has initiated a disaster risk management programme for<br />
community preparedness in the affected districts. In its reconstruction work, ERRA<br />
has followed a disaster risk management approach <strong>of</strong> risk reduction, risk avoidance,<br />
risk transfer and risk management. ERRA has also worked on strengthening community-based<br />
disaster preparedness in line with the Hyogo Framework for Action. This<br />
authority has worked directly with local governments to build institutional and community<br />
preparedness through new union council disaster management committees<br />
and union council emergency response teams.<br />
Overall, this initiative has yielded concrete results such as a guidebook for mainstreaming<br />
disaster risk reduction into development, hazard indication maps for the districts<br />
<strong>of</strong> Mansehra and Muzaffarabad, and disaster management committees and emergency<br />
response teams being established in 112 union councils across the two districts.<br />
Michele Cocchiglia, programme <strong>of</strong>ficer with the UNISDR Secretariat, contributed this text.<br />
<strong>World</strong> <strong>Disasters</strong> <strong>Report</strong> <strong>2010</strong> – Disaster data<br />
199
INDEX<br />
200<br />
Index<br />
Aceh 35, 55, 62, 65, 71, 139, 148-149<br />
see also Indonesia<br />
acute respiratory infections 95<br />
Afghan Development Association 58<br />
Afghanistan 184<br />
Africa 11-12, 14, 17-19, 22, 28, 32-34,<br />
36-37, 41, 43-44, 47, 50-51, 58-60,<br />
69-70, 73, 75-77, 80-81, 87, 91, 97-99,<br />
102, 104, 118-119, 133, 135, 139, 141,<br />
147-148, 150, 153, 155-156, 160, 166-<br />
169, 174-176, 178, 180-183, 188, 197<br />
see also North Africa<br />
see also East Africa<br />
see also South Africa<br />
see also West Africa<br />
African Union 133<br />
aid agencies 18, 21, 23, 27, 55, 57, 148<br />
see also disaster relief agencies<br />
American <strong>Red</strong> <strong>Cross</strong> 139, 149, 153<br />
Americas 11, 97, 104-105, 111, 160,<br />
166-169, 174-176, 178, 180-181, 183,<br />
188<br />
see also Central America<br />
see also North America<br />
see also Latin America<br />
see also South America<br />
Amnesty <strong>International</strong> 84<br />
Andes 119, 135<br />
Angola 42, 59, 75, 182<br />
Argentina 42, 59, 64, 81, 122, 143, 146,<br />
148, 150, 183<br />
Asha 100-101, 110<br />
Asia 11-12, 17, 19, 22, 28, 31-33, 37,<br />
40-41, 47, 58, 60, 64, 69, 80, 97-99,<br />
103-104, 109, 119, 136-137, 139, 147-<br />
148, 155, 160, 166-169, 174-176, 178,<br />
180-181, 184, 188<br />
see also South Asia<br />
see also South-East Asia<br />
Asian Cities Climate Change Resilience<br />
Network 129, 131, 136<br />
Asian Coalition for Housing Rights 26,<br />
28, 54, 68-69<br />
Asian Development Bank 103<br />
Asian Disaster <strong>Red</strong>uction Center<br />
(ADRC) 162<br />
assets 19-22, 25, 34, 38, 40, 47, 49, 54,<br />
61-62, 122, 137<br />
Australia 96, 115, 118, 187-188<br />
Baan Mankong 67, 69, 154, 196<br />
see also Community Organizations<br />
Development Institute (CODI)<br />
see also Thailand<br />
Bam 13, 35, 167<br />
see also Iran<br />
Banda Aceh 35, 55, 62, 71, 149<br />
see also Indonesia<br />
Bangkok 28, 69, 71, 104<br />
see also Thailand<br />
Bangladesh 22, 36, 38, 40-42, 51, 80,<br />
93, 98, 160, 184<br />
Beeckman, Katrien 88<br />
Beijing 32, 106-107<br />
see also China<br />
Benazir Bhutto Income Support<br />
Programme 88
Benin 96, 119, 136, 182<br />
Bogotá 86, 110<br />
see also Colombia<br />
Bolivia 59, 81, 183<br />
Bolsa Familia 88<br />
Brazil 59, 64, 75, 80-81, 86, 88-90, 93,<br />
95, 98, 104, 135, 156, 183<br />
Brazilian <strong>Red</strong> <strong>Cross</strong> 87<br />
Buenos Aires 122, 146, 154<br />
see also Argentina<br />
Bureau <strong>of</strong> Alcohol, Tobacco, Firearms<br />
and Explosives 75<br />
see also United States <strong>of</strong> America<br />
Burkina Faso 99, 118, 182<br />
Burundi 160, 182<br />
C40 Climate Leadership Group 124<br />
Calí 42, 51<br />
see also Colombia<br />
Cambodia 59, 70, 80, 160, 185<br />
Cameroon 42, 96, 99, 182<br />
Canada 86, 90, 101, 103, 118, 183, 194<br />
Canadian <strong>Red</strong> <strong>Cross</strong> 87, 89-90<br />
cancer(s) 95, 97, 104-106<br />
Cape Town 18, 43-45, 50-51<br />
see also South Africa<br />
Caracas 143, 150, 154-155<br />
see also Venezuela<br />
Cardoso, Fernando Henrique 89<br />
CARE 58, 69<br />
Caribbean 12, 22, 37, 73, 75-76, 80, 82,<br />
87, 89, 93, 98-99, 105, 111<br />
Catholic Relief Services 99<br />
Cayman Islands 183, 195-196<br />
Central America 75-76, 87, 93, 145,<br />
155<br />
see also Americas<br />
central government(s) 23, 110<br />
see also local government(s)<br />
Centre for Health Development 95<br />
see also <strong>World</strong> Health Organization<br />
(WHO)<br />
Centre for Research on the<br />
Epidemiology <strong>of</strong> <strong>Disasters</strong> (CRED)<br />
34-36, 49-50, 154, 159-169, 171-174,<br />
176, 178, 180<br />
see also EM-DAT database<br />
Chandy, Thomas 100<br />
Chartered Society <strong>of</strong> Physiotherapy 95,<br />
111<br />
children 24, 37, 50-51, 56, 65, 76-77,<br />
79, 82-84, 87-88, 90, 92, 96-102, 105,<br />
112, 121-122, 135, 196-197<br />
see also street children<br />
Chile 11, 81, 183<br />
China 22, 35, 40-42, 97, 103, 106, 110,<br />
126, 139, 160, 167-168, 185, 188<br />
Chittagong 41-42<br />
see also Bangladesh<br />
Cities for Climate Protection 124<br />
Cities in Climate Change Initiative 129,<br />
137<br />
see also United Nations Human<br />
Settlements Programme<br />
(UN-Habitat)<br />
civil society 21, 86, 92, 109, 125, 133,<br />
139, 144, 147-150, 153, 191, 198<br />
<strong>World</strong> <strong>Disasters</strong> <strong>Report</strong> <strong>2010</strong> – Index<br />
201
INDEX<br />
202<br />
climate change 7-8, 12, 16, 26-28, 40,<br />
48, 50, 59, 69, 115-125, 127-137, 141-<br />
142, 147, 155-157, 192, 194-195, 197<br />
see also greenhouse gas emissions<br />
Colombia 42, 51, 75, 78, 80-81, 86, 89,<br />
91, 93, 145, 150, 156-157, 183<br />
Comayaguela 143<br />
see also Honduras<br />
Committee to Protect Journalists 77, 91<br />
community associations 56<br />
see also savings groups<br />
community-based initiatives 61, 110<br />
Community Organizations<br />
Development Institute (CODI) 67, 196<br />
see also Thailand<br />
Conakry 41-42<br />
see also Guinea<br />
Cork 124, 126, 128<br />
see also Ireland<br />
corruption 74, 77, 82, 88<br />
Costa Rica 42, 80-81, 183<br />
Côte d’Ivoire 99, 182<br />
Cotonou 119, 136<br />
see also Benin<br />
crime 7, 11, 19, 37, 73-75, 77-80, 82,<br />
84-93, 108<br />
see also urban violence<br />
see also violence<br />
Crisis States Research Centre 73, 89-90,<br />
92<br />
see also London School<br />
<strong>of</strong> Economics and Political Science<br />
Cyclone Nargis 35-36, 160, 167<br />
cyclone(s) 3, 11-13, 22, 34-36, 54, 117,<br />
160, 167<br />
Dar es Salaam 119<br />
see also Tanzania<br />
Democratic Republic <strong>of</strong> the Congo 37,<br />
96, 102<br />
dengue 103-104<br />
depression 95, 108, 112<br />
DesInventar database 38, 42<br />
developed countries 88, 97-98, 105-106,<br />
110, 173, 181<br />
developers 25, 46, 53, 127<br />
developing countries 73, 79, 91, 96, 98,<br />
101, 106, 108-109, 115, 173, 181<br />
Development Assistance Committee<br />
(DAC) 92<br />
see also Organisation for Economic<br />
Co-operation and Development<br />
(OECD)<br />
Dhaka 36, 41-42, 50-51, 80, 93, 119<br />
see also Bangladesh<br />
diabetes 95, 97-98, 104<br />
diarrhoea 95-97, 101, 121-122<br />
disability adjusted life years (DALYs) 97<br />
disaster impacts 11, 16, 20, 22, 48<br />
disaster management 29, 50, 141-142,<br />
148-150, 152-154, 194, 199<br />
disaster preparedness 11, 21, 59, 129,<br />
141, 144, 146, 149, 161, 164, 199<br />
disaster relief agencies 26, 53<br />
see also aid agencies<br />
disaster risk reduction 14, 16, 20-21,<br />
26-29, 36, 49, 51, 56, 63-64, 68, 107,<br />
115-116, 123, 125, 127, 129, 131, 133,<br />
139-154, 157, 191-199
disasters 7-8, 11-16, 18, 20-22, 26-29,<br />
31, 34-38, 40-41, 43-45, 47-51, 53-58,<br />
60, 62-63, 65-66, 69-71, 87, 96, 106,<br />
110, 115, 118, 121, 125, 127-128, 133-<br />
134, 137, 139-145, 147-151, 154-155,<br />
159-176, 178-182, 188, 191, 195<br />
disease 7, 15, 21, 31, 95, 97-99, 101-<br />
106, 108, 110, 113, 120-122, 127, 130<br />
see also infectious disease(s)<br />
see also non-communicable disease(s)<br />
Djibouti 160, 182<br />
Dominican Republic 80-81, 87, 150,<br />
183<br />
donors 11, 56, 165, 198<br />
drought(s) 36-37, 56, 98, 115, 117,<br />
129, 160, 162-163, 170-181, 197<br />
drug trafficking 74-75, 89, 92<br />
Durban 29, 140-141, 153, 156<br />
see also South Africa<br />
dysentery 95, 100<br />
early warning system(s) 118, 130, 141,<br />
150-151, 192, 195, 198<br />
earthquakes 11-12, 21, 34-36, 39,<br />
45-46, 48, 56, 69, 139-140, 142, 145,<br />
147, 153-154, 162-163, 167, 170-181<br />
East Africa 22, 73<br />
see also Africa<br />
economic loss(es) 34, 40<br />
economic violence 74<br />
see also violence<br />
Ecuador 80-81, 157, 183<br />
education 16, 38, 47, 73, 79, 81-83,<br />
85-86, 88, 98, 120, 130-131, 140-141,<br />
143, 146, 192, 195, 197<br />
Egypt 59, 99, 103, 105, 119, 136, 150,<br />
182<br />
El Niño 147<br />
El Salvador 76, 81, 147, 152, 155, 184<br />
EM-DAT database 28, 34-35, 50, 161-<br />
163, 165-169, 171-174, 176, 178, 180<br />
see also Centre for Research on the<br />
Epidemiology <strong>of</strong> <strong>Disasters</strong> (CRED)<br />
emergency management 192, 194<br />
emergency response 12, 21, 144-145,<br />
152, 199<br />
employment 7, 22, 24, 81-82, 95, 127<br />
Enda-Tiers Monde 120, 134<br />
see also Senegal<br />
Environmental Protection Agency 125<br />
see also Ireland<br />
epidemics 21, 37, 99, 101, 103-104,<br />
162-163, 166<br />
Ethiopia 160, 188<br />
Europe 12, 19, 34, 75, 101, 105, 115,<br />
166-169, 174-176, 178, 180-181, 186,<br />
188<br />
evictions 47, 50, 66, 70, 80<br />
extreme weather event(s) 12, 16, 116,<br />
118, 133, 142, 146<br />
favelas 75, 79, 84, 86-87, 90<br />
see also Brazil<br />
Fifth Assessment <strong>Report</strong> 116, 133<br />
see also Intergovernmental Panel<br />
on Climate Change (IPCC)<br />
firearms 73-75, 79, 86, 89, 92<br />
see also lethal weapons<br />
fire(s) 11-13, 15-17, 21, 36-37, 39,<br />
43-45, 50-51, 57, 106, 121, 139-140,<br />
149, 152, 161-163, 170-181<br />
<strong>World</strong> <strong>Disasters</strong> <strong>Report</strong> <strong>2010</strong> – Index<br />
203
INDEX<br />
204<br />
flooding 16-17, 21, 28, 37-38, 40-42,<br />
46-47, 57, 64, 69-70, 117, 119-121,<br />
124-125, 127-129, 135, 146, 195-196<br />
flood plains 21-22, 124, 142, 148<br />
flood(s) 7-8, 11-12, 16, 21-22, 28,<br />
34-37, 39-42, 45-48, 50-51, 54, 56-58,<br />
63-64, 98, 100, 115, 119-120, 124-125,<br />
129, 139, 142-143, 146-148, 150, 160-<br />
163, 168, 170-173, 177, 179, 181, 192,<br />
194-195, 198<br />
Food and Agriculture Organization <strong>of</strong><br />
the United Nations (FAO) 98, 111<br />
food insecurity 37-38, 96, 99, 101, 120,<br />
170-178, 180<br />
food security 7, 37, 49, 51, 112<br />
Fourth Assessment <strong>Report</strong> 40, 50, 116,<br />
123, 135-137<br />
see also Intergovernmental Panel<br />
on Climate Change (IPCC)<br />
France 35, 160, 169, 186, 188<br />
French <strong>Red</strong> <strong>Cross</strong> 109<br />
G8 95, 133<br />
gangs 74-78, 82, 84, 86-87, 91-92<br />
Gauteng province 87<br />
see also South Africa<br />
Gaviria, César 89<br />
gender 79, 121-122, 137, 193<br />
Ghana 59, 182<br />
Glasgow 95<br />
see also United Kingdom<br />
Global Road Safety Partnership (GRSP)<br />
109<br />
Global Strategy on Violence Prevention,<br />
Mitigation and Response 79<br />
see also <strong>International</strong> <strong>Federation</strong><br />
<strong>of</strong> <strong>Red</strong> <strong>Cross</strong> and <strong>Red</strong> Crescent<br />
Societies (IFRC)<br />
good practice 11, 16, 26-27, 125<br />
Gormley, John 125<br />
greenhouse gas emissions 16, 115, 118,<br />
123-125, 130, 135<br />
see also climate change<br />
Greenland ice sheet 123<br />
gross domestic product (GDP) 32,<br />
38-39, 46, 75-77, 83<br />
Guardian, The 108, 112<br />
Guatemala 75, 81-83, 87, 155-156, 184<br />
Guinea 41-42, 182, 187-188<br />
Gujarat 62-63, 69<br />
see also India<br />
Guyana 87, 184<br />
H1N1 103<br />
see also influenza<br />
H5N1 102-103<br />
see also influenza<br />
Haiti 11, 22-24, 27, 34-35, 42, 53-54,<br />
75, 81, 90, 99, 111, 140, 151, 184, 188<br />
Han, Lu 106-107<br />
Hayden, Michael 124<br />
healthcare 7, 16, 21, 26, 34, 53-54, 67,<br />
77, 84, 95, 100-101, 131, 139-140,<br />
150-151, 195<br />
heart disease(s) 95, 97-98<br />
heatwave(s) 16, 35, 115, 117, 122
high-income nations 12-13, 16-17,<br />
19-20, 22, 27, 32, 39-40, 44, 96<br />
see also low-income nations<br />
see also middle-income nations<br />
HIV/AIDS 151<br />
Ho Chi Minh City 109, 119<br />
see also Viet Nam<br />
Honduras 81, 143, 152, 154, 156, 184<br />
Hong Kong 103, 119, 185, 188<br />
see also China<br />
housing 8, 11-12, 15-16, 18-26, 28, 36,<br />
44, 46-47, 53-54, 56-59, 61, 64-70, 73,<br />
80-81, 86, 96-97, 121, 128, 130, 140,<br />
142-144, 150, 153-154, 162, 193, 196<br />
see also poor-quality housing<br />
housing, land and property (HLP) rights<br />
64-66, 69<br />
Hout Bay 44<br />
see also South Africa<br />
Huancayo 119<br />
see also Peru<br />
Human Development Index (HDI) 88,<br />
163, 166-169, 175, 177, 179, 181<br />
see also United Nations<br />
Development Programme (UNDP)<br />
humanitarian assistance 14<br />
hunger 96, 98-99, 111<br />
Hurricane Felix 22<br />
Hurricane Katrina 13, 34-35, 65-66,<br />
124, 160<br />
Hurricane Mitch 54, 143, 145, 150, 152<br />
hurricane(s) 22, 195<br />
hygiene 70, 96, 111, 120-121<br />
Hyogo Framework for Action 191, 199<br />
ICLEI-Local Governments for<br />
Sustainability 124, 130, 136<br />
illegal settlements 21, 26, 45, 53, 67,<br />
119, 142, 196<br />
income-earning opportunities 19, 22,<br />
24, 26, 59, 62<br />
India 22, 28, 35, 56, 59, 62-63, 70, 80,<br />
82, 97, 100, 110, 139, 160, 167, 185,<br />
194<br />
Indian Ocean tsunami 35, 53, 160, 167<br />
see also tsunami<br />
Indonesia 22, 35, 55-56, 59, 69, 71, 99,<br />
139, 144, 148, 150, 153, 160, 167, 185,<br />
198<br />
Indonesian <strong>Red</strong> <strong>Cross</strong> Society (PMI)<br />
149<br />
Indore 63, 70<br />
see also India<br />
industrial accident(s) 11, 13, 140, 162,<br />
170-181<br />
infant mortality rate (IMR) 96<br />
infectious disease(s) 11, 21, 95-97, 105,<br />
113, 150<br />
see also disease<br />
see also non-communicable disease(s)<br />
influenza 101, 103<br />
see also H1N1<br />
see also H5N1<br />
informal settlement(s) 11-12, 15, 17-19,<br />
22, 24-27, 41-42, 44-45, 49-51, 53-54,<br />
59-60, 62-64, 67, 70, 86, 97, 100, 102,<br />
128, 142-144, 146, 150-151, 192, 196<br />
see also shanty town(s)<br />
see also slum(s)<br />
<strong>World</strong> <strong>Disasters</strong> <strong>Report</strong> <strong>2010</strong> – Index<br />
205
INDEX<br />
206<br />
infrastructure 11-12, 14-21, 23-27,<br />
33-34, 40-43, 45-47, 53-54, 56, 59-61,<br />
64, 67, 87, 95, 97, 100, 109, 118, 120-<br />
121, 123-124, 126-130, 133, 136-137,<br />
139-140, 142-144, 146-150, 153, 162,<br />
192-193, 196, 198<br />
insurance 17, 21-22, 25, 40, 46, 50, 66,<br />
107, 121, 126, 143, 161, 164<br />
Intergovernmental Panel on Climate<br />
Change (IPCC) 50, 116-118, 123, 128,<br />
130, 133, 136<br />
international aid 21, 23, 55<br />
<strong>International</strong> Committee <strong>of</strong> the <strong>Red</strong><br />
<strong>Cross</strong> (ICRC) 87<br />
see also <strong>International</strong> <strong>Federation</strong><br />
<strong>of</strong> <strong>Red</strong> <strong>Cross</strong> and <strong>Red</strong> Crescent<br />
Societies (IFRC)<br />
see also <strong>Red</strong> <strong>Cross</strong> <strong>Red</strong> Crescent<br />
<strong>International</strong> <strong>Federation</strong> <strong>of</strong> <strong>Red</strong> <strong>Cross</strong><br />
and <strong>Red</strong> Crescent Societies (IFRC)<br />
18, 28, 31, 37, 53, 63, 69, 73, 79, 83,<br />
88-89, 102, 109-110, 115, 136, 144,<br />
150<br />
see also <strong>International</strong> Committee<br />
<strong>of</strong> the <strong>Red</strong> <strong>Cross</strong> (ICRC)<br />
see also <strong>Red</strong> <strong>Cross</strong> <strong>Red</strong> Crescent<br />
<strong>International</strong> Monetary Fund 68, 98,<br />
111<br />
<strong>International</strong> <strong>Red</strong> <strong>Cross</strong> and <strong>Red</strong><br />
Crescent Movement 79, 91<br />
Iran 13, 35, 167, 185<br />
Ireland 5, 124, 128, 136, 186<br />
Irish Academy <strong>of</strong> Engineering (IAE)<br />
124, 136<br />
Irish <strong>Red</strong> <strong>Cross</strong> 124<br />
Istanbul 45-48, 50-51<br />
see also Turkey<br />
Izmit earthquake 46<br />
see also Turkey<br />
Jakarta 119, 198<br />
see also Indonesia<br />
Jamaica 74-76, 78, 81, 88-91, 184<br />
Japan 13-14, 34, 66, 95, 113, 185,<br />
196-197<br />
Joe Slovo 44, 50<br />
see also South Africa<br />
Jordan 96, 185<br />
Kabul 58, 69<br />
see also Afghanistan<br />
Kabul Area Shelter and Settlement<br />
Project 58, 69<br />
Karachi 42, 69, 82, 155<br />
see also Pakistan<br />
Kenya 59, 70-71, 73, 81, 88, 98, 115,<br />
150, 160, 182, 188<br />
Khulna 41<br />
see also Bangladesh<br />
Kingston 74<br />
see also Jamaica<br />
Kinshasa 82, 102<br />
see also Democratic Republic<br />
<strong>of</strong> the Congo<br />
Kobe 14, 66, 95, 113<br />
see also Japan<br />
Kumaresan, Jacob 95, 105<br />
Kuwait 105, 185<br />
Lagos 42, 69, 76-77, 82, 119, 135<br />
see also Nigeria<br />
landlords 25<br />
land sharing 67, 196
landslide(s) 21-22, 45, 56-57, 117, 121,<br />
143, 150, 162-163, 170-173, 175, 177,<br />
179, 181, 196<br />
land tenure 54, 56, 58, 67, 70-71, 196<br />
see also tenure<br />
land use 27, 65, 142-143, 146-147<br />
Lao People’s Democratic Republic 160,<br />
185<br />
Latin America 11-12, 19, 23, 28, 32-33,<br />
37, 43, 58, 64, 73, 76, 80, 82, 86, 89,<br />
91-93, 97-99, 105, 111, 137, 144, 147,<br />
152-153, 155-156<br />
see also Americas<br />
Latin American Commission on Drugs<br />
and Democracy 89<br />
lethal weapons 74<br />
see also firearms<br />
Liberia 87, 99, 172, 182<br />
life expectancy 34, 95, 104, 111<br />
lifestyle(s) 95, 98, 104-105, 110, 112<br />
livelihoods 16, 19, 21, 25-26, 28, 38,<br />
50-51, 53-55, 57, 61-63, 79, 115, 117,<br />
121, 133, 143, 192-193<br />
local authorities 8, 17, 27, 59, 77, 85,<br />
125, 142, 198<br />
see also local government(s)<br />
see also municipalities<br />
local government(s) 11, 18, 21, 26-27,<br />
53-54, 56-61, 66-68, 77, 82, 86, 116,<br />
124-125, 131, 139, 142-147, 149-150,<br />
152-153, 156, 191-199<br />
see also central government(s)<br />
see also municipalities<br />
Local Solidarity Programme 145<br />
see also Porto Alegre<br />
London 32, 44, 49, 51, 95, 97, 99, 123<br />
see also United Kingdom<br />
London School <strong>of</strong> Economics<br />
and Political Science 73, 89, 92<br />
Los Angeles 76, 107<br />
see also United States <strong>of</strong> America<br />
low-income group(s) 11, 14-15, 19,<br />
21-22, 25, 54, 56, 62, 127, 130, 133,<br />
142-143, 146, 193<br />
low-income nations 13, 20, 142, 148<br />
see also high-income nations<br />
see also middle-income nations<br />
Luzon 37-38<br />
see also Philippines<br />
Making Cities Resilient 139, 191<br />
see also United Nations <strong>International</strong><br />
Strategy for Disaster Risk <strong>Red</strong>uction<br />
(UNISDR)<br />
malaria 96, 101, 105, 109, 121<br />
Malawi 59, 118, 182<br />
malnutrition 7, 37, 96, 99, 111<br />
MAMUCA (Community <strong>of</strong> central<br />
Atlántida municipalities) 152, 154<br />
see also Honduras<br />
Managua 82, 143, 155<br />
see also Nicaragua<br />
Manila 37-38, 57, 70, 104, 119, 156<br />
see also Philippines<br />
Mauritania 99, 182<br />
measles 96, 101<br />
Medellín 86, 93<br />
see also Colombia<br />
mega-cities 17, 19, 31-32, 34, 38, 78,<br />
106-107, 137<br />
Mexico 42, 75-76, 78, 80-81, 83, 88-90,<br />
92, 103, 122, 184<br />
Middle East 98<br />
<strong>World</strong> <strong>Disasters</strong> <strong>Report</strong> <strong>2010</strong> – Index<br />
207
INDEX<br />
208<br />
middle-income nations 12-15, 17, 19,<br />
21-22, 24-27, 31-32, 39-40, 117, 123-<br />
124, 128, 130-131, 140, 142, 147, 150,<br />
157<br />
see also high-income nations<br />
see also low-income nations<br />
migration 31, 73, 101, 117, 137<br />
Millennium Development Goal(s) 8, 15,<br />
111, 139<br />
Minnig, Michel 87<br />
mitigation 50, 69, 79, 116, 123, 125,<br />
143, 146, 148-151, 154, 194<br />
Mogadishu 41-42<br />
see also Somalia<br />
Monitoring, Mapping and Analysis<br />
<strong>of</strong> Disaster Incidents in South Africa<br />
(MANDISA) database 43, 49<br />
Morocco 150, 182<br />
Mozambique 28, 59, 75, 183<br />
Mumbai 17, 24, 29, 35, 70, 80, 86, 119<br />
see also India<br />
Munich Re 20, 28, 38, 50-51, 162, 165<br />
municipalities 23-24, 27, 46-47, 56-57,<br />
79, 146-147, 149, 152, 193<br />
see also local authorities<br />
see also local government(s)<br />
Murano 140<br />
Myanmar 22, 35-36, 41-42, 160, 167,<br />
185<br />
Nairobi 17, 59, 73-76, 82, 96, 98, 115,<br />
150<br />
see also Kenya<br />
Nairobi Urban Health and Demographic<br />
Surveillance System 96<br />
Namibia 59, 70, 183, 193<br />
NatCat database 38, 50<br />
see also Munich Re<br />
National Disaster Management Agency<br />
(BNPB) 148<br />
see also Indonesia<br />
natural hazards 31, 36, 50, 157<br />
Near East<br />
see Middle East<br />
Nepal 59, 185<br />
New Delhi 47, 100-101, 110<br />
see also India<br />
New Orleans 13, 34-35, 65<br />
see also United States <strong>of</strong> America<br />
New York 97, 123<br />
see also United States <strong>of</strong> America<br />
Nicaragua 22, 81, 87, 92, 143, 146,<br />
157, 184<br />
Nigeria 42, 59, 69, 76, 119, 135, 183,<br />
188<br />
Ningbo 41-42<br />
see also China<br />
non-communicable disease(s) 95, 97-98,<br />
104-106, 110<br />
see also disease<br />
see also infectious disease(s)<br />
non-governmental organization(s)<br />
(NGOs) 11, 55-56, 58-59, 100, 110,<br />
120-121, 134, 147, 153, 161<br />
North Africa 19, 98<br />
see also Africa<br />
North America 14, 105<br />
see also Americas<br />
Norway 87, 186<br />
Norwegian <strong>Red</strong> <strong>Cross</strong> 87<br />
obesity 97-98, 104-105
Oceania 12, 166-169, 174-176, 178,<br />
180-181, 187-188<br />
Office <strong>of</strong> Foreign Disaster Assistance<br />
(OFDA) 35, 161<br />
see also United States <strong>of</strong> America<br />
Organisation for Economic<br />
Co-operation and Development<br />
(OECD) 11, 51, 92<br />
organized crime 74, 85, 90, 92<br />
see also crime<br />
Orzechowski, Frank 99, 111<br />
OSSO (Seismic Observatory <strong>of</strong> the<br />
South-West) 42, 51<br />
Pachauri, Rajendra K. 118, 136<br />
Pacific 56, 98, 104<br />
Pakistan 35, 42, 59-60, 65, 83, 88, 91,<br />
96, 185, 198<br />
Panama 80-81, 184<br />
Pan American Health Organization<br />
(PAHO) 105, 111<br />
pandemic(s) 7, 101, 103<br />
Paraguay 80, 184<br />
Paris 51, 92, 107<br />
see also France<br />
Peru 65, 80-81, 83, 119, 122, 152, 154,<br />
156, 184, 192<br />
Philippines 13, 22, 37-38, 56-57, 59,<br />
70-71, 99, 104, 155-156, 160, 185<br />
Philippines Homeless People’s<br />
<strong>Federation</strong> (HPF) 56-57<br />
Phnom Penh 80<br />
see also Cambodia<br />
Pisco 65-66, 192<br />
see also Peru<br />
pneumonia 96, 101, 106<br />
political violence 74<br />
see also violence<br />
pollution 95, 100-101, 106, 108,<br />
122-123<br />
poor-quality housing 15, 19, 21, 26, 53,<br />
56, 128<br />
see also housing<br />
population growth 7, 12, 19, 40, 120,<br />
140, 197<br />
Port-au-Prince 11, 13, 23-24, 34-35, 42,<br />
100, 140<br />
Porto Alegre 95, 145, 156<br />
see also Brazil<br />
poverty 11, 15-16, 18, 21-22, 28-29,<br />
47, 50, 56, 68, 70, 73-74, 76, 79-82,<br />
85, 88, 90, 100-101, 108-111, 120-122,<br />
154-155, 157<br />
see also urban poverty<br />
Poverty <strong>Red</strong>uction Strategy Papers 68<br />
President Lula da Silva 64<br />
see also Brazil<br />
Progresiva 88<br />
public transport 21, 77, 86, 140<br />
Puerto Rico 161, 184<br />
Quito 120, 137, 157<br />
see also Ecuador<br />
reconstruction 23-26, 54-56, 58, 60-62,<br />
65-66, 144, 146-147, 152, 192-193,<br />
199<br />
<strong>Red</strong> <strong>Cross</strong> <strong>Red</strong> Crescent 87<br />
see also <strong>International</strong> Committee<br />
<strong>of</strong> the <strong>Red</strong> <strong>Cross</strong> (ICRC)<br />
see also <strong>International</strong> <strong>Federation</strong><br />
<strong>of</strong> <strong>Red</strong> <strong>Cross</strong> and <strong>Red</strong> Crescent<br />
Societies (IFRC)<br />
<strong>World</strong> <strong>Disasters</strong> <strong>Report</strong> <strong>2010</strong> – Index<br />
209
INDEX<br />
210<br />
<strong>Red</strong> <strong>Cross</strong> Society <strong>of</strong> China 106-107<br />
<strong>Red</strong> <strong>Cross</strong> <strong>of</strong> Viet Nam 109<br />
relocation 23, 47, 54, 58-60, 62, 64,<br />
122, 130<br />
resettlement 25, 57, 65, 70<br />
resilience 20, 50, 70, 92, 122, 127, 129,<br />
131, 133, 135-136, 191-192, 195<br />
RespectED 87<br />
see also Canadian <strong>Red</strong> <strong>Cross</strong><br />
Rio de Janeiro 31, 75-76, 84, 90, 107<br />
see also Brazil<br />
risk 7-8, 11-12, 14-24, 26-29, 31,<br />
33, 36, 38, 40-51, 54, 56-57, 59, 61,<br />
63-64, 67-68, 70, 78-80, 82, 87, 95-96,<br />
98-100, 102-104, 106-108, 115-125,<br />
127, 129, 131, 133-134, 136-137, 139-<br />
157, 164-165, 191-199<br />
rural population 3, 12, 17<br />
rural–urban migration 31<br />
Ryan, Michael J. 100, 103<br />
Safer Cities Programme 86<br />
see also United Nations<br />
Human Settlements Programme<br />
(UN-Habitat)<br />
Saint-Louis 120, 132<br />
see also Senegal<br />
salinization 117, 119, 125<br />
San Antonio de Areco 146<br />
see also Argentina<br />
Sanayee Development Organization 58<br />
San Francisco 40, 152<br />
see also United States <strong>of</strong> America<br />
sanitation 15-17, 21, 29, 34, 37, 62, 73,<br />
79, 95-97, 99, 121-122, 127, 139-140,<br />
143, 150, 162<br />
San Salvador 147<br />
see also El Salvador<br />
Santa Fe 143, 148<br />
see also Argentina<br />
São Paulo 76, 146<br />
see also Brazil<br />
Save the Children India 100<br />
savings groups 56, 58, 62, 67, 193<br />
see also community associations<br />
sea-level rise 40, 117, 119, 123-124<br />
Senegal 99, 115, 120, 157, 183<br />
severe acute respiratory syndrome<br />
(SARS) 102-103<br />
Shack/Slum Dwellers <strong>International</strong><br />
(SDI) 58-59<br />
Shanghai 106, 119<br />
see also China<br />
shanty town(s) 11, 73, 81, 84<br />
see also informal settlement(s)<br />
see also slum(s)<br />
shelter 8, 23, 25, 28, 47, 58, 62-66, 69,<br />
95-96, 108, 115, 122, 162, 196<br />
Sichuan earthquake 22, 35, 160<br />
Sierra Leone 59, 87, 183<br />
Sierra Leone <strong>Red</strong> <strong>Cross</strong> Society 87<br />
Sigma database 165<br />
see also Swiss Re<br />
Singapore 103, 110, 119, 185<br />
slum dwellers 15, 22, 31, 58-59, 61, 79,<br />
86, 97-98, 100, 110, 115, 139
slum(s) 7, 11, 15, 22-23, 28, 31, 37-38,<br />
58-62, 64, 68-70, 73, 76-81, 84, 86-87,<br />
93, 95-101, 110, 112, 115, 128, 139,<br />
150, 154, 196<br />
see also informal settlement(s)<br />
see also shanty town(s)<br />
Small Arms Survey 75, 92<br />
social violence 73-74, 90<br />
see also violence<br />
Somalia 41-42, 74-75, 160, 183<br />
South Africa 18, 43-44, 50-51, 59, 73,<br />
75, 77, 81, 87, 91, 98, 141, 153, 156,<br />
183, 197<br />
South African <strong>Red</strong> <strong>Cross</strong> Society 44<br />
South America 75<br />
see also Americas<br />
South Asia 22<br />
see also Asia<br />
see also South-East Asia<br />
South Asian tsunami<br />
see Indian Ocean tsunami<br />
South-East Asia 22, 97, 103-104<br />
see also Asia<br />
see also South Asia<br />
Spain 35, 160, 187<br />
Spanish <strong>Red</strong> <strong>Cross</strong> 87, 144<br />
Sri Lanka 35, 59, 65, 87, 185<br />
standards 12, 15, 20, 34, 46-47, 61, 65,<br />
88, 128, 130, 139-140, 142, 193, 195<br />
Stein, Alfredo 54, 70<br />
storm(s) 12, 16-17, 21, 37-38, 40, 42,<br />
47, 54, 56, 61, 64, 115, 118-119, 121,<br />
124, 126-127, 129, 142, 152, 160, 162,<br />
192<br />
see also windstorm(s)<br />
storm surges 12, 56, 115, 119, 121, 124,<br />
192<br />
Strategic Forecasting Inc. (STRATFOR)<br />
75, 92<br />
Strategy 2020 133, 136<br />
see also <strong>International</strong> <strong>Federation</strong><br />
<strong>of</strong> <strong>Red</strong> <strong>Cross</strong> and <strong>Red</strong> Crescent<br />
Societies (IFRC)<br />
street children 82, 101<br />
see also children<br />
sub-Saharan Africa 41, 51, 73, 76,<br />
97-98, 102, 139<br />
see also Africa<br />
Sudan 160, 183<br />
Sumatra 22, 160, 167<br />
see also Indonesia<br />
Sunday Tribune 124<br />
Swaziland 59, 183<br />
Swiss Re 162, 165<br />
Switzerland 35, 103, 137, 187<br />
Taiwan 160, 185<br />
Tanzania 42, 59, 118-119, 160, 183<br />
technological accident(s) 16<br />
Tegucigalpa 143, 150<br />
see also Honduras<br />
tenure 8, 24, 54, 56, 58-60, 65-67,<br />
70-71, 97, 128, 196<br />
see also land tenure<br />
Thailand 35, 59, 64-65, 69, 104, 150,<br />
154, 185, 196<br />
The Lancet 97, 112<br />
Toronto 86<br />
see also Canada<br />
traffic accident(s) 15, 37, 106-107, 139<br />
<strong>World</strong> <strong>Disasters</strong> <strong>Report</strong> <strong>2010</strong> – Index<br />
211
INDEX<br />
212<br />
transportation 86, 108, 122-123, 127,<br />
129-131, 162<br />
Tropical Storm Ketsana 37-38<br />
tropical storm(s) 37-38, 118, 160<br />
tsunami 11, 28, 35, 53, 55, 62, 65, 69,<br />
71, 148-149, 153, 160, 167<br />
see also Indian Ocean tsunami<br />
tuberculosis (TB) 95, 97, 101, 105, 109,<br />
151<br />
Turkey 13, 45, 50-51, 187<br />
see also Istanbul<br />
Uganda 59, 74-75, 160, 183<br />
unemployment 24, 82, 86, 107-108,<br />
162<br />
United Arab Emirates 105, 186<br />
United Kingdom 95, 187<br />
United Nations 12, 28-29, 31, 51, 65,<br />
71, 73, 92-93, 96, 98, 111-112, 116,<br />
118, 135, 137, 139, 154, 157, 161,<br />
191-192<br />
United Nations Children’s Fund<br />
(UNICEF) 51, 90, 98, 101, 111-112<br />
United Nations Development<br />
Programme (UNDP) 71, 81, 93, 162-<br />
163, 166-169, 175, 177, 179, 181,<br />
192-193<br />
United Nations Economic Commission<br />
for Latin America and the Caribbean<br />
(ECLAC) 80-81, 93<br />
United Nations Framework Convention<br />
on Climate Change (UNFCCC) 116,<br />
130, 137, 156<br />
United Nations Human Settlements<br />
Programme (UN-Habitat) 15, 23, 29,<br />
31, 37, 50-51, 71, 73, 86, 92-93, 96-97,<br />
99-100, 112, 129, 137, 139, 157, 191<br />
United Nations <strong>International</strong> Strategy<br />
for Disaster Risk <strong>Red</strong>uction (UNISDR)<br />
28-29, 51, 139, 154, 157, 159, 191-<br />
192, 194-199<br />
United Nations Joint Programme on<br />
HIV/AIDS (UNAIDS) 102<br />
United Nations Population Division 51<br />
United Nations Principles on Housing<br />
and Property Restitution for Refugees<br />
and Displaced Persons 65<br />
United Nations Summit on Climate<br />
Change 118<br />
United States Agency for <strong>International</strong><br />
Development (USAID) 58, 161<br />
United States Department <strong>of</strong> State 93<br />
United States <strong>of</strong> America 13, 19, 35, 58,<br />
75-76, 89, 93, 95, 100, 103, 118, 160-<br />
161, 184, 188<br />
upgrading (slums) 24, 27, 46, 60, 64,<br />
67, 69, 71, 110, 128, 144, 150, 154,<br />
192, 196<br />
urban adaptation 127, 129-130, 135<br />
urban centres 11, 14, 16-17, 19-21, 31,<br />
36, 67, 85, 95-96, 98-99, 101-103, 105,<br />
115, 117, 123, 125, 142, 147<br />
urban development 16-18, 20, 24, 28,<br />
42, 45-46, 115, 139, 148, 150, 154,<br />
156, 191, 193, 196<br />
urban dwellers 14-16, 31, 37, 40, 42,<br />
47, 49, 73, 96-97, 102, 106, 197<br />
urban governance 8, 23, 110-111, 125,<br />
139<br />
urban growth 12, 31, 33, 41
urbanization 7-8, 11-12, 16-19, 27-29,<br />
32, 34, 40, 42, 47-48, 50-51, 69-71,<br />
73, 79-80, 86, 89-91, 97, 101, 105,<br />
108-109, 111-112, 115, 118, 120, 133,<br />
135-137, 140, 143, 154-157<br />
urban management 27, 139<br />
urban population 12, 14-15, 17, 24,<br />
31-32, 64, 97-98, 119, 125, 128, 150<br />
urban poverty 15-16, 18, 21, 28, 68,<br />
111, 155<br />
see also poverty<br />
urban risk(s) 7-8, 11, 29, 31, 38, 43-45,<br />
48-49, 95-96, 106, 191, 196<br />
urban violence 73-74, 76-77, 79-81,<br />
83-85, 87-89, 91-92, 112<br />
see also crime<br />
see also violence<br />
Uruguay 80-81, 184<br />
Venezuela 80-81, 104, 143, 155, 184<br />
Venice 140<br />
Viet Nam 103, 109, 160, 186<br />
volcanic eruptions 56, 162, 170-176,<br />
178-181<br />
vulnerability 7, 11, 16, 20, 31, 39-40,<br />
45-47, 50-51, 56, 65, 69, 73, 117-122,<br />
125, 133, 135-137, 140, 143-144, 151-<br />
152, 155-156, 161, 195<br />
vulnerability gap 20, 45-46<br />
vulnerable people 8, 77<br />
water 7, 14-17, 21, 26, 29, 34, 37, 40,<br />
42, 44, 47, 53-54, 61-64, 67, 73, 79,<br />
95-97, 99-101, 104, 117-122, 124-127,<br />
129, 131, 139-141, 143, 147-148, 150,<br />
162, 193, 195, 197-198<br />
West Africa 75<br />
see also Africa<br />
West Antarctic ice sheet 123<br />
women 16, 26, 46, 55-56, 65, 77-78,<br />
80, 86, 101-103, 108, 112, 121-122,<br />
193<br />
<strong>World</strong> Bank 29, 50, 68, 91, 93, 106,<br />
112-113, 156-157, 163<br />
<strong>World</strong> Economic Forum 98, 113<br />
<strong>World</strong> Food Programme (WFP) 51,<br />
98-99, 112<br />
<strong>World</strong> Health Organization (WHO) 95,<br />
97, 100-101, 103-106, 108-109, 113<br />
<strong>World</strong> Meteorological Organization<br />
(WMO) 116, 133, 137<br />
<strong>World</strong> Urban Campaign 2009–2013<br />
191<br />
see also United Nations<br />
Human Settlements Programme<br />
(UN-Habitat)<br />
WWF 119, 137<br />
Yangon 35-36, 41-42<br />
see also Myanmar<br />
Youth as Agents <strong>of</strong> Behavioural Change<br />
programme 88<br />
see also <strong>International</strong> <strong>Federation</strong><br />
<strong>of</strong> <strong>Red</strong> <strong>Cross</strong> and <strong>Red</strong> Crescent<br />
Societies (IFRC)<br />
Zambia 59, 183<br />
Zedillo, Ernesto 89<br />
Zimbabwe 59, 80, 183<br />
<strong>World</strong> <strong>Disasters</strong> <strong>Report</strong> <strong>2010</strong> – Index<br />
213
INDEX<br />
214
The Fundamental Principles<br />
<strong>of</strong> the <strong>International</strong> <strong>Red</strong> <strong>Cross</strong><br />
and <strong>Red</strong> Crescent Movement<br />
Humanity<br />
The <strong>International</strong> <strong>Red</strong> <strong>Cross</strong> and <strong>Red</strong> Crescent Movement, born <strong>of</strong> a desire to<br />
bring assistance without discrimination to the wounded on the battlefield,<br />
endeavours, in its international and national capacity, to prevent and alleviate<br />
human suffering wherever it may be found. Its purpose is to protect life and<br />
health and to ensure respect for the human being. It promotes mutual<br />
understanding, friendship, cooperation and lasting peace among all peoples.<br />
Impartiality<br />
It makes no discrimination as to nationality, race, religious beliefs, class or<br />
political opinions. It endeavours to relieve the suffering <strong>of</strong> individuals, being<br />
guided solely by their needs, and to give priority to the most urgent cases <strong>of</strong><br />
distress.<br />
Neutrality<br />
In order to continue to enjoy the confidence <strong>of</strong> all, the Movement may not take<br />
sides in hostilities or engage at any time in controversies <strong>of</strong> a political, racial,<br />
religious or ideological nature.<br />
Independence<br />
The Movement is independent. The National Societies, while auxiliaries in the<br />
humanitarian services <strong>of</strong> their governments and subject to the laws <strong>of</strong> their<br />
respective countries, must always maintain their autonomy so that they may be<br />
able at all times to act in accordance with the principles <strong>of</strong> the Movement.<br />
Voluntary service<br />
It is a voluntary relief movement not prompted in any manner by desire for<br />
gain.<br />
Unity<br />
There can be only one <strong>Red</strong> <strong>Cross</strong> or <strong>Red</strong> Crescent Society in any one country. It<br />
must be open to all. It must carry on its humanitarian work throughout its<br />
territory.<br />
Universality<br />
The <strong>International</strong> <strong>Red</strong> <strong>Cross</strong> and <strong>Red</strong> Crescent Movement, in which all societies<br />
have equal status and share equal responsibilities and duties in helping each<br />
other, is worldwide.
The <strong>International</strong> <strong>Federation</strong><br />
<strong>of</strong> <strong>Red</strong> <strong>Cross</strong> and <strong>Red</strong> Crescent<br />
Societies promotes the<br />
humanitarian activities <strong>of</strong><br />
National Societies among<br />
vulnerable people.<br />
By coordinating international<br />
disaster relief and<br />
encouraging development<br />
support it seeks to prevent<br />
and alleviate human suffering.<br />
The <strong>International</strong> <strong>Federation</strong>,<br />
the National Societies and<br />
the <strong>International</strong> Committee<br />
<strong>of</strong> the <strong>Red</strong> <strong>Cross</strong> together<br />
constitute the <strong>International</strong><br />
<strong>Red</strong> <strong>Cross</strong> and <strong>Red</strong> Crescent<br />
Movement.<br />
“ When our house flooded, I sometimes woke up at<br />
midnight to find my feet in water, cockroaches and rats<br />
fighting over space, and various objects floating around the<br />
living room, so I had to get up in the middle <strong>of</strong> the night.<br />
Our biggest concern was preventing the furniture from<br />
getting ruined. Not that we had much to get ruined… Every<br />
time it rained, we used to nail another piece <strong>of</strong> wood across<br />
the doorframe, and dump another truckload <strong>of</strong> earth to<br />
reinforce the barricade. But every time it rained the water<br />
level rose further. And the authorities never did anything.<br />
– President Lula da Silva, Brazil<br />
<strong>World</strong> <strong>Disasters</strong> <strong>Report</strong> <strong>2010</strong><br />
Focus on urban risk<br />
This year’s <strong>World</strong> <strong>Disasters</strong> <strong>Report</strong> takes an in-depth look at the consequences<br />
for humanitarian action <strong>of</strong> the dramatic surge in the numbers<br />
<strong>of</strong> people living in cities and towns which will be the hallmark <strong>of</strong> the<br />
21st century. It examines the issues around this irreversible trend as the<br />
world comes to terms with the fact that more people now live in cities<br />
and towns than in the countryside for the first time in human history.<br />
Has development aid kept pace with this dramatic shift? Why are<br />
almost a billion people worldwide still living in slums? How can vulnerable<br />
cities protect themselves from climate change? What are the<br />
emerging health issues <strong>of</strong> rapid urbanization? Can anything be done<br />
to turn back the tide <strong>of</strong> violence sweeping many inner cities and<br />
ghettos?<br />
The <strong>World</strong> <strong>Disasters</strong> <strong>Report</strong> <strong>2010</strong> features:<br />
� Avoiding the urbanization <strong>of</strong> disasters<br />
� Urban disaster trends<br />
� Starting over:Community rights and post-disaster response<br />
� Urban violence<br />
� Urban risk to health<br />
� Urbanization and climate change risk<br />
� Urban governance and disaster risk reduction<br />
Plus: photos, tables, graphics and index<br />
Published annually since 1993, the <strong>World</strong><br />
<strong>Disasters</strong> <strong>Report</strong> brings together the latest<br />
trends, facts and analysis <strong>of</strong> contemporary<br />
crises – whether ‘natural’ or man-made,<br />
quick onset or chronic.<br />
”