Advances in Pulmonary Hypertension - PHA Online University
Advances in Pulmonary Hypertension - PHA Online University
Advances in Pulmonary Hypertension - PHA Online University

Create successful ePaper yourself
Turn your PDF publications into a flip-book with our unique Google optimized e-Paper software.
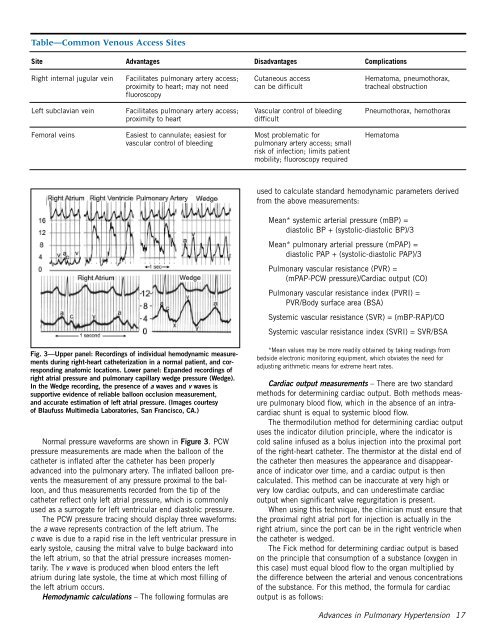
Table—Common Venous Access Sites<br />
Site Advantages Disadvantages Complications<br />
Right <strong>in</strong>ternal jugular ve<strong>in</strong> Facilitates pulmonary artery access; Cutaneous access Hematoma, pneumothorax,<br />
proximity to heart; may not need can be difficult tracheal obstruction<br />
fluoroscopy<br />
Left subclavian ve<strong>in</strong> Facilitates pulmonary artery access; Vascular control of bleed<strong>in</strong>g Pneumothorax, hemothorax<br />
proximity to heart difficult<br />
Femoral ve<strong>in</strong>s Easiest to cannulate; easiest for Most problematic for Hematoma<br />
vascular control of bleed<strong>in</strong>g pulmonary artery access; small<br />
risk of <strong>in</strong>fection; limits patient<br />
mobility; fluoroscopy required<br />
Fig. 3—Upper panel: Record<strong>in</strong>gs of <strong>in</strong>dividual hemodynamic measurements<br />
dur<strong>in</strong>g right-heart catheterization <strong>in</strong> a normal patient, and correspond<strong>in</strong>g<br />
anatomic locations. Lower panel: Expanded record<strong>in</strong>gs of<br />
right atrial pressure and pulmonary capillary wedge pressure (Wedge).<br />
In the Wedge record<strong>in</strong>g, the presence of a waves and v waves is<br />
supportive evidence of reliable balloon occlusion measurement,<br />
and accurate estimation of left atrial pressure. (Images courtesy<br />
of Blaufuss Multimedia Laboratories, San Francisco, CA.)<br />
Normal pressure waveforms are shown <strong>in</strong> Figure 3. PCW<br />
pressure measurements are made when the balloon of the<br />
catheter is <strong>in</strong>flated after the catheter has been properly<br />
advanced <strong>in</strong>to the pulmonary artery. The <strong>in</strong>flated balloon prevents<br />
the measurement of any pressure proximal to the balloon,<br />
and thus measurements recorded from the tip of the<br />
catheter reflect only left atrial pressure, which is commonly<br />
used as a surrogate for left ventricular end diastolic pressure.<br />
The PCW pressure trac<strong>in</strong>g should display three waveforms:<br />
the a wave represents contraction of the left atrium. The<br />
c wave is due to a rapid rise <strong>in</strong> the left ventricular pressure <strong>in</strong><br />
early systole, caus<strong>in</strong>g the mitral valve to bulge backward <strong>in</strong>to<br />
the left atrium, so that the atrial pressure <strong>in</strong>creases momentarily.<br />
The v wave is produced when blood enters the left<br />
atrium dur<strong>in</strong>g late systole, the time at which most fill<strong>in</strong>g of<br />
the left atrium occurs.<br />
Hemodynamic calculations – The follow<strong>in</strong>g formulas are<br />
used to calculate standard hemodynamic parameters derived<br />
from the above measurements:<br />
Mean* systemic arterial pressure (mBP) =<br />
diastolic BP + (systolic-diastolic BP)/3<br />
Mean* pulmonary arterial pressure (mPAP) =<br />
diastolic PAP + (systolic-diastolic PAP)/3<br />
<strong>Pulmonary</strong> vascular resistance (PVR) =<br />
(mPAP-PCW pressure)/Cardiac output (CO)<br />
<strong>Pulmonary</strong> vascular resistance <strong>in</strong>dex (PVRI) =<br />
PVR/Body surface area (BSA)<br />
Systemic vascular resistance (SVR) = (mBP-RAP)/CO<br />
Systemic vascular resistance <strong>in</strong>dex (SVRI) = SVR/BSA<br />
*Mean values may be more readily obta<strong>in</strong>ed by tak<strong>in</strong>g read<strong>in</strong>gs from<br />
bedside electronic monitor<strong>in</strong>g equipment, which obviates the need for<br />
adjust<strong>in</strong>g arithmetic means for extreme heart rates.<br />
Cardiac output measurements – There are two standard<br />
methods for determ<strong>in</strong><strong>in</strong>g cardiac output. Both methods measure<br />
pulmonary blood flow, which <strong>in</strong> the absence of an <strong>in</strong>tracardiac<br />
shunt is equal to systemic blood flow.<br />
The thermodilution method for determ<strong>in</strong><strong>in</strong>g cardiac output<br />
uses the <strong>in</strong>dicator dilution pr<strong>in</strong>ciple, where the <strong>in</strong>dicator is<br />
cold sal<strong>in</strong>e <strong>in</strong>fused as a bolus <strong>in</strong>jection <strong>in</strong>to the proximal port<br />
of the right-heart catheter. The thermistor at the distal end of<br />
the catheter then measures the appearance and disappearance<br />
of <strong>in</strong>dicator over time, and a cardiac output is then<br />
calculated. This method can be <strong>in</strong>accurate at very high or<br />
very low cardiac outputs, and can underestimate cardiac<br />
output when significant valve regurgitation is present.<br />
When us<strong>in</strong>g this technique, the cl<strong>in</strong>ician must ensure that<br />
the proximal right atrial port for <strong>in</strong>jection is actually <strong>in</strong> the<br />
right atrium, s<strong>in</strong>ce the port can be <strong>in</strong> the right ventricle when<br />
the catheter is wedged.<br />
The Fick method for determ<strong>in</strong><strong>in</strong>g cardiac output is based<br />
on the pr<strong>in</strong>ciple that consumption of a substance (oxygen <strong>in</strong><br />
this case) must equal blood flow to the organ multiplied by<br />
the difference between the arterial and venous concentrations<br />
of the substance. For this method, the formula for cardiac<br />
output is as follows:<br />
<strong>Advances</strong> <strong>in</strong> <strong>Pulmonary</strong> <strong>Hypertension</strong> 17