

RPH-2015-09
RPH-2015-09
RPH-2015-09
- No tags were found...

Create successful ePaper yourself
Turn your PDF publications into a flip-book with our unique Google optimized e-Paper software.
32<br />
Community Impact Newspaper • communityimpact.com<br />
<strong>2015</strong> Education<br />
Focus<br />
ROUND ROCK ISD<br />
<strong>2015</strong> Education<br />
Elementary<br />
schools<br />
2014-15 accountability<br />
rating<br />
2014-15 enrollment<br />
2014-15 economically<br />
disadvantaged<br />
Reading<br />
2014-15 STAAR passing results by grade*<br />
3rd 4th 5th<br />
Math<br />
Reading<br />
Math<br />
Writing<br />
Reading<br />
Math<br />
Science<br />
Feeder<br />
schools<br />
1 Anderson Mill MS 474 55.9% 72% NSE 69% NSE 67% 84% NSE 77% 39<br />
2 Berkman MS 499 79.4% 63% NSE 57% NSE 43% 70% NSE 50% 35<br />
3 Blackland Prairie MS 855 9.4% 93% NSE 91% NSE 89% 99% NSE 91% 42<br />
4 Bluebonnet MS 579 78.8% 80% NSE 67% NSE 62% 69% NSE 64% 37<br />
5 Brushy Creek MS 790 20.6% 91% NSE 92% NSE 92% 96% NSE 93% 36, 43<br />
6 Cactus Ranch MS 1,071 2.5% 97% NSE 97% NSE 97% 98% NSE 97% 43<br />
7 Caldwell Heights MS 646 45.7% 85% NSE 83% NSE 71% 84% NSE 79% 40, 41<br />
8 Callison MS 862 58.5% 74% NSE 73% NSE 69% 72% NSE 65% 35<br />
9 Canyon Creek MS 436 2.3% 100% NSE 99% NSE 99% 100% NSE 100% 39<br />
10 Caraway MS 714 11.5% 94% NSE 94% NSE 86% 93% NSE 90% 34<br />
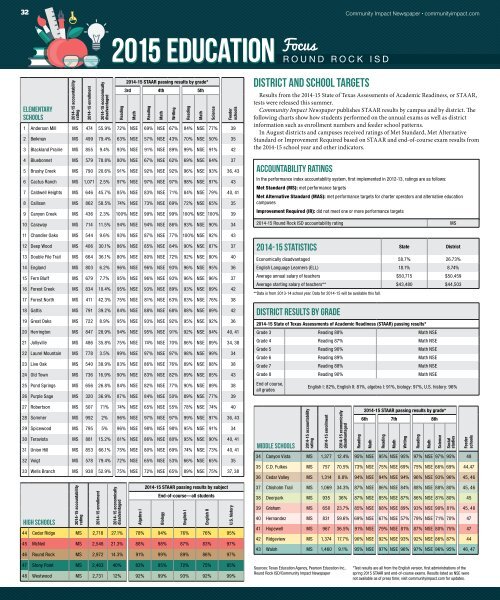
District and school targets<br />
Results from the 2014-15 State of Texas Assessments of Academic Readiness, or STAAR,<br />
tests were released this summer.<br />
Community Impact Newspaper publishes STAAR results by campus and by district. The<br />
following charts show how students performed on the annual exams as well as district<br />
information such as enrollment numbers and feeder school patterns.<br />
In August districts and campuses received ratings of Met Standard, Met Alternative<br />
Standard or Improvement Required based on STAAR and end-of-course exam results from<br />
the 2014-15 school year and other indicators.<br />
Accountability ratings<br />
In the performance index accountability system, first implemented in 2012-13, ratings are as follows:<br />
Met Standard (MS): met performance targets<br />
Met Alternative Standard (MAS): met performance targets for charter operators and alternative education<br />
campuses<br />
Improvement Required (IR): did not meet one or more performance targets<br />
2014-15 Round Rock ISD accountability rating MS<br />
11 Chandler Oaks MS 544 9.6% 93% NSE 87% NSE 77% 100% NSE 92% 43<br />
12 Deep Wood MS 406 30.1% 86% NSE 85% NSE 84% 90% NSE 87% 37<br />
13 Double File Trail MS 664 36.1% 80% NSE 80% NSE 72% 92% NSE 80% 40<br />
14 England MS 803 6.2% 96% NSE 96% NSE 93% 96% NSE 95% 36<br />
15 Fern Bluff MS 679 7.7% 95% NSE 96% NSE 93% 96% NSE 96% 37<br />
16 Forest Creek MS 834 10.4% 95% NSE 93% NSE 89% 93% NSE 89% 42<br />
17 Forest North MS 411 42.3% 75% NSE 81% NSE 63% 83% NSE 76% 38<br />
18 Gattis MS 791 39.2% 84% NSE 88% NSE 68% 88% NSE 89% 42<br />
19 Great Oaks MS 722 8.9% 95% NSE 93% NSE 92% 95% NSE 92% 36<br />
20 Herrington MS 847 28.9% 94% NSE 95% NSE 91% 92% NSE 94% 40, 41<br />
21 Jollyville MS 486 35.8% 75% NSE 74% NSE 70% 86% NSE 89% 34, 38<br />
22 Laurel Mountain MS 778 3.5% 99% NSE 97% NSE 97% 98% NSE 99% 34<br />
23 Live Oak MS 540 38.9% 83% NSE 86% NSE 76% 89% NSE 88% 38<br />
24 Old Town MS 736 16.9% 90% NSE 83% NSE 82% 89% NSE 85% 43<br />
25 Pond Springs MS 656 26.8% 84% NSE 82% NSE 77% 90% NSE 89% 38<br />
26 Purple Sage MS 320 36.9% 87% NSE 84% NSE 50% 89% NSE 77% 39<br />
27 Robertson MS 507 71% 74% NSE 65% NSE 55% 78% NSE 74% 40<br />
28 Sommer MS 992 2% 96% NSE 97% NSE 97% 99% NSE 97% 36, 43<br />
29 Spicewood MS 795 5% 96% NSE 98% NSE 98% 95% NSE 91% 34<br />
30 Teravista MS 881 15.2% 81% NSE 86% NSE 80% 95% NSE 90% 40, 41<br />
31 Union Hill MS 853 66.1% 75% NSE 80% NSE 69% 74% NSE 73% 40, 41<br />
32 Voigt MS 578 79.4% 72% NSE 65% NSE 53% 66% NSE 65% 35<br />
33 Wells Branch MS 938 52.9% 75% NSE 72% NSE 65% 89% NSE 75% 37, 38<br />
High schools<br />
2014-15 accountability<br />
rating<br />
2014-15 enrollment<br />
2014-15 economically<br />
disadvantaged<br />
2014-15 STAAR passing results by subject<br />
End-of-course—all students<br />
44 Cedar Ridge MS 2,718 27.1% 78% 94% 76% 76% 95%<br />
45 McNeil MS 2,546 21.3% 88% 98% 87% 83% 97%<br />
46 Round Rock MS 2,972 14.3% 91% 99% 89% 86% 97%<br />
Algebra I<br />
Biology<br />
English I<br />
English II<br />
U.S. history<br />
2014-15 statistics<br />
State District<br />
Economically disadvantaged 58.7% 26.73%<br />
English Language Learners (ELL) 18.1% 8.74%<br />
Average annual salary of teachers $50,715 $50,459<br />
Average starting salary of teachers** $43,480 $44,503<br />
**Data is from 2013-14 school year. Data for 2014-15 will be available this fall.<br />
District results by grade<br />
2014-15 State of Texas Assessments of Academic Readiness (STAAR) passing results*<br />
Grade 3 Reading 88% Math NSE<br />
Grade 4 Reading 87% Math NSE<br />
Grade 5 Reading 90% Math NSE<br />
Grade 6 Reading 89% Math NSE<br />
Grade 7 Reading 88% Math NSE<br />
Grade 8 Reading 90% Math NSE<br />
End of course,<br />
all grades<br />
English I: 82%, English II: 81%, algebra I: 91%, biology: 97%, U.S. history: 96%<br />
Middle schools<br />
2014-15 accountability<br />
rating<br />
2014-15 enrollment<br />
2014-15 economically<br />
disadvantaged<br />
Reading<br />
2014-15 STAAR passing results by grade*<br />
6th 7th 8th<br />
34 Canyon Vista MS 1,377 12.4% 95% NSE 95% NSE 95% 97% NSE 97% 95% 48<br />
Math<br />
Reading<br />
Math<br />
Writing<br />
Reading<br />
Math<br />
Science<br />
Social<br />
studies<br />
Feeder<br />
schools<br />
35 C.D. Fulkes MS 757 70.5% 73% NSE 75% NSE 69% 75% NSE 66% 69% 44,47<br />
36 Cedar Valley MS 1,314 8.8% 94% NSE 94% NSE 94% 96% NSE 93% 96% 45, 46<br />
37 Chisholm Trail MS 1,069 34.3% 87% NSE 86% NSE 84% 88% NSE 88% 80% 45, 46<br />
38 Deerpark MS 935 36% 87% NSE 85% NSE 87% 86% NSE 81% 80% 45<br />
39 Grisham MS 658 23.7% 85% NSE 88% NSE 89% 93% NSE 90% 81% 45, 48<br />
40 Hernandez MS 831 59.6% 69% NSE 67% NSE 57% 79% NSE 71% 70% 47<br />
41 Hopewell MS 967 36.5% 91% NSE 79% NSE 81% 87% NSE 80% 75% 47<br />
42 Ridgeview MS 1,374 17.7% 90% NSE 92% NSE 93% 92% NSE 86% 87% 44<br />
43 Walsh MS 1,460 9.1% 95% NSE 97% NSE 96% 97% NSE 96% 95% 46, 47<br />
47 Stony Point MS 2,463 40% 83% 95% 72% 75% 95%<br />
48 Westwood MS 2,731 12% 92% 99% 93% 92% 99%<br />
Sources: Texas Education Agency, Pearson Education Inc.,<br />
Round Rock ISD/Community Impact Newspaper<br />
*Test results are all from the English version, first administrations of the<br />
spring <strong>2015</strong> STAAR and end-of-course exams. Results listed as NSE were<br />
not available as of press time; visit communityimpact.com for updates.