SABINE-NECHES WATERWAY (SNWW) CHANNEL IMPROVEMENT PROJECT FEASIBILITY STUDY
Sabine-Neches Waterway IEPR report ... - Galveston District
Sabine-Neches Waterway IEPR report ... - Galveston District
- No tags were found...

Create successful ePaper yourself
Turn your PDF publications into a flip-book with our unique Google optimized e-Paper software.
49 $122,875 $93,428 $100,045 $106,663 $113,280 $126,515<br />
50 $127,696 $97,099 $103,974 $110,850 $117,726 $131,478<br />
Net Excess Benefits ($1,000) Based on Utilization Scenarios<br />
45 $13,624 -$4,679 -$566 $3,547 $7,660 $15,886<br />
46 $18,598 -$3,051 $1,814 $6,679 $11,544 $21,274<br />
47 $20,004 -$3,764 $1,577 $6,918 $12,259 $22,941<br />
48 $23,733 -$3,448 $2,660 $8,768 $14,876 $27,093<br />
49 $26,249 -$3,198 $3,419 $10,037 $16,654 $29,889<br />
50 $25,785 -$4,812 $2,063 $8,939 $15,815 $29,567<br />
BCRs Based on Utilization Scenarios<br />
45 1.2 .0.9 .0.9 1.1 1.1 1.2<br />
46 1.2 .0.9 1.0 1.1 1.1 1.3<br />
47 1.2 .0.9 1.0 1.1 1.1 1.3<br />
48 1.3 .0.9 1.0 1.1 1.2 1.3<br />
49 1.3 .0.9 1.0 1.1 1.2 1.3<br />
50 1.3 .0.9 1.0 1.1 1.2 1.3<br />
The remainder of this comment response addresses the IEPR follow-up (4 June 2010)<br />
contain pertaining to changes in the market share used for LNG. The other item was to<br />
define the basis for the market share.<br />
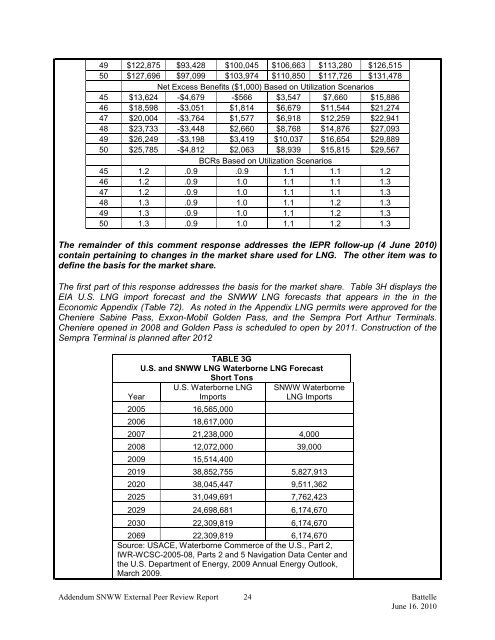
The first part of this response addresses the basis for the market share. Table 3H displays the<br />
EIA U.S. LNG import forecast and the <strong>SNWW</strong> LNG forecasts that appears in the in the<br />
Economic Appendix (Table 72). As noted in the Appendix LNG permits were approved for the<br />
Cheniere Sabine Pass, Exxon-Mobil Golden Pass, and the Sempra Port Arthur Terminals.<br />
Cheniere opened in 2008 and Golden Pass is scheduled to open by 2011. Construction of the<br />
Sempra Terminal is planned after 2012<br />
TABLE 3G<br />
U.S. and <strong>SNWW</strong> LNG Waterborne LNG Forecast<br />
Short Tons<br />
Year<br />
U.S. Waterborne LNG<br />
Imports<br />
<strong>SNWW</strong> Waterborne<br />
LNG Imports<br />
2005 16,565,000<br />
2006 18,617,000<br />
2007 21,238,000 4,000<br />
2008 12,072,000 39,000<br />
2009 15,514,400<br />
2019 38,852,755 5,827,913<br />
2020 38,045,447 9,511,362<br />
2025 31,049,691 7,762,423<br />
2029 24,698,681 6,174,670<br />
2030 22,309,819 6,174,670<br />
2069 22,309,819 6,174,670<br />
Source: USACE, Waterborne Commerce of the U.S., Part 2,<br />
IWR-WCSC-2005-08, Parts 2 and 5 Navigation Data Center and<br />
the U.S. Department of Energy, 2009 Annual Energy Outlook,<br />
March 2009.<br />
Addendum <strong>SNWW</strong> External Peer Review Report 24 Battelle<br />
June 16. 2010