Lecture 3 Trigonometric Functions Graphs
Lecture 3: Trigonometric Functions: Graphs
Lecture 3: Trigonometric Functions: Graphs

You also want an ePaper? Increase the reach of your titles
YUMPU automatically turns print PDFs into web optimized ePapers that Google loves.
<strong>Lecture</strong> 3: <strong>Trigonometric</strong> <strong>Functions</strong>: <strong>Graphs</strong><br />
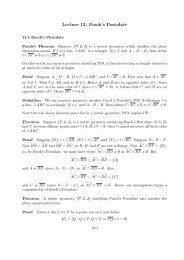
3.1 The graph of the sine function<br />
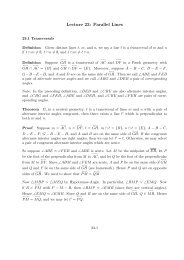
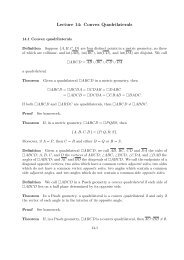
Example Let f(x) = sin(x). Starting at f(0) = 0, the graph of f increases to f ( )<br />
π<br />
2 = 1,<br />
then decreases through f(π) = 0 until reaching f ( )<br />
3π<br />
2 = −1, and then increases again until<br />
it reaches f(2π) = 0. Since f has period 2π, the graph of f repeats this behavior over<br />
every interval of length 2π. The graph of f over the interval [−2π, 4π] is shown below.<br />
1<br />
0.5<br />
-5 -2.5 2.5 5 7.5 10 12.5<br />
-0.5<br />
-1<br />
Graph of f(x) = sin(x)<br />
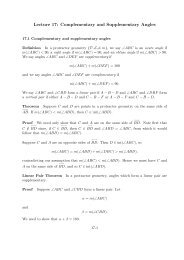
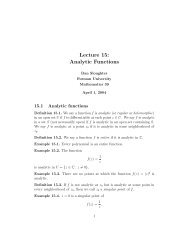
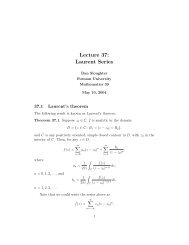
Example The graph of f(x) = 2 sin(x) looks like the graph in the preceding example,<br />
except that it will oscillate between −2 and 2 instead of between −1 and 1.<br />
2<br />
1<br />
-5 -2.5 2.5 5 7.5 10 12.5<br />
-1<br />
-2<br />
Graph of f(x) = 2 sin(x)<br />
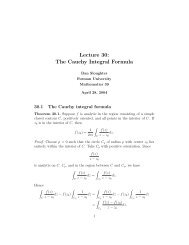
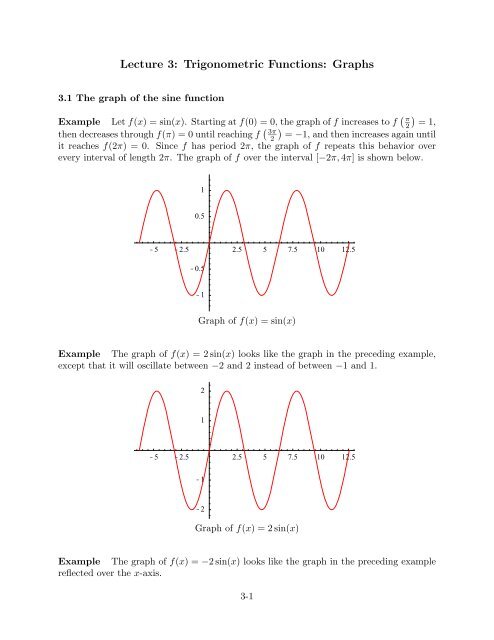
Example The graph of f(x) = −2 sin(x) looks like the graph in the preceding example<br />
reflected over the x-axis.<br />
3-1
<strong>Lecture</strong> 3: <strong>Trigonometric</strong> <strong>Functions</strong>: <strong>Graphs</strong> 3-2<br />
2<br />
1<br />
-5 -2.5 2.5 5 7.5 10 12.5<br />
-1<br />
-2<br />
Graph of f(x) = −2 sin(x)<br />
In both of the preceding examples, we say the function has amplitude 2.<br />
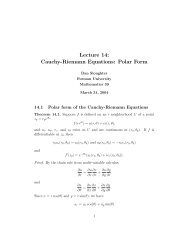
Example The graph of f(x) = sin(2x) will look like the graph of sin(x), except that it<br />
completes an entire oscillation over the interval [0, π]. That is, f has period π.<br />
1<br />
0.5<br />
-5 -2.5 2.5 5 7.5 10 12.5<br />
-0.5<br />
-1<br />
Graph of f(x) = sin(2x)<br />
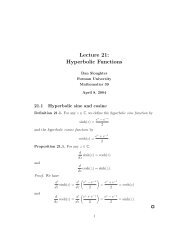
Example The graph of f(x) = sin (x − π) is the graph of sin(x) shifted horizontally to<br />
the right by π. We call π the phase angle of f.<br />
In general, for constants a, b, and c,<br />
f(x) = a sin(b(x − c))<br />
has amplitude |a|, period 2π<br />
|b|<br />
, and phase angle c.<br />
Example<br />
Let f(x) = 4 sin(2πx + π). Then<br />
f(x) = 4 sin<br />
(<br />
2π<br />
(<br />
x + 1 ))<br />
,<br />
2
<strong>Lecture</strong> 3: <strong>Trigonometric</strong> <strong>Functions</strong>: <strong>Graphs</strong> 3-3<br />
1<br />
0.5<br />
-5 -2.5 2.5 5 7.5 10 12.5<br />
-0.5<br />
-1<br />
Graph of f(x) = sin(x − π)<br />
4<br />
2<br />
-2 -1 1 2<br />
-2<br />
-4<br />
Graph of f(x) = 4 sin(2 ∗ πx + π)<br />
so f has amplitude 4, period 1, and phase angle 1 2 .<br />
3.2 <strong>Graphs</strong> of the other trigonometric functions<br />
Example<br />
Note that<br />
(<br />
sin x + π )<br />
( π<br />
)<br />
( π<br />
)<br />
= sin(x) cos + cos(x) sin = cos(x).<br />
2<br />
2 2<br />
Hence the graph of f(x) = cos(x) is the graph of sin(x) shifted to the left by π 2 .<br />
As above, for constants a, b, and c,<br />
f(x) = a cos(b(x − c))<br />
has amplitude |a|, period 2π<br />
|b|<br />
, and phase angle c.
<strong>Lecture</strong> 3: <strong>Trigonometric</strong> <strong>Functions</strong>: <strong>Graphs</strong> 3-4<br />
1<br />
0.5<br />
-5 -2.5 2.5 5 7.5 10 12.5<br />
-0.5<br />
-1<br />
Graph of f(x) = cos(x)<br />
Example<br />
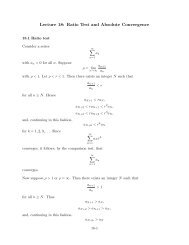
Let f(x) = tan(x). Note that<br />
and<br />
lim tan(x) =<br />
x→ π 2 −<br />
lim tan(x) =<br />
x→− π 2 +<br />
lim<br />
x→ π 2 −<br />
lim<br />
x→− π 2 +<br />
sin(x)<br />
cos(x) = ∞<br />
sin(x)<br />
cos(x) = −∞.<br />
Hence the lines x = − π 2 and x = π 2<br />
are vertical asymptotes for the graph f. Recalling<br />
that tan(x) has period π, we can understand why the graph of f looks as it does in the<br />
following plot.<br />
10<br />
7.5<br />
5<br />
2.5<br />
-4 -2 2 4<br />
-2.5<br />
-5<br />
-7.5<br />
-10<br />
Graph of f(x) = tan(x)<br />
Example<br />
Let f(x) = sec(x). Note that<br />
lim sec(x) = lim 1<br />
x→− π 2 + x→− π 2 + cos(x) = ∞,
<strong>Lecture</strong> 3: <strong>Trigonometric</strong> <strong>Functions</strong>: <strong>Graphs</strong> 3-5<br />
and<br />
1<br />
lim sec(x) = lim<br />
x→ π 2 − x→ π 2 − cos(x) = ∞,<br />
1<br />
lim sec(x) = lim<br />
x→ π 2 + x→ π 2 + cos(x) = −∞,<br />
lim sec(x) =<br />
x→ 3π −<br />
2<br />
lim<br />
x→ 3π −<br />
2<br />
1<br />
cos(x) = −∞.<br />
Hence [ the lines x = − π 2 , x = π 2 , and x = 3π 2<br />
. Also, note that sec(x) ≥ 1 for all x in<br />
−<br />
π<br />
2 , ] [ π<br />
2 and sec(x) ≤ −1 for all x in π<br />
2 , ] 3π<br />
2 . Combining this information with the fact<br />
that sec(x) has period 2π, we can understand why the graph of f looks as it does in the<br />
following plot.<br />
4<br />
2<br />
-4 -2 2 4 6 8<br />
-2<br />
-4<br />
Graph of f(x) = sec(x)