Allometry and evaluation of in situ optical LAI ... - Tree Physiology
Allometry and evaluation of in situ optical LAI ... - Tree Physiology
Allometry and evaluation of in situ optical LAI ... - Tree Physiology

Create successful ePaper yourself
Turn your PDF publications into a flip-book with our unique Google optimized e-Paper software.
726 JONCKHEERE, MUYS AND COPPIN<br />
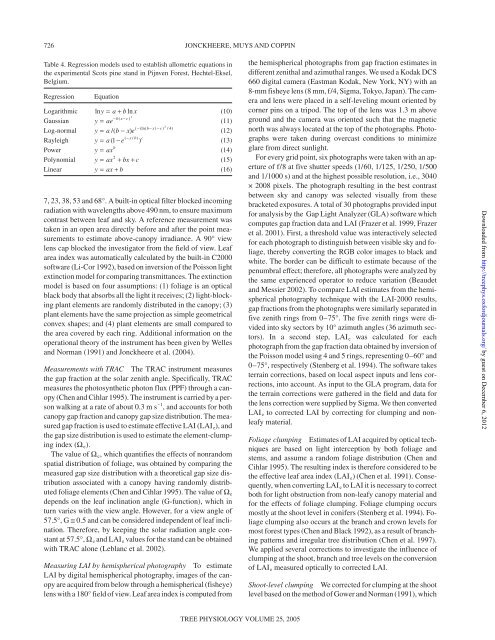
Table 4. Regression models used to establish allometric equations <strong>in</strong><br />
the experimental Scots p<strong>in</strong>e st<strong>and</strong> <strong>in</strong> Pijnven Forest, Hechtel-Eksel,<br />
Belgium.<br />
Regression Equation<br />
Logarithmic lny = a + bln x<br />
(10)<br />
Gaussian<br />
−b( x−c) y = ae 2<br />
(11)<br />
Log-normal<br />
2<br />
( −(ln( b−x) −c)<br />
/ 4)<br />
y = a/( b − x) e<br />
(12)<br />
Rayleigh<br />
x b c<br />
y = a −e − ( / )<br />
( 1 )<br />
(13)<br />
Power y ax b<br />
= (14)<br />
Polynomial<br />
2<br />
y = ax + bx+ c<br />
(15)<br />
L<strong>in</strong>ear y = ax+ b<br />
(16)<br />
7, 23, 38, 53 <strong>and</strong> 68°. A built-<strong>in</strong> <strong>optical</strong> filter blocked <strong>in</strong>com<strong>in</strong>g<br />
radiation with wavelengths above 490 nm, to ensure maximum<br />
contrast between leaf <strong>and</strong> sky. A reference measurement was<br />
taken <strong>in</strong> an open area directly before <strong>and</strong> after the po<strong>in</strong>t measurements<br />
to estimate above-canopy irradiance. A 90° view<br />
lens cap blocked the <strong>in</strong>vestigator from the field <strong>of</strong> view. Leaf<br />
area <strong>in</strong>dex was automatically calculated by the built-<strong>in</strong> C2000<br />
s<strong>of</strong>tware (Li-Cor 1992), based on <strong>in</strong>version <strong>of</strong> the Poisson light<br />
ext<strong>in</strong>ction model for compar<strong>in</strong>g transmittances. The ext<strong>in</strong>ction<br />
model is based on four assumptions: (1) foliage is an <strong>optical</strong><br />
black body that absorbs all the light it receives; (2) light-block<strong>in</strong>g<br />
plant elements are r<strong>and</strong>omly distributed <strong>in</strong> the canopy; (3)<br />
plant elements have the same projection as simple geometrical<br />
convex shapes; <strong>and</strong> (4) plant elements are small compared to<br />
the area covered by each r<strong>in</strong>g. Additional <strong>in</strong>formation on the<br />
operational theory <strong>of</strong> the <strong>in</strong>strument has been given by Welles<br />
<strong>and</strong> Norman (1991) <strong>and</strong> Jonckheere et al. (2004).<br />
Measurements with TRAC The TRAC <strong>in</strong>strument measures<br />
the gap fraction at the solar zenith angle. Specifically, TRAC<br />
measures the photosynthetic photon flux (PPF) through a canopy<br />
(Chen <strong>and</strong> Cihlar 1995). The <strong>in</strong>strument is carried by a person<br />
walk<strong>in</strong>g at a rate <strong>of</strong> about 0.3 m s –1 , <strong>and</strong> accounts for both<br />
canopy gap fraction <strong>and</strong> canopy gap size distribution. The measured<br />
gap fraction is used to estimate effective <strong>LAI</strong> (<strong>LAI</strong> e), <strong>and</strong><br />
the gap size distribution is used to estimate the element-clump<strong>in</strong>g<br />
<strong>in</strong>dex (Ωe).<br />
The value <strong>of</strong> Ωe, which quantifies the effects <strong>of</strong> nonr<strong>and</strong>om<br />
spatial distribution <strong>of</strong> foliage, was obta<strong>in</strong>ed by compar<strong>in</strong>g the<br />
measured gap size distribution with a theoretical gap size distribution<br />
associated with a canopy hav<strong>in</strong>g r<strong>and</strong>omly distributed<br />
foliage elements (Chen <strong>and</strong> Cihlar 1995). The value <strong>of</strong> Ωe<br />
depends on the leaf <strong>in</strong>cl<strong>in</strong>ation angle (G-function), which <strong>in</strong><br />
turn varies with the view angle. However, for a view angle <strong>of</strong><br />
57.5°, G ≅ 0.5 <strong>and</strong> can be considered <strong>in</strong>dependent <strong>of</strong> leaf <strong>in</strong>cl<strong>in</strong>ation.<br />
Therefore, by keep<strong>in</strong>g the solar radiation angle constant<br />
at 57.5°, Ωe <strong>and</strong> <strong>LAI</strong> e values for the st<strong>and</strong> can be obta<strong>in</strong>ed<br />
with TRAC alone (Leblanc et al. 2002).<br />
Measur<strong>in</strong>g <strong>LAI</strong> by hemispherical photography To estimate<br />
<strong>LAI</strong> by digital hemispherical photography, images <strong>of</strong> the canopy<br />
are acquired from below through a hemispherical (fisheye)<br />
lens with a 180° field <strong>of</strong> view. Leaf area <strong>in</strong>dex is computed from<br />
TREE PHYSIOLOGY VOLUME 25, 2005<br />
the hemispherical photographs from gap fraction estimates <strong>in</strong><br />
different zenithal <strong>and</strong> azimuthal ranges. We used a Kodak DCS<br />
660 digital camera (Eastman Kodak, New York, NY) with an<br />
8-mm fisheye lens (8 mm, f/4, Sigma, Tokyo, Japan). The camera<br />
<strong>and</strong> lens were placed <strong>in</strong> a self-level<strong>in</strong>g mount oriented by<br />
corner p<strong>in</strong>s on a tripod. The top <strong>of</strong> the lens was 1.3 m above<br />
ground <strong>and</strong> the camera was oriented such that the magnetic<br />
north was always located at the top <strong>of</strong> the photographs. Photographs<br />
were taken dur<strong>in</strong>g overcast conditions to m<strong>in</strong>imize<br />
glare from direct sunlight.<br />
For every grid po<strong>in</strong>t, six photographs were taken with an aperture<br />
<strong>of</strong> f/8 at five shutter speeds (1/60, 1/125, 1/250, 1/500<br />
<strong>and</strong> 1/1000 s) <strong>and</strong> at the highest possible resolution, i.e., 3040<br />
× 2008 pixels. The photograph result<strong>in</strong>g <strong>in</strong> the best contrast<br />
between sky <strong>and</strong> canopy was selected visually from these<br />
bracketed exposures. A total <strong>of</strong> 30 photographs provided <strong>in</strong>put<br />
for analysis by the Gap Light Analyzer (GLA) s<strong>of</strong>tware which<br />
computes gap fraction data <strong>and</strong> <strong>LAI</strong> (Frazer et al. 1999, Frazer<br />
et al. 2001). First, a threshold value was <strong>in</strong>teractively selected<br />
for each photograph to dist<strong>in</strong>guish between visible sky <strong>and</strong> foliage,<br />
thereby convert<strong>in</strong>g the RGB color images to black <strong>and</strong><br />
white. The border can be difficult to estimate because <strong>of</strong> the<br />
penumbral effect; therefore, all photographs were analyzed by<br />
the same experienced operator to reduce variation (Beaudet<br />
<strong>and</strong> Messier 2002). To compare <strong>LAI</strong> estimates from the hemispherical<br />
photography technique with the <strong>LAI</strong>-2000 results,<br />
gap fractions from the photographs were similarly separated <strong>in</strong><br />
five zenith r<strong>in</strong>gs from 0–75°. The five zenith r<strong>in</strong>gs were divided<br />
<strong>in</strong>to sky sectors by 10° azimuth angles (36 azimuth sectors).<br />
In a second step, <strong>LAI</strong> e was calculated for each<br />
photograph from the gap fraction data obta<strong>in</strong>ed by <strong>in</strong>version <strong>of</strong><br />
the Poisson model us<strong>in</strong>g 4 <strong>and</strong> 5 r<strong>in</strong>gs, represent<strong>in</strong>g 0–60° <strong>and</strong><br />
0–75°, respectively (Stenberg et al. 1994). The s<strong>of</strong>tware takes<br />
terra<strong>in</strong> corrections, based on local aspect <strong>in</strong>puts <strong>and</strong> lens corrections,<br />
<strong>in</strong>to account. As <strong>in</strong>put to the GLA program, data for<br />
the terra<strong>in</strong> corrections were gathered <strong>in</strong> the field <strong>and</strong> data for<br />
the lens correction were supplied by Sigma. We then converted<br />
<strong>LAI</strong> e to corrected <strong>LAI</strong> by correct<strong>in</strong>g for clump<strong>in</strong>g <strong>and</strong> nonleafy<br />
material.<br />
Foliage clump<strong>in</strong>g Estimates <strong>of</strong> <strong>LAI</strong> acquired by <strong>optical</strong> techniques<br />
are based on light <strong>in</strong>terception by both foliage <strong>and</strong><br />
stems, <strong>and</strong> assume a r<strong>and</strong>om foliage distribution (Chen <strong>and</strong><br />
Cihlar 1995). The result<strong>in</strong>g <strong>in</strong>dex is therefore considered to be<br />
the effective leaf area <strong>in</strong>dex (<strong>LAI</strong> e) (Chen et al. 1991). Consequently,<br />
when convert<strong>in</strong>g <strong>LAI</strong> e to <strong>LAI</strong> it is necessary to correct<br />
both for light obstruction from non-leafy canopy material <strong>and</strong><br />
for the effects <strong>of</strong> foliage clump<strong>in</strong>g. Foliage clump<strong>in</strong>g occurs<br />
mostly at the shoot level <strong>in</strong> conifers (Stenberg et al. 1994). Foliage<br />
clump<strong>in</strong>g also occurs at the branch <strong>and</strong> crown levels for<br />
most forest types (Chen <strong>and</strong> Black 1992), as a result <strong>of</strong> branch<strong>in</strong>g<br />
patterns <strong>and</strong> irregular tree distribution (Chen et al. 1997).<br />
We applied several corrections to <strong>in</strong>vestigate the <strong>in</strong>fluence <strong>of</strong><br />
clump<strong>in</strong>g at the shoot, branch <strong>and</strong> tree levels on the conversion<br />
<strong>of</strong> <strong>LAI</strong> e measured <strong>optical</strong>ly to corrected <strong>LAI</strong>.<br />
Shoot-level clump<strong>in</strong>g We corrected for clump<strong>in</strong>g at the shoot<br />
level based on the method <strong>of</strong> Gower <strong>and</strong> Norman (1991), which<br />
Downloaded from<br />
http://treephys.oxfordjournals.org/ by guest on December 6, 2012