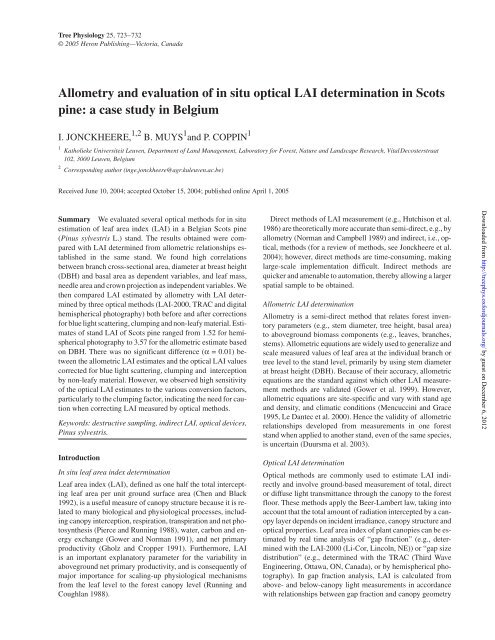
Allometry and evaluation of in situ optical LAI ... - Tree Physiology
Allometry and evaluation of in situ optical LAI ... - Tree Physiology
Allometry and evaluation of in situ optical LAI ... - Tree Physiology

You also want an ePaper? Increase the reach of your titles
YUMPU automatically turns print PDFs into web optimized ePapers that Google loves.
<strong>Tree</strong> <strong>Physiology</strong> 25, 723–732<br />
© 2005 Heron Publish<strong>in</strong>g—Victoria, Canada<br />
<strong>Allometry</strong> <strong>and</strong> <strong>evaluation</strong> <strong>of</strong> <strong>in</strong> <strong>situ</strong> <strong>optical</strong> <strong>LAI</strong> determ<strong>in</strong>ation <strong>in</strong> Scots<br />
p<strong>in</strong>e: a case study <strong>in</strong> Belgium<br />
I. JONCKHEERE, 1,2 B. MUYS 1 <strong>and</strong> P. COPPIN 1<br />
1<br />
Katholieke Universiteit Leuven, Department <strong>of</strong> L<strong>and</strong> Management, Laboratory for Forest, Nature <strong>and</strong> L<strong>and</strong>scape Research, VitalDecosterstraat<br />
102, 3000 Leuven, Belgium<br />
2<br />
Correspond<strong>in</strong>g author (<strong>in</strong>ge.jonckheere@agr.kuleuven.ac.be)<br />
Received June 10, 2004; accepted October 15, 2004; published onl<strong>in</strong>e April 1, 2005<br />
Summary We evaluated several <strong>optical</strong> methods for <strong>in</strong> <strong>situ</strong><br />
estimation <strong>of</strong> leaf area <strong>in</strong>dex (<strong>LAI</strong>) <strong>in</strong> a Belgian Scots p<strong>in</strong>e<br />
(P<strong>in</strong>us sylvestris L.) st<strong>and</strong>. The results obta<strong>in</strong>ed were compared<br />
with <strong>LAI</strong> determ<strong>in</strong>ed from allometric relationships established<br />
<strong>in</strong> the same st<strong>and</strong>. We found high correlations<br />
between branch cross-sectional area, diameter at breast height<br />
(DBH) <strong>and</strong> basal area as dependent variables, <strong>and</strong> leaf mass,<br />
needle area <strong>and</strong> crown projection as <strong>in</strong>dependent variables. We<br />
then compared <strong>LAI</strong> estimated by allometry with <strong>LAI</strong> determ<strong>in</strong>ed<br />
by three <strong>optical</strong> methods (<strong>LAI</strong>-2000, TRAC <strong>and</strong> digital<br />
hemispherical photography) both before <strong>and</strong> after corrections<br />
for blue light scatter<strong>in</strong>g, clump<strong>in</strong>g <strong>and</strong> non-leafy material. Estimates<br />
<strong>of</strong> st<strong>and</strong> <strong>LAI</strong> <strong>of</strong> Scots p<strong>in</strong>e ranged from 1.52 for hemispherical<br />
photography to 3.57 for the allometric estimate based<br />
on DBH. There was no significant difference (α = 0.01) between<br />
the allometric <strong>LAI</strong> estimates <strong>and</strong> the <strong>optical</strong> <strong>LAI</strong> values<br />
corrected for blue light scatter<strong>in</strong>g, clump<strong>in</strong>g <strong>and</strong> <strong>in</strong>terception<br />
by non-leafy material. However, we observed high sensitivity<br />
<strong>of</strong> the <strong>optical</strong> <strong>LAI</strong> estimates to the various conversion factors,<br />
particularly to the clump<strong>in</strong>g factor, <strong>in</strong>dicat<strong>in</strong>g the need for caution<br />
when correct<strong>in</strong>g <strong>LAI</strong> measured by <strong>optical</strong> methods.<br />
Keywords: destructive sampl<strong>in</strong>g, <strong>in</strong>direct <strong>LAI</strong>, <strong>optical</strong> devices,<br />
P<strong>in</strong>us sylvestris.<br />
Introduction<br />
In <strong>situ</strong> leaf area <strong>in</strong>dex determ<strong>in</strong>ation<br />
Leaf area <strong>in</strong>dex (<strong>LAI</strong>), def<strong>in</strong>ed as one half the total <strong>in</strong>tercept<strong>in</strong>g<br />
leaf area per unit ground surface area (Chen <strong>and</strong> Black<br />
1992), is a useful measure <strong>of</strong> canopy structure because it is related<br />
to many biological <strong>and</strong> physiological processes, <strong>in</strong>clud<strong>in</strong>g<br />
canopy <strong>in</strong>terception, respiration, transpiration <strong>and</strong> net photosynthesis<br />
(Pierce <strong>and</strong> Runn<strong>in</strong>g 1988), water, carbon <strong>and</strong> energy<br />
exchange (Gower <strong>and</strong> Norman 1991), <strong>and</strong> net primary<br />
productivity (Gholz <strong>and</strong> Cropper 1991). Furthermore, <strong>LAI</strong><br />
is an important explanatory parameter for the variability <strong>in</strong><br />
aboveground net primary productivity, <strong>and</strong> is consequently <strong>of</strong><br />
major importance for scal<strong>in</strong>g-up physiological mechanisms<br />
from the leaf level to the forest canopy level (Runn<strong>in</strong>g <strong>and</strong><br />
Coughlan 1988).<br />
Direct methods <strong>of</strong> <strong>LAI</strong> measurement (e.g., Hutchison et al.<br />
1986) are theoretically more accurate than semi-direct, e.g., by<br />
allometry (Norman <strong>and</strong> Campbell 1989) <strong>and</strong> <strong>in</strong>direct, i.e., <strong>optical</strong>,<br />
methods (for a review <strong>of</strong> methods, see Jonckheere et al.<br />
2004); however, direct methods are time-consum<strong>in</strong>g, mak<strong>in</strong>g<br />
large-scale implementation difficult. Indirect methods are<br />
quicker <strong>and</strong> amenable to automation, thereby allow<strong>in</strong>g a larger<br />
spatial sample to be obta<strong>in</strong>ed.<br />
Allometric <strong>LAI</strong> determ<strong>in</strong>ation<br />
<strong>Allometry</strong> is a semi-direct method that relates forest <strong>in</strong>ventory<br />
parameters (e.g., stem diameter, tree height, basal area)<br />
to aboveground biomass components (e.g., leaves, branches,<br />
stems). Allometric equations are widely used to generalize <strong>and</strong><br />
scale measured values <strong>of</strong> leaf area at the <strong>in</strong>dividual branch or<br />
tree level to the st<strong>and</strong> level, primarily by us<strong>in</strong>g stem diameter<br />
at breast height (DBH). Because <strong>of</strong> their accuracy, allometric<br />
equations are the st<strong>and</strong>ard aga<strong>in</strong>st which other <strong>LAI</strong> measurement<br />
methods are validated (Gower et al. 1999). However,<br />
allometric equations are site-specific <strong>and</strong> vary with st<strong>and</strong> age<br />
<strong>and</strong> density, <strong>and</strong> climatic conditions (Mencucc<strong>in</strong>i <strong>and</strong> Grace<br />
1995, Le Dantec et al. 2000). Hence the validity <strong>of</strong> allometric<br />
relationships developed from measurements <strong>in</strong> one forest<br />
st<strong>and</strong> when applied to another st<strong>and</strong>, even <strong>of</strong> the same species,<br />
is uncerta<strong>in</strong> (Duursma et al. 2003).<br />
Optical <strong>LAI</strong> determ<strong>in</strong>ation<br />
Optical methods are commonly used to estimate <strong>LAI</strong> <strong>in</strong>directly<br />
<strong>and</strong> <strong>in</strong>volve ground-based measurement <strong>of</strong> total, direct<br />
or diffuse light transmittance through the canopy to the forest<br />
floor. These methods apply the Beer-Lambert law, tak<strong>in</strong>g <strong>in</strong>to<br />
account that the total amount <strong>of</strong> radiation <strong>in</strong>tercepted by a canopy<br />
layer depends on <strong>in</strong>cident irradiance, canopy structure <strong>and</strong><br />
<strong>optical</strong> properties. Leaf area <strong>in</strong>dex <strong>of</strong> plant canopies can be estimated<br />
by real time analysis <strong>of</strong> “gap fraction” (e.g., determ<strong>in</strong>ed<br />
with the <strong>LAI</strong>-2000 (Li-Cor, L<strong>in</strong>coln, NE)) or “gap size<br />
distribution” (e.g., determ<strong>in</strong>ed with the TRAC (Third Wave<br />
Eng<strong>in</strong>eer<strong>in</strong>g, Ottawa, ON, Canada), or by hemispherical photography).<br />
In gap fraction analysis, <strong>LAI</strong> is calculated from<br />
above- <strong>and</strong> below-canopy light measurements <strong>in</strong> accordance<br />
with relationships between gap fraction <strong>and</strong> canopy geometry<br />
Downloaded from<br />
http://treephys.oxfordjournals.org/ by guest on December 6, 2012
724 JONCKHEERE, MUYS AND COPPIN<br />
Table 1. Symbols used for the variables related to leaf area <strong>in</strong>dex (<strong>LAI</strong>).<br />
Symbol Def<strong>in</strong>ition Reference<br />
<strong>LAI</strong> Half the total leaf surface area per unit ground area Chen <strong>and</strong> Black 1992<br />
<strong>LAI</strong>e Effective <strong>LAI</strong> estimated by <strong>optical</strong> methods Chen et al. 1991<br />
<strong>LAI</strong>c <strong>LAI</strong> estimated by correct<strong>in</strong>g <strong>LAI</strong>e for needle clump<strong>in</strong>g <strong>in</strong> conifers; Equation 1 Chen 1996<br />
<strong>LAI</strong>B <strong>LAI</strong> estimated by correct<strong>in</strong>g <strong>LAI</strong>e for clump<strong>in</strong>g at branch <strong>and</strong> tree level <strong>in</strong> conifers; Equation 5 Chen <strong>and</strong> Cihlar 1995<br />
<strong>LAI</strong>F <strong>LAI</strong> estimated by correct<strong>in</strong>g <strong>LAI</strong>e for needle clump<strong>in</strong>g, tree branch distribution <strong>and</strong> Chen et al. 1997<br />
non-leafy material; Equation 6<br />
<strong>LAI</strong>A <strong>LAI</strong> estimated with allometric relationships <strong>in</strong> conifers Marklund 1988<br />
derived from light ext<strong>in</strong>ction models that l<strong>in</strong>k <strong>LAI</strong>, canopy architecture<br />
<strong>and</strong> the penetration <strong>of</strong> light through the canopy. Gap<br />
fraction, as a function <strong>of</strong> zenith angle, is the essence <strong>of</strong> such<br />
mathematical formulas <strong>and</strong> models (Norman <strong>and</strong> Campbell<br />
1989, Chason et al. 1991, Welles <strong>and</strong> Norman 1991). Although<br />
it has been claimed that <strong>optical</strong> <strong>in</strong>struments provide a reliable<br />
means <strong>of</strong> estimat<strong>in</strong>g <strong>LAI</strong> <strong>in</strong> coniferous (Stenberg et al. 1994,<br />
Chen et al. 1997, Kucharik et al. 1999) <strong>and</strong> deciduous st<strong>and</strong>s<br />
(Chason et al. 1991, Cut<strong>in</strong>i et al. 1998, Planchais <strong>and</strong><br />
Pontailler 1999), most <strong>of</strong> these <strong>in</strong>struments determ<strong>in</strong>e effective<br />
<strong>LAI</strong> (<strong>LAI</strong>e, for other symbols, see Table 1) based on the assumption<br />
<strong>of</strong> r<strong>and</strong>om spatial distribution <strong>of</strong> leaves (Dufrêne<br />
<strong>and</strong> Bréda 1995). However, foliage clustered at the shoot level<br />
<strong>in</strong>validates this assumption, result<strong>in</strong>g <strong>in</strong> an underestimation <strong>of</strong><br />
<strong>LAI</strong> (e.g., Cut<strong>in</strong>i et al. 1998).<br />
We used several <strong>optical</strong> methods for estimat<strong>in</strong>g <strong>LAI</strong> <strong>in</strong> a<br />
Scots p<strong>in</strong>e st<strong>and</strong> <strong>and</strong> compared the results, with <strong>and</strong> without<br />
correction for foliage clump<strong>in</strong>g at different levels, with <strong>LAI</strong><br />
estimated from allometric equations developed for the st<strong>and</strong><br />
based on destructive sampl<strong>in</strong>g.<br />
Materials <strong>and</strong> methods<br />
Experimental site description<br />
This study was performed <strong>in</strong> a Scots p<strong>in</strong>e st<strong>and</strong> <strong>in</strong> the Pijnven<br />
state forest at Hechtel-Eksel <strong>in</strong> southern Limburg, Belgium<br />
(51°10.2′ N, 5°19.2′ E), at a mean elevation <strong>of</strong> 56 m. The<br />
Pijnven State Forest is an 850-ha managed forest compris<strong>in</strong>g<br />
ma<strong>in</strong>ly Corsican p<strong>in</strong>e (P<strong>in</strong>us nigra L.) <strong>and</strong> Scots p<strong>in</strong>e (P<strong>in</strong>us<br />
sylvestris L.). It <strong>in</strong>cludes a wide range <strong>of</strong> forest conditions with<br />
st<strong>and</strong>s differ<strong>in</strong>g <strong>in</strong> age <strong>and</strong> management history. The climate<br />
<strong>of</strong> the region is moist sub-humid, ra<strong>in</strong>y <strong>and</strong> mesothermal.<br />
Mean annual temperatures at the site are 2.5 °C <strong>in</strong> January <strong>and</strong><br />
14.3 °C <strong>in</strong> July, <strong>and</strong> mean annual precipitation is around<br />
850 mm. The soil is classified as Carbic Podsol (PZc) (median<br />
94% s<strong>and</strong>, 4% lime, 2% clay) with a thick litter layer (C varies<br />
between 16–63 Mg ha –1 ).<br />
The experimental Scots p<strong>in</strong>e st<strong>and</strong> <strong>of</strong> 2.49 ha (st<strong>and</strong> 49 <strong>in</strong><br />
Canton II, Kerselaren) was planted <strong>in</strong> 1936–1937, <strong>and</strong> consists<br />
<strong>of</strong> even-aged trees that were ± 65 years old at the time <strong>of</strong> our<br />
study. The orig<strong>in</strong>al, homogeneous stock<strong>in</strong>g density was high<br />
<strong>and</strong> the st<strong>and</strong> has been frequently th<strong>in</strong>ned, most recently <strong>in</strong><br />
1994. Stock<strong>in</strong>g density was 7353 trees ha –1 <strong>in</strong> 1964, 4167 trees<br />
ha –1 <strong>in</strong> 1970 <strong>and</strong> 959 trees ha –1 <strong>in</strong> 1988. As a result <strong>of</strong> w<strong>in</strong>dfall<br />
only 591 trees ha –1 rema<strong>in</strong>ed <strong>in</strong> the st<strong>and</strong> <strong>in</strong> 1992. After the last<br />
TREE PHYSIOLOGY VOLUME 25, 2005<br />
th<strong>in</strong>n<strong>in</strong>g <strong>in</strong> 1994, 320 trees ha –1 rema<strong>in</strong>ed. Canopy coverage<br />
(upward around the zenith) was about 55–60%. No significant<br />
understory was present.<br />
Destructive sampl<strong>in</strong>g: direct leaf area estimation<br />
Between October 1 <strong>and</strong> 11, 2002, measurements were made <strong>in</strong><br />
a 50 × 50-m plot near the st<strong>and</strong> center where edge effects were<br />
m<strong>in</strong>imal (Figure 1). Eighty Scots p<strong>in</strong>e trees between 60 <strong>and</strong> 65<br />
years old were sampled. Each tree was sequentially numbered<br />
as it was measured. Over-bark diameter at breast height<br />
(DBHb) <strong>of</strong> each tree was measured with a tree calliper, <strong>and</strong><br />
tree height <strong>and</strong> crown height were measured with a cl<strong>in</strong>ometer.<br />
Crown radius <strong>in</strong> the four card<strong>in</strong>al directions was determ<strong>in</strong>ed<br />
with the aid <strong>of</strong> a mirror mounted on a gimbal with a sight ensur<strong>in</strong>g<br />
a vertical reflection. The diameter measurements <strong>of</strong><br />
trees <strong>in</strong> the study plot were used to determ<strong>in</strong>e actual diameter<br />
distribution, which was <strong>in</strong> turn divided by stem-diameter class<br />
<strong>in</strong>to six quantiles each represent<strong>in</strong>g approximately the same<br />
Figure 1. (A) Location <strong>of</strong> the plot where leaves were sampled destructively<br />
for the direct estimation leaf area <strong>and</strong> (B) the nondestructive<br />
sampl<strong>in</strong>g scheme for <strong>optical</strong> <strong>LAI</strong> measurements <strong>in</strong> the Scots p<strong>in</strong>e<br />
st<strong>and</strong> <strong>in</strong> Pijnven Forest, Hechtel-Eksel, Belgium.<br />
Downloaded from<br />
http://treephys.oxfordjournals.org/ by guest on December 6, 2012
ALLOMETRY AND EVALUATION OF OPTICAL <strong>LAI</strong> DETERMINATION 725<br />
Table 2. Detailed forest <strong>in</strong>ventory for the six quantiles <strong>of</strong> trees <strong>in</strong> the experimental Scots p<strong>in</strong>e st<strong>and</strong> <strong>in</strong> Pijnven Forest, Hechtel-Eksel, Belgium. The<br />
overall st<strong>and</strong> mean <strong>and</strong> total values for all classes <strong>of</strong> the st<strong>and</strong> are also given. Values are based on observations <strong>in</strong> the 0.25-ha study plot <strong>and</strong> are expressed<br />
on a per hectare basis. Abbreviation: DBH = diameter at breast height (1.3-m high).<br />
Class DBH range Frequency Mean DBH Mean basal Mean height Height <strong>of</strong> crown<br />
(cm) (ha –1 ) (cm) area (m 2 ) (m) base (m)<br />
1 17–23 52 19.5 0.03 16.2 11.0<br />
2 23–24 52 23.0 0.04 17.5 11.7<br />
3 24–26 56 24.5 0.05 17.9 11.4<br />
4 26–28 56 26.5 0.06 18.5 11.3<br />
5 28–30 48 28.5 0.07 18.9 12.4<br />
6 30–39 52 37.5 0.11 20.1 12.2<br />
St<strong>and</strong> mean 26.29 0.06 18.2 11.7<br />
Total 316 17.41<br />
number <strong>of</strong> trees. Detailed forest <strong>in</strong>ventory data for the six<br />
DBH classes are presented <strong>in</strong> Table 2. Stock<strong>in</strong>g density was<br />
316 trees ha –1 <strong>and</strong> the st<strong>and</strong> had a basal area <strong>of</strong> 17.41 m 2 ha –1 .<br />
Mean diameter <strong>of</strong> all trees at breast height (DBH) was 26.29 ±<br />
4.14 (mean ± SE) <strong>and</strong> mean canopy height was 18 m ± 2 m<br />
(mean ± SE).<br />
Six Scots p<strong>in</strong>e trees, one for each diameter class, with the<br />
mean class diameter, were selected as a representative<br />
subsample <strong>of</strong> the st<strong>and</strong> for destructive measurements.<br />
Dendrometric data <strong>of</strong> the sample trees are summarized <strong>in</strong> Table<br />
3.<br />
Because leaf area <strong>and</strong> mass vary with<strong>in</strong> the tree crown<br />
(Kershaw <strong>and</strong> Maguire 1995), we divided the live crown <strong>of</strong><br />
each sample tree <strong>in</strong>to three strata <strong>of</strong> equal depth (Temesgen<br />
2003, Bartel<strong>in</strong>k 1996). For every first-order branch on the tree,<br />
height above ground <strong>and</strong> diameter at 4 cm from the junction<br />
with the stem were measured (Battaglia et al. 1998). Sample<br />
branches were selected at r<strong>and</strong>om, the number from each stratum<br />
be<strong>in</strong>g proportional to the total number <strong>of</strong> branches <strong>in</strong> that<br />
stratum. Three to five first-order branches were excised per<br />
tree <strong>and</strong> the relationship between branch basal diameter <strong>and</strong><br />
needle surface area determ<strong>in</strong>ed (Küßner <strong>and</strong> Mos<strong>and</strong>l 2000).<br />
High branches were accessed with a cherry picker.<br />
Freshly cut branches were placed <strong>in</strong> plastic bags <strong>and</strong> stored<br />
at 4 °C. Branch needle area was determ<strong>in</strong>ed by r<strong>and</strong>om subsampl<strong>in</strong>g<br />
from all age cohorts. Branches were subsequently<br />
Table 3. Dendrometric data for the six Scots p<strong>in</strong>e sample trees that<br />
were destructively sampled at the study plot <strong>in</strong> Pijnven Forest,<br />
Hechtel-Eksel, Belgium. Abbreviation: DBHb = over-bark diameter<br />
at breast height (DBHb).<br />
<strong>Tree</strong> No. DBHb Basal Total Height <strong>of</strong><br />
(cm) area (m 2 ) height (m) crown base<br />
(m)<br />
1 21.7 0.037 18.1 13.0<br />
2 23.8 0.044 20.4 13.4<br />
3 25.0 0.050 18.7 11.6<br />
4 26.4 0.055 19.4 12.8<br />
5 28.0 0.062 18.3 12.1<br />
6 31.8 0.080 16.6 14.6<br />
TREE PHYSIOLOGY ONLINE at http://heronpublish<strong>in</strong>g.com<br />
dried for 72 h at 40 °C <strong>and</strong> then to constant mass at 80 °C<br />
(Èermák <strong>and</strong> Michalek 1991). Small branches with needles<br />
were dried <strong>in</strong> paper bags for 1 to 5 days, after which twigs were<br />
separated <strong>and</strong> removed. The dried needles were weighed to the<br />
nearest 0.1 mg. Projected leaf area (the vertical projection <strong>of</strong><br />
needles; PLA) <strong>of</strong> each sample was measured with a semi-automatic<br />
<strong>optical</strong> planimeter (LI-3100, Li-Cor).<br />
Branch- <strong>and</strong> tree-level leaf area (LA) were related by a<br />
three-step regression procedure. First, regression equations<br />
were developed for needle dry mass, or area, versus the diameter<br />
<strong>of</strong> primary branches. Second, with the branch diameter versus<br />
needle dry mass regression equations, we estimated<br />
whole-crown needle dry mass <strong>and</strong> needle area. Third, regression<br />
equations were developed for estimated crown needle<br />
mass <strong>and</strong> area versus DBH.<br />
For up-scal<strong>in</strong>g <strong>of</strong> leaf area to the branch <strong>and</strong> tree levels, we<br />
evaluated the follow<strong>in</strong>g least square equations: the Gaussian,<br />
Log-normal, L<strong>in</strong>ear, Polynomial, Power <strong>and</strong> Rayleigh (Müller<br />
1983, Table 4). All statistical analyses were performed with<br />
SAS s<strong>of</strong>tware (SAS version 8.2, SAS Institute, Cary, NC).<br />
Optical measurement <strong>of</strong> leaf area <strong>in</strong>dex<br />
We estimated <strong>LAI</strong> <strong>in</strong>directly at the st<strong>and</strong> level with two purpose-built<br />
<strong>optical</strong> <strong>in</strong>struments, the <strong>LAI</strong>-2000 (Li-Cor) <strong>and</strong> the<br />
TRAC (Trac<strong>in</strong>g Radiation <strong>and</strong> Architecture <strong>of</strong> Canopies,<br />
Third Wave Eng<strong>in</strong>eer<strong>in</strong>g, Ottawa, ON, Canada) <strong>and</strong> by digital<br />
hemispherical canopy photography (DHP). All measurements<br />
were made with<strong>in</strong> 7 days <strong>of</strong> branch harvest. To provide adequate<br />
<strong>LAI</strong>-2000 measurements <strong>and</strong> hemispherical photographs<br />
for the st<strong>and</strong>, a grid <strong>of</strong> 30 sample po<strong>in</strong>ts (five rows at<br />
30, 50, 70, 90 <strong>and</strong> 110 m; six po<strong>in</strong>ts per row at 30, 53, 76, 99,<br />
122 <strong>and</strong> 145 m) was established (Figure 1). The TRAC measurements<br />
were made along five parallel transects, perpendicular<br />
to the sun’s position. Stakes were located every 10 m<br />
along each transect. The TRAC measurements were acquired<br />
dur<strong>in</strong>g the afternoon <strong>of</strong> October 7, 2002, with the view zenith<br />
angle at about 57.5°.<br />
Measurements with the <strong>LAI</strong>-2000 With the <strong>LAI</strong>-2000 we simultaneously<br />
measured diffuse solar radiation below <strong>and</strong><br />
above the canopy. The <strong>in</strong>strument has a fisheye light sensor divided<br />
<strong>in</strong>to five concentric r<strong>in</strong>gs, with mid-po<strong>in</strong>t zenith angles at<br />
Downloaded from<br />
http://treephys.oxfordjournals.org/ by guest on December 6, 2012
726 JONCKHEERE, MUYS AND COPPIN<br />
Table 4. Regression models used to establish allometric equations <strong>in</strong><br />
the experimental Scots p<strong>in</strong>e st<strong>and</strong> <strong>in</strong> Pijnven Forest, Hechtel-Eksel,<br />
Belgium.<br />
Regression Equation<br />
Logarithmic lny = a + bln x<br />
(10)<br />
Gaussian<br />
−b( x−c) y = ae 2<br />
(11)<br />
Log-normal<br />
2<br />
( −(ln( b−x) −c)<br />
/ 4)<br />
y = a/( b − x) e<br />
(12)<br />
Rayleigh<br />
x b c<br />
y = a −e − ( / )<br />
( 1 )<br />
(13)<br />
Power y ax b<br />
= (14)<br />
Polynomial<br />
2<br />
y = ax + bx+ c<br />
(15)<br />
L<strong>in</strong>ear y = ax+ b<br />
(16)<br />
7, 23, 38, 53 <strong>and</strong> 68°. A built-<strong>in</strong> <strong>optical</strong> filter blocked <strong>in</strong>com<strong>in</strong>g<br />
radiation with wavelengths above 490 nm, to ensure maximum<br />
contrast between leaf <strong>and</strong> sky. A reference measurement was<br />
taken <strong>in</strong> an open area directly before <strong>and</strong> after the po<strong>in</strong>t measurements<br />
to estimate above-canopy irradiance. A 90° view<br />
lens cap blocked the <strong>in</strong>vestigator from the field <strong>of</strong> view. Leaf<br />
area <strong>in</strong>dex was automatically calculated by the built-<strong>in</strong> C2000<br />
s<strong>of</strong>tware (Li-Cor 1992), based on <strong>in</strong>version <strong>of</strong> the Poisson light<br />
ext<strong>in</strong>ction model for compar<strong>in</strong>g transmittances. The ext<strong>in</strong>ction<br />
model is based on four assumptions: (1) foliage is an <strong>optical</strong><br />
black body that absorbs all the light it receives; (2) light-block<strong>in</strong>g<br />
plant elements are r<strong>and</strong>omly distributed <strong>in</strong> the canopy; (3)<br />
plant elements have the same projection as simple geometrical<br />
convex shapes; <strong>and</strong> (4) plant elements are small compared to<br />
the area covered by each r<strong>in</strong>g. Additional <strong>in</strong>formation on the<br />
operational theory <strong>of</strong> the <strong>in</strong>strument has been given by Welles<br />
<strong>and</strong> Norman (1991) <strong>and</strong> Jonckheere et al. (2004).<br />
Measurements with TRAC The TRAC <strong>in</strong>strument measures<br />
the gap fraction at the solar zenith angle. Specifically, TRAC<br />
measures the photosynthetic photon flux (PPF) through a canopy<br />
(Chen <strong>and</strong> Cihlar 1995). The <strong>in</strong>strument is carried by a person<br />
walk<strong>in</strong>g at a rate <strong>of</strong> about 0.3 m s –1 , <strong>and</strong> accounts for both<br />
canopy gap fraction <strong>and</strong> canopy gap size distribution. The measured<br />
gap fraction is used to estimate effective <strong>LAI</strong> (<strong>LAI</strong> e), <strong>and</strong><br />
the gap size distribution is used to estimate the element-clump<strong>in</strong>g<br />
<strong>in</strong>dex (Ωe).<br />
The value <strong>of</strong> Ωe, which quantifies the effects <strong>of</strong> nonr<strong>and</strong>om<br />
spatial distribution <strong>of</strong> foliage, was obta<strong>in</strong>ed by compar<strong>in</strong>g the<br />
measured gap size distribution with a theoretical gap size distribution<br />
associated with a canopy hav<strong>in</strong>g r<strong>and</strong>omly distributed<br />
foliage elements (Chen <strong>and</strong> Cihlar 1995). The value <strong>of</strong> Ωe<br />
depends on the leaf <strong>in</strong>cl<strong>in</strong>ation angle (G-function), which <strong>in</strong><br />
turn varies with the view angle. However, for a view angle <strong>of</strong><br />
57.5°, G ≅ 0.5 <strong>and</strong> can be considered <strong>in</strong>dependent <strong>of</strong> leaf <strong>in</strong>cl<strong>in</strong>ation.<br />
Therefore, by keep<strong>in</strong>g the solar radiation angle constant<br />
at 57.5°, Ωe <strong>and</strong> <strong>LAI</strong> e values for the st<strong>and</strong> can be obta<strong>in</strong>ed<br />
with TRAC alone (Leblanc et al. 2002).<br />
Measur<strong>in</strong>g <strong>LAI</strong> by hemispherical photography To estimate<br />
<strong>LAI</strong> by digital hemispherical photography, images <strong>of</strong> the canopy<br />
are acquired from below through a hemispherical (fisheye)<br />
lens with a 180° field <strong>of</strong> view. Leaf area <strong>in</strong>dex is computed from<br />
TREE PHYSIOLOGY VOLUME 25, 2005<br />
the hemispherical photographs from gap fraction estimates <strong>in</strong><br />
different zenithal <strong>and</strong> azimuthal ranges. We used a Kodak DCS<br />
660 digital camera (Eastman Kodak, New York, NY) with an<br />
8-mm fisheye lens (8 mm, f/4, Sigma, Tokyo, Japan). The camera<br />
<strong>and</strong> lens were placed <strong>in</strong> a self-level<strong>in</strong>g mount oriented by<br />
corner p<strong>in</strong>s on a tripod. The top <strong>of</strong> the lens was 1.3 m above<br />
ground <strong>and</strong> the camera was oriented such that the magnetic<br />
north was always located at the top <strong>of</strong> the photographs. Photographs<br />
were taken dur<strong>in</strong>g overcast conditions to m<strong>in</strong>imize<br />
glare from direct sunlight.<br />
For every grid po<strong>in</strong>t, six photographs were taken with an aperture<br />
<strong>of</strong> f/8 at five shutter speeds (1/60, 1/125, 1/250, 1/500<br />
<strong>and</strong> 1/1000 s) <strong>and</strong> at the highest possible resolution, i.e., 3040<br />
× 2008 pixels. The photograph result<strong>in</strong>g <strong>in</strong> the best contrast<br />
between sky <strong>and</strong> canopy was selected visually from these<br />
bracketed exposures. A total <strong>of</strong> 30 photographs provided <strong>in</strong>put<br />
for analysis by the Gap Light Analyzer (GLA) s<strong>of</strong>tware which<br />
computes gap fraction data <strong>and</strong> <strong>LAI</strong> (Frazer et al. 1999, Frazer<br />
et al. 2001). First, a threshold value was <strong>in</strong>teractively selected<br />
for each photograph to dist<strong>in</strong>guish between visible sky <strong>and</strong> foliage,<br />
thereby convert<strong>in</strong>g the RGB color images to black <strong>and</strong><br />
white. The border can be difficult to estimate because <strong>of</strong> the<br />
penumbral effect; therefore, all photographs were analyzed by<br />
the same experienced operator to reduce variation (Beaudet<br />
<strong>and</strong> Messier 2002). To compare <strong>LAI</strong> estimates from the hemispherical<br />
photography technique with the <strong>LAI</strong>-2000 results,<br />
gap fractions from the photographs were similarly separated <strong>in</strong><br />
five zenith r<strong>in</strong>gs from 0–75°. The five zenith r<strong>in</strong>gs were divided<br />
<strong>in</strong>to sky sectors by 10° azimuth angles (36 azimuth sectors).<br />
In a second step, <strong>LAI</strong> e was calculated for each<br />
photograph from the gap fraction data obta<strong>in</strong>ed by <strong>in</strong>version <strong>of</strong><br />
the Poisson model us<strong>in</strong>g 4 <strong>and</strong> 5 r<strong>in</strong>gs, represent<strong>in</strong>g 0–60° <strong>and</strong><br />
0–75°, respectively (Stenberg et al. 1994). The s<strong>of</strong>tware takes<br />
terra<strong>in</strong> corrections, based on local aspect <strong>in</strong>puts <strong>and</strong> lens corrections,<br />
<strong>in</strong>to account. As <strong>in</strong>put to the GLA program, data for<br />
the terra<strong>in</strong> corrections were gathered <strong>in</strong> the field <strong>and</strong> data for<br />
the lens correction were supplied by Sigma. We then converted<br />
<strong>LAI</strong> e to corrected <strong>LAI</strong> by correct<strong>in</strong>g for clump<strong>in</strong>g <strong>and</strong> nonleafy<br />
material.<br />
Foliage clump<strong>in</strong>g Estimates <strong>of</strong> <strong>LAI</strong> acquired by <strong>optical</strong> techniques<br />
are based on light <strong>in</strong>terception by both foliage <strong>and</strong><br />
stems, <strong>and</strong> assume a r<strong>and</strong>om foliage distribution (Chen <strong>and</strong><br />
Cihlar 1995). The result<strong>in</strong>g <strong>in</strong>dex is therefore considered to be<br />
the effective leaf area <strong>in</strong>dex (<strong>LAI</strong> e) (Chen et al. 1991). Consequently,<br />
when convert<strong>in</strong>g <strong>LAI</strong> e to <strong>LAI</strong> it is necessary to correct<br />
both for light obstruction from non-leafy canopy material <strong>and</strong><br />
for the effects <strong>of</strong> foliage clump<strong>in</strong>g. Foliage clump<strong>in</strong>g occurs<br />
mostly at the shoot level <strong>in</strong> conifers (Stenberg et al. 1994). Foliage<br />
clump<strong>in</strong>g also occurs at the branch <strong>and</strong> crown levels for<br />
most forest types (Chen <strong>and</strong> Black 1992), as a result <strong>of</strong> branch<strong>in</strong>g<br />
patterns <strong>and</strong> irregular tree distribution (Chen et al. 1997).<br />
We applied several corrections to <strong>in</strong>vestigate the <strong>in</strong>fluence <strong>of</strong><br />
clump<strong>in</strong>g at the shoot, branch <strong>and</strong> tree levels on the conversion<br />
<strong>of</strong> <strong>LAI</strong> e measured <strong>optical</strong>ly to corrected <strong>LAI</strong>.<br />
Shoot-level clump<strong>in</strong>g We corrected for clump<strong>in</strong>g at the shoot<br />
level based on the method <strong>of</strong> Gower <strong>and</strong> Norman (1991), which<br />
Downloaded from<br />
http://treephys.oxfordjournals.org/ by guest on December 6, 2012
determ<strong>in</strong>es shoot clump<strong>in</strong>g as the ratio <strong>of</strong> the projected area <strong>of</strong><br />
the needles with<strong>in</strong> the shoot to the vertically projected shoot<br />
area. This technique was further developed by Fassnacht et al.<br />
(1994) <strong>and</strong> corrected by Chen (1996) to <strong>in</strong>clude a greater number<br />
<strong>of</strong> shoot projections for the calculation <strong>of</strong> needle-to-shootarea<br />
ratio, γe. The shoot area is <strong>in</strong>terpreted as the imag<strong>in</strong>ary surface<br />
area <strong>of</strong> a sphere envelop<strong>in</strong>g the leaf-clump <strong>and</strong> is calculated<br />
as a weighted mean ratio <strong>of</strong> the projected shoot silhouette<br />
area (Ap) for different projection angles. Chen (1996) found<br />
good agreement between results <strong>of</strong> shoot analysis for three projection<br />
(camera <strong>in</strong>cidence) angles <strong>and</strong> shoot analysis for 21 <strong>and</strong><br />
39 projection angles, respectively, <strong>and</strong> thus recommended the<br />
use <strong>of</strong> the method by which each shoot from a calibration sample<br />
is imaged <strong>and</strong> analyzed from three camera <strong>in</strong>cidence angles<br />
to estimate the correction parameter (Chen 1996):<br />
with:<br />
<strong>LAI</strong>c = <strong>LAI</strong>eγ<br />
e<br />
(1)<br />
γ e = An/ As<br />
(2)<br />
A<br />
s<br />
(0 ° , 0 ° )cos (15 ° ) (45 ° ,0 ° )cos (45 ° ) (90 ° , 0 ° )cos(75 ° )<br />
A p + A p + A p<br />
= 2<br />
cos(15 ° ) + cos(45 ° ) + cos(75 ° )<br />
where <strong>LAI</strong> c is <strong>LAI</strong> corrected for shoot-level clump<strong>in</strong>g, <strong>LAI</strong> e is<br />
effective <strong>LAI</strong> as estimated by the <strong>optical</strong> devices, γe is the ratio<br />
<strong>of</strong> needle-to-shoot area, An is half the total needle area for all<br />
the needles <strong>of</strong> a shoot, As is half the total shoot imag<strong>in</strong>ary surface<br />
area, <strong>and</strong> Ap (θ, φ) is the projected area for given angles <strong>of</strong><br />
θ <strong>and</strong> φ, where θ <strong>and</strong> φ are the azimuth <strong>and</strong> zenith projection<br />
angles <strong>in</strong> relation to the ma<strong>in</strong> axis <strong>of</strong> the shoot, respectively.<br />
Ten <strong>in</strong>tact shoot samples were taken from each model tree<br />
<strong>and</strong> different model branches to obta<strong>in</strong> the with<strong>in</strong>-shoot clump<strong>in</strong>g<br />
factor. Half the total needle area <strong>in</strong> the shoot (An) was<br />
measured as the projected area <strong>of</strong> needles multiplied by a correction<br />
factor dependent on the hemi-cyl<strong>in</strong>drical shape <strong>of</strong> the<br />
needles. Projected area for the needles <strong>of</strong> the shoots was determ<strong>in</strong>ed<br />
with a Li-Cor planimeter, <strong>and</strong> the correction factor <strong>of</strong><br />
1+π/2 (Bond-Lamberty et al. 2003) was applied. The imag<strong>in</strong>ary<br />
shoot area was obta<strong>in</strong>ed from the projected shoot area<br />
(Ap) at three view<strong>in</strong>g angles (0, 45 <strong>and</strong> 90°) with a Kodak DCS<br />
660 digital camera. The correspond<strong>in</strong>g images were digitally<br />
analyzed accord<strong>in</strong>g to the methodology developed by Chen<br />
(1996) to assess the shoot silhouette area. Mean γe (= 2.001)<br />
was calculated as the arithmetic mean <strong>of</strong> the shoot samples.<br />
St<strong>and</strong>-level clump<strong>in</strong>g To correct for clump<strong>in</strong>g with<strong>in</strong> a st<strong>and</strong><br />
at all scales greater than the shoot, <strong>in</strong>clud<strong>in</strong>g with<strong>in</strong>-crown<br />
clump<strong>in</strong>g, Ωe was obta<strong>in</strong>ed from TRAC (Leblanc 2002) as:<br />
Ω e<br />
⎛ ( Fm − Fmr)<br />
⎞ lnF<br />
= ⎜1<br />
+ ⎟<br />
⎝ 1−<br />
F ⎠ lnF<br />
m<br />
ALLOMETRY AND EVALUATION OF OPTICAL <strong>LAI</strong> DETERMINATION 727<br />
where Fm is the measured total canopy gap fraction <strong>and</strong> Fmr is<br />
the gap fraction <strong>of</strong> an imag<strong>in</strong>ary canopy with the same <strong>LAI</strong> as<br />
the clumped canopy, but where the foliage elements are considered<br />
spatially r<strong>and</strong>om. We measured Fm with TRAC along<br />
transects <strong>in</strong> the st<strong>and</strong> on October 7, 2002, (see Figure 1 for<br />
m<br />
mr<br />
(3)<br />
(4)<br />
sampl<strong>in</strong>g strategy) as the transmittance <strong>of</strong> direct or diffused radiation<br />
at the zenith angle <strong>of</strong> 57.5°. We derived Fmr from the<br />
measured gap size distribution by a gap removal approach. All<br />
transects were analyzed with the TRACW<strong>in</strong> s<strong>of</strong>tware provided<br />
with the <strong>in</strong>strument. The calculated value for Ωe was 0.836.<br />
We calculated <strong>LAI</strong>B as (Chen <strong>and</strong> Cihlar 1995):<br />
<strong>LAI</strong> = <strong>LAI</strong> / Ω<br />
(5)<br />
B e e<br />
where <strong>LAI</strong> B is <strong>LAI</strong> corrected for branch- <strong>and</strong> tree-level clump<strong>in</strong>g<br />
<strong>and</strong> <strong>LAI</strong> e is the effective <strong>LAI</strong> as estimated by the <strong>optical</strong><br />
devices.<br />
Plant area <strong>in</strong>dex To correct for clump<strong>in</strong>g at the with<strong>in</strong>-shoot<br />
<strong>and</strong> above-shoot levels <strong>and</strong> account for the contribution <strong>of</strong><br />
non-photosynthetic components <strong>of</strong> the canopy <strong>in</strong> the <strong>optical</strong><br />
measurements, we calculated the <strong>LAI</strong> associated specifically<br />
with foliage (<strong>LAI</strong>F) as did Chen et al. (1997):<br />
<strong>LAI</strong><br />
F<br />
( 1 − α) <strong>LAI</strong> γ<br />
=<br />
Ω<br />
e<br />
e e<br />
where <strong>LAI</strong> F is <strong>LAI</strong> corrected for with<strong>in</strong>-shoot <strong>and</strong> above-shoot<br />
level clump<strong>in</strong>g <strong>and</strong> α is the woody-to-total area ratio. The<br />
value <strong>of</strong> α was derived from destructive sampl<strong>in</strong>g (Chen et al.<br />
1997): α = W/<strong>LAI</strong>total, where W is the woody area <strong>in</strong>dex <strong>and</strong><br />
<strong>LAI</strong>total is the total <strong>LAI</strong> from woody <strong>and</strong> green foliar material<br />
comb<strong>in</strong>ed.<br />
Our calculation <strong>of</strong> α was based on <strong>in</strong> <strong>situ</strong> measurements <strong>of</strong><br />
foliage <strong>and</strong> woody area per tree, derived from destructive measurements<br />
<strong>of</strong> the branches <strong>and</strong> measured total tree height,<br />
bole length, crown dimensions <strong>and</strong> crown length, <strong>and</strong> plotted<br />
aga<strong>in</strong>st DBH. We applied these relationships to determ<strong>in</strong>e the<br />
mean α <strong>of</strong> the whole st<strong>and</strong> <strong>and</strong> obta<strong>in</strong>ed a value <strong>of</strong> 0.18, which<br />
is consistent with the analysis <strong>of</strong> the digital hemispherical images,<br />
where the amount <strong>of</strong> woody material was estimated by<br />
means <strong>of</strong> image classification, assum<strong>in</strong>g the stems <strong>and</strong><br />
branches seen on the photographs were simple cone shapes<br />
(Barclay et al. 2000).<br />
Results<br />
TREE PHYSIOLOGY ONLINE at http://heronpublish<strong>in</strong>g.com<br />
Allometric relationships<br />
Allometric relationships at the branch <strong>and</strong> tree levels Regression<br />
equations at the branch <strong>and</strong> tree levels were derived from<br />
measurements <strong>of</strong> the six experimental trees (Table 5). The relationships<br />
<strong>in</strong> Table 5 are the best fits <strong>of</strong> the fitted regressions <strong>and</strong><br />
were <strong>in</strong> all cases significant at P < 0.001. They were applied <strong>in</strong><br />
this study to calculate canopy cover <strong>and</strong> PLA at the st<strong>and</strong> level<br />
(Table 5). Allometric relationships between tree height <strong>and</strong><br />
bole length <strong>and</strong> between tree height <strong>and</strong> tree diameter were established<br />
by means <strong>of</strong> the Rayleigh equation (Table 6).<br />
At the branch level, a good relationship was found between<br />
branch cross-sectional area <strong>and</strong> needle leaf area (as well as<br />
needle dry mass) (r 2 ≥ 0.80) (Figure 2). In agreement with<br />
other studies (e.g., Mencucc<strong>in</strong>i <strong>and</strong> Grace 1995), significant<br />
regression relationships were found at the tree level between<br />
basal area <strong>and</strong> DBH as <strong>in</strong>dependent variables, <strong>and</strong> needle area,<br />
(6)<br />
Downloaded from<br />
http://treephys.oxfordjournals.org/ by guest on December 6, 2012
728 JONCKHEERE, MUYS AND COPPIN<br />
Table 5. Allometric relationships for Scots p<strong>in</strong>e branches, trees <strong>and</strong> st<strong>and</strong> at Hechtel-Eksel, Belgium, based on the destructive sampl<strong>in</strong>g <strong>of</strong> six sample<br />
trees. Abbreviations: DM = dry mass; <strong>and</strong> DBH = diameter at breast height.<br />
Variables Regression equation r 2<br />
Branch<br />
x = Branch cross-sectional area (cm 2 )<br />
y = Needle area (m 2 branch –1 ) y = 15.543x 0.9906<br />
y = Needle DM (kg branch –1 ) y = 29.908x 0.6604<br />
<strong>Tree</strong><br />
x = DBH (cm)<br />
y = Needle area (m 2 tree –1 ) y = 0.2988x 2 – 7.5336x + 74.075 0.94<br />
y = Crown projected area (m 2 tree –1 ) y = 0.0066x 2 + 0.2115x 0.88<br />
y = Needle DM (kg tree –1 ) y = –0.001x 2 + 0.0527x – 0.4586 0.95<br />
St<strong>and</strong><br />
x = Basal area (m 2 )<br />
y = Needle area (m 2 ha –1 ) y = 5791.9x 2 + 1344.7x – 7.1147 0.94<br />
y = Crown projected area (m 2 ha –1 ) y = – 492.83x 2 + 173.86x 0.84<br />
y = Needle DM (kg ha –1 ) y = 23.036x 2 + 204.42x 0.91<br />
y = Number <strong>of</strong> needles (thous<strong>and</strong> ha –1 ) y = 1.789x (x <strong>in</strong> cm 2 ) 0.95<br />
needle dry mass <strong>and</strong> crown projected area as dependent variables<br />
(Figure 3).<br />
St<strong>and</strong>-level canopy coverage estimate Regression equations<br />
between DBH <strong>and</strong> basal area <strong>and</strong> between DBH <strong>and</strong> crown<br />
projected area <strong>of</strong> the trees (Table 5) were used to estimate the<br />
ground projection area <strong>of</strong> the average tree from all DBH<br />
classes, <strong>and</strong> these values were then used to scale up the crown<br />
projection <strong>of</strong> the <strong>in</strong>dividual trees to the entire st<strong>and</strong> to obta<strong>in</strong> an<br />
estimate <strong>of</strong> canopy coverage at the st<strong>and</strong> level. Canopy cover<br />
calculated based on the DBH versus basal area <strong>and</strong> DBH versus<br />
crown projected area regressions yielded values <strong>of</strong> 0.37 <strong>and</strong><br />
0.44, respectively. Because these allometric estimates <strong>of</strong> canopy<br />
cover (<strong>in</strong>clud<strong>in</strong>g with<strong>in</strong>-crown gaps) are lower than the visual<br />
estimate <strong>of</strong> canopy cover (55–60%), we calculated canopy<br />
cover from hemispherical photographs as described by<br />
Soudani et al. (2002). The photographs gave a mean canopy<br />
cover <strong>of</strong> 61% for the st<strong>and</strong>, which is <strong>in</strong> good agreement with the<br />
visual estimate <strong>of</strong> coverage. Consequently, we concluded our<br />
crown radius was underestimated by our allometric regression<br />
equations. The subsampl<strong>in</strong>g <strong>of</strong> the six trees may have been <strong>in</strong>sufficient<br />
to account for the high variability <strong>in</strong> crown projection<br />
area <strong>in</strong> the st<strong>and</strong>. These regression equations were therefore not<br />
used to calculate st<strong>and</strong>-level <strong>LAI</strong>.<br />
St<strong>and</strong>-level <strong>LAI</strong> estimates Based on the regression equations<br />
<strong>in</strong> Table 5, empirical values <strong>of</strong> projected needle area, obta<strong>in</strong>ed<br />
Table 6. Regression equations (Equation 13; Rayleigh equation) for<br />
the relationship between tree height (both for total height <strong>and</strong> bole<br />
length) <strong>and</strong> stem diameter at breast height (DBH) for Scots p<strong>in</strong>e trees.<br />
Variables Regression equation<br />
x =DBH,y = bole length y = 12.27(1 – e –x /5.05 ) 7.66<br />
x = DBH, y = total height y = 29.96(1 – e –x / 39.34 ) 0.69<br />
TREE PHYSIOLOGY VOLUME 25, 2005<br />
0.86<br />
0.83<br />
by measur<strong>in</strong>g detached needles directly with an <strong>optical</strong> planimeter,<br />
were calculated as functions <strong>of</strong> DBH <strong>and</strong> basal area. Total<br />
projected needle area (PLA) for the st<strong>and</strong> was then<br />
calculated by apply<strong>in</strong>g the relationship between DBH <strong>and</strong> projected<br />
needle area:<br />
2<br />
y = 02988 . x − 75336 . x + 74. 075<br />
(7)<br />
or by apply<strong>in</strong>g the equation l<strong>in</strong>k<strong>in</strong>g basal area <strong>and</strong> projected<br />
needle area:<br />
2<br />
y = 5791.9x + 1344.7x – 71147 . (8)<br />
From Equations 7 <strong>and</strong> 8 we obta<strong>in</strong>ed st<strong>and</strong>-level PLA values<br />
<strong>of</strong> 2.77 <strong>and</strong> 2.74, respectively.<br />
To make a reliable comparison <strong>of</strong> the projected needle area<br />
with estimates <strong>of</strong> <strong>LAI</strong> from <strong>optical</strong> methods, hemi-surface leaf<br />
area (HSLA), def<strong>in</strong>ed as one half the total surface area (Chen<br />
Figure 2. Relationship between needle area <strong>and</strong> branch diameter for<br />
Scots p<strong>in</strong>e <strong>in</strong> Pijnven Forest, Hechtel-Eksel, Belgium. The solid l<strong>in</strong>e<br />
represents the needle area per branch (cm 2 ) based on a simple regression<br />
with branch diameter as the <strong>in</strong>dependent variable ( y =<br />
15.543x 0.9906 ; r 2 = 0.86; n = 23).<br />
Downloaded from<br />
http://treephys.oxfordjournals.org/ by guest on December 6, 2012
et al. 1997), was calculated from PLA based on assumptions<br />
about the cross-sectional needle geometry (Br<strong>and</strong> 1987,<br />
Bond-Lamberty et al. 2003). The cross section <strong>of</strong> a Scots p<strong>in</strong>e<br />
needle was assumed to be hemicyl<strong>in</strong>drical with the ratio <strong>of</strong> the<br />
major to m<strong>in</strong>or axis be<strong>in</strong>g equal to one. The assumptions about<br />
the geometry <strong>of</strong> Scots p<strong>in</strong>e needles were verified based on<br />
analysis <strong>of</strong> needles from a r<strong>and</strong>om sample <strong>of</strong> all age cohorts<br />
from the sample trees. Given the total measured needle projected<br />
area <strong>and</strong> the cross-sectional shape <strong>of</strong> r<strong>and</strong>omly oriented<br />
Scots p<strong>in</strong>e needles, the surface area can be calculated <strong>and</strong> divided<br />
by 2 to yield HSLA (Chen et al. 1997):<br />
⎛ 1+ π / 2 ⎞<br />
HSLA = ⎜ ⎟PLA<br />
⎝ 2 ⎠<br />
ALLOMETRY AND EVALUATION OF OPTICAL <strong>LAI</strong> DETERMINATION 729<br />
Figure 3. Relationship between total needle area per tree <strong>and</strong> diameter<br />
at breast height (DBH) for Scots p<strong>in</strong>e <strong>in</strong> Pijnven Forest, Hechtel-<br />
Eksel, Belgium. The solid l<strong>in</strong>e represents the up-scaled needle area<br />
per tree (m 2 ) based on a simple regression with DBH as the <strong>in</strong>dependent<br />
variable ( y = 0.2988x 2 – 7.5336x + 74.075; r 2 = 0.94; n =6).<br />
The HSLA equalled 3.57 <strong>and</strong> 3.53 for the <strong>LAI</strong> estimates<br />
based on DBH <strong>and</strong> basal area, respectively.<br />
Optical gap fraction <strong>and</strong> <strong>LAI</strong> measurements<br />
Gap fraction estimation Figure 4 shows the variation <strong>in</strong> mean<br />
gap fraction as a function <strong>of</strong> zenith angles, estimated with the<br />
<strong>LAI</strong>-2000 or from hemispherical photographs. The <strong>LAI</strong>-2000<br />
data showed an <strong>in</strong>crease <strong>in</strong> gap fraction from the zenith to the<br />
Figure 4. Mean gap fraction values obta<strong>in</strong>ed for the Scots p<strong>in</strong>e st<strong>and</strong> at<br />
various zenith angles with an <strong>LAI</strong>-2000 plant canopy analyzer ( � )<br />
<strong>and</strong> with hemispherical photographs (with 36 azimuth sectors) (�).<br />
Symbols represent the mean <strong>and</strong> error bars represent the st<strong>and</strong>ard deviations<br />
<strong>of</strong> the respective measurements.<br />
(9)<br />
TREE PHYSIOLOGY ONLINE at http://heronpublish<strong>in</strong>g.com<br />
view<strong>in</strong>g angles <strong>in</strong> the third r<strong>in</strong>g, with a peak around the 40°<br />
view<strong>in</strong>g angle, after which the gap fraction decreased toward<br />
the horizon. Nilson <strong>and</strong> Kuusk (2004) recently reported that the<br />
gap fraction <strong>in</strong> the uppermost r<strong>in</strong>gs is frequently underestimated<br />
because the sampl<strong>in</strong>g po<strong>in</strong>ts are <strong>situ</strong>ated under tree<br />
crowns. The low gap fraction at near-zenith angles <strong>and</strong> the <strong>in</strong>crease<br />
between r<strong>in</strong>g 1 <strong>and</strong> r<strong>in</strong>g 3 is likely caused by the <strong>in</strong>stability<br />
<strong>of</strong> the <strong>in</strong>strument <strong>in</strong> the first two r<strong>in</strong>gs as well as by a<br />
position<strong>in</strong>g effect <strong>of</strong> the <strong>LAI</strong>-2000 caus<strong>in</strong>g a slightly different<br />
view <strong>of</strong> the canopy. The decrease <strong>in</strong> gap fraction with distance<br />
from the sampl<strong>in</strong>g po<strong>in</strong>t was attributed to <strong>in</strong>creas<strong>in</strong>gly dense<br />
foliage (<strong>and</strong> stems) toward the horizon. The <strong>LAI</strong>-2000 data<br />
also showed a regular decrease <strong>in</strong> data dispersion with <strong>in</strong>creas<strong>in</strong>g<br />
zenith angle. This agrees with expectations, because gap<br />
fraction values are highly variable especially <strong>in</strong> the uppermost<br />
r<strong>in</strong>g(s) because <strong>of</strong> <strong>in</strong>adequate spatial sampl<strong>in</strong>g (Nilson <strong>and</strong><br />
Kuusk 2004). These trends were less clear <strong>in</strong> the hemispherical<br />
photographs, perhaps reflect<strong>in</strong>g the higher <strong>in</strong>tra-variability<br />
among photographs, because the sky sectors used for gap fraction<br />
calculations were small. Nevertheless, discrepancies between<br />
the data sets from the <strong>LAI</strong>-2000 <strong>and</strong> hemispherical<br />
photographs were low, never exceed<strong>in</strong>g 5%.<br />
Leaf area <strong>in</strong>dex estimation Mean st<strong>and</strong>-level <strong>LAI</strong> (<strong>LAI</strong> st<strong>and</strong>)<br />
values from both tree allometry <strong>and</strong> the various <strong>in</strong>direct <strong>optical</strong><br />
methods are shown <strong>in</strong> Table 7. To <strong>in</strong>vestigate the <strong>in</strong>fluence <strong>of</strong><br />
clump<strong>in</strong>g at the shoot, branch <strong>and</strong> tree levels <strong>and</strong> the <strong>in</strong>fluence<br />
<strong>of</strong> non-leafy material on <strong>LAI</strong> measurements, three methods<br />
were used to correct the <strong>LAI</strong> e estimates based on measurements<br />
with the <strong>optical</strong> devices. As expected, the <strong>LAI</strong> estimates<br />
based on <strong>in</strong>direct <strong>optical</strong> measurements were lower than the direct<br />
<strong>LAI</strong> estimates. Agreement between <strong>LAI</strong> values estimated<br />
by direct <strong>and</strong> <strong>in</strong>direct methods <strong>in</strong>creased substantially when<br />
only the four central sky sectors were considered, <strong>in</strong>dicat<strong>in</strong>g<br />
that the fifth sky sector, which is centered on a zenith angle <strong>of</strong><br />
around 68° <strong>and</strong> <strong>in</strong>cludes that portion <strong>of</strong> the st<strong>and</strong>s that is far<br />
from the measur<strong>in</strong>g po<strong>in</strong>t (Li-Cor 1992), <strong>in</strong>creases the likelihood<br />
that measurements will be <strong>in</strong>fluenced by light at low zenith<br />
angles.<br />
Figure 5 shows the pairwise comparison <strong>of</strong> the mean <strong>LAI</strong><br />
values for all tested methods after correction for clump<strong>in</strong>g <strong>and</strong><br />
non-leafy material. Solid bars <strong>in</strong> Figure 5 represent the mean<br />
<strong>LAI</strong> based on the whole field-<strong>of</strong>-view <strong>of</strong> the <strong>optical</strong> <strong>in</strong>struments,<br />
whereas open bars represent the mean <strong>LAI</strong> based on<br />
four r<strong>in</strong>gs ( 0–60°). Error bars <strong>in</strong>dicate the 99% confidence <strong>in</strong>tervals<br />
(CI), which were generated by a pair-wise Bonferroni<br />
test with α = 0.01.<br />
An <strong>in</strong>crease <strong>in</strong> estimated <strong>LAI</strong> was observed when data from<br />
the outer r<strong>in</strong>g were omitted from both the <strong>LAI</strong>-2000 measurements<br />
<strong>and</strong> hemispherical photographs. The <strong>in</strong>direct estimates<br />
agreed fairly well with the allometric estimates after correction,<br />
highlight<strong>in</strong>g the importance <strong>of</strong> correct<strong>in</strong>g <strong>LAI</strong> before<br />
mak<strong>in</strong>g comparisons.<br />
Discussion<br />
We found that <strong>LAI</strong>e derived from <strong>optical</strong> measurements underestimated<br />
<strong>LAI</strong> calculated from direct measurements (Table 7),<br />
as reported <strong>in</strong> many previous studies (e.g., Fassnacht et al.<br />
Downloaded from<br />
http://treephys.oxfordjournals.org/ by guest on December 6, 2012
730 JONCKHEERE, MUYS AND COPPIN<br />
Table 7. Comparison <strong>of</strong> the different methods for determ<strong>in</strong><strong>in</strong>g the leaf area <strong>in</strong>dex (<strong>LAI</strong>) <strong>of</strong> Scots p<strong>in</strong>e, based on measurements from a st<strong>and</strong> <strong>in</strong><br />
Pijnven Forest. Means followed by an asterisk are significantly different from the allometric estimates <strong>in</strong> the pairwise Bonferroni test at an α =<br />
0.001 level. Abbreviation: DBH = diameter at breast height.<br />
Method Mean <strong>LAI</strong> SD<br />
<strong>Allometry</strong> Based on basal area (<strong>LAI</strong>A(BA)) 3.53 0.02<br />
Based on DBH (<strong>LAI</strong>A(DBH)) 3.57 0.02<br />
TRAC (<strong>LAI</strong>e T) 3.17 1.38<br />
All r<strong>in</strong>gs<br />
<strong>LAI</strong>-2000 (<strong>LAI</strong>e <strong>LAI</strong>-2000) 1.61 0.25<br />
Hemispherical photography (<strong>LAI</strong>ehem) 1.46 0.45<br />
Integrated approach: <strong>LAI</strong>-2000 with TRAC (<strong>LAI</strong>e T-<strong>LAI</strong>-2000) 3.42 0.56<br />
<strong>LAI</strong>-2000 corrected for clump<strong>in</strong>g at the shoot level (<strong>LAI</strong>C <strong>LAI</strong>-2000) 3.22 0.77<br />
<strong>LAI</strong>-2000 corrected for clump<strong>in</strong>g at the branch <strong>and</strong> tree levels (<strong>LAI</strong>B <strong>LAI</strong>-2000) 1.94 * 0.28<br />
<strong>LAI</strong>-2000 corrected for clump<strong>in</strong>g <strong>and</strong> non-leafy materials (<strong>LAI</strong>F <strong>LAI</strong>-2000) 3.18 0.46<br />
Hemispherical photography corrected for clump<strong>in</strong>g at the shoot level (<strong>LAI</strong>C hem) 2.84 0.83<br />
Hemispherical photography corrected for clump<strong>in</strong>g at the branch <strong>and</strong> tree levels (<strong>LAI</strong>B hem) 1.52 * 0.58<br />
Hemispherical photography corrected for clump<strong>in</strong>g <strong>and</strong> non-leafy materials (<strong>LAI</strong>F hem) 2.75 0.82<br />
R<strong>in</strong>g 5 masked<br />
<strong>LAI</strong>-2000 (<strong>LAI</strong>e <strong>LAI</strong>-2000) 1.79 0.33<br />
Hemispherical photography (<strong>LAI</strong>ehem) 1.61 0.51<br />
Integrated approach: <strong>LAI</strong>-2000 with TRAC (<strong>LAI</strong>e T-<strong>LAI</strong>-2000) 3.54 0.75<br />
<strong>LAI</strong>-2000 corrected for clump<strong>in</strong>g at the shoot level (<strong>LAI</strong>C <strong>LAI</strong>-2000) 3.46 0.92<br />
<strong>LAI</strong>-2000 corrected for clump<strong>in</strong>g at the branch <strong>and</strong> tree levels (<strong>LAI</strong>B <strong>LAI</strong>-2000) 2.15 0.37<br />
<strong>LAI</strong>-2000 corrected for blue light scatter<strong>in</strong>g, clump<strong>in</strong>g <strong>and</strong> non-leafy materials (<strong>LAI</strong>F <strong>LAI</strong>-2000) 3.53 0.61<br />
Hemispherical photography corrected for clump<strong>in</strong>g at the shoot level (<strong>LAI</strong>C hem) 3.22 0.95<br />
Hemispherical photography corrected for clump<strong>in</strong>g at the branch <strong>and</strong> tree levels (<strong>LAI</strong>B hem) 1.75 * 0.69<br />
Hemispherical photography corrected for clump<strong>in</strong>g <strong>and</strong> non-leafy materials (<strong>LAI</strong>F hem) 3.16 0.95<br />
1994). The <strong>LAI</strong>-2000 underestimated the directly estimated<br />
<strong>LAI</strong> by 52%, <strong>and</strong> the underestimation for hemispherical photographs<br />
averaged 55%. Thus, the order <strong>of</strong> magnitude <strong>of</strong> the<br />
underestimations corresponded to the 50% observed by Chen<br />
<strong>and</strong> Cihlar (1995) <strong>and</strong> is with<strong>in</strong> the range <strong>of</strong> 30–70% for coniferous<br />
forests reported by others (Smol<strong>and</strong>er <strong>and</strong> Stenberg<br />
1996, Nackaerts et al. 1999). However, the allometric <strong>LAI</strong> estimates<br />
did not differ significantly (α = 0.01) from the corrected<br />
<strong>optical</strong> <strong>LAI</strong> estimates, except for the <strong>LAI</strong>-2000 <strong>and</strong><br />
DHP measurements that were corrected for clump<strong>in</strong>g only at<br />
the branch <strong>and</strong> tree level (Table 7). Based on the assumptions<br />
used <strong>in</strong> the gap fraction models, this f<strong>in</strong>d<strong>in</strong>g <strong>in</strong>dicates that<br />
clump<strong>in</strong>g at the shoot level is the ma<strong>in</strong> reason that <strong>LAI</strong> was underestimated<br />
by the <strong>optical</strong> methods. There was no significant<br />
difference between the allometric <strong>LAI</strong> estimates <strong>and</strong> the f<strong>in</strong>al<br />
<strong>optical</strong> <strong>LAI</strong> (<strong>LAI</strong> F) values corrected for blue light scatter<strong>in</strong>g,<br />
clump<strong>in</strong>g <strong>and</strong> non-leafy material, <strong>in</strong>dicat<strong>in</strong>g that, follow<strong>in</strong>g<br />
corrections, the <strong>in</strong>direct <strong>optical</strong> measurements are reliable.<br />
In agreement with the general observation that removal <strong>of</strong><br />
the outer r<strong>in</strong>g <strong>of</strong> the <strong>LAI</strong>-2000 results <strong>in</strong> higher <strong>LAI</strong> values, because<br />
scatter<strong>in</strong>g is greatest at larger zenith angles (Chen 1996),<br />
our <strong>LAI</strong>e measurements, based on the first four r<strong>in</strong>gs <strong>of</strong> the<br />
<strong>LAI</strong>-2000, were systematically 11% larger than the <strong>LAI</strong>e values<br />
calculated with all five r<strong>in</strong>gs. Similarly, Chen et al. (1997)<br />
reported that the <strong>LAI</strong>-2000 underestimates the effective <strong>LAI</strong><br />
by about 15% because <strong>of</strong> multiple scatter<strong>in</strong>g.<br />
The TRAC gave a relatively high <strong>LAI</strong> values because the <strong>in</strong>-<br />
TREE PHYSIOLOGY VOLUME 25, 2005<br />
strument calculates <strong>LAI</strong> on the basis <strong>of</strong> a nonr<strong>and</strong>om distribution<br />
<strong>of</strong> leaves (i.e., with a clump<strong>in</strong>g <strong>in</strong>dex <strong>of</strong> 0.836). The<br />
clump<strong>in</strong>g <strong>in</strong>dex value <strong>in</strong>dicated that foliage at the site was not<br />
perfectly r<strong>and</strong>omly distributed, which expla<strong>in</strong>s why the <strong>optical</strong><br />
<strong>LAI</strong> estimates, when corrected for clump<strong>in</strong>g, approximated<br />
Figure 5. Mean st<strong>and</strong> estimates <strong>of</strong> leaf area <strong>in</strong>dex (<strong>LAI</strong>) by the <strong>in</strong>direct<br />
<strong>optical</strong> methods after correction for clump<strong>in</strong>g <strong>and</strong> non-leafy material<br />
compared with direct estimates <strong>of</strong> <strong>LAI</strong> based on allometric relationships.<br />
Bars represent mean <strong>LAI</strong>; <strong>and</strong> bars are <strong>in</strong>dicative <strong>of</strong> the 99%<br />
confidence <strong>in</strong>tervals (CI). The CIs were generated by a pairwise<br />
Bonferroni test with α = 0.01. Filled bars are based on the whole field<br />
<strong>of</strong> view <strong>and</strong> open bars are based on four r<strong>in</strong>gs (i.e., 0–60°). Abbreviations:<br />
DHP = digital hemispherical photography; <strong>and</strong> All(BA) <strong>and</strong><br />
All(DBH) = allometric estimates based on basal area <strong>and</strong> DBH, respectively.<br />
Downloaded from<br />
http://treephys.oxfordjournals.org/ by guest on December 6, 2012
the <strong>LAI</strong> values estimated from direct measurements. The<br />
higher mean <strong>LAI</strong> obta<strong>in</strong>ed by an <strong>in</strong>tegrated approach, which<br />
comb<strong>in</strong>ed the <strong>LAI</strong>e measurement <strong>of</strong> the <strong>LAI</strong>-2000 with the<br />
clump<strong>in</strong>g <strong>in</strong>dex provided by TRAC, compared with the <strong>LAI</strong>e<br />
<strong>of</strong> the <strong>LAI</strong>-2000 alone, highlights the usefulness <strong>of</strong> comb<strong>in</strong><strong>in</strong>g<br />
the two <strong>in</strong>struments to correct for clump<strong>in</strong>g.<br />
Correction <strong>of</strong> the <strong>optical</strong> estimates <strong>in</strong>volved a trade-<strong>of</strong>f between<br />
correction for clump<strong>in</strong>g (underestimation <strong>of</strong> <strong>LAI</strong>) <strong>and</strong><br />
correction for the non-leafy parts <strong>of</strong> the crown (overestimation).<br />
Because these factors have oppos<strong>in</strong>g effects on<br />
estimated <strong>LAI</strong> depend<strong>in</strong>g on the proportion <strong>of</strong> woody area, either<br />
the real foliage distribution <strong>of</strong> the st<strong>and</strong> is as clumped as<br />
estimated by the TRAC <strong>in</strong>strument or the calculated woodyto-total<br />
area α = 0.18 is a reasonable estimate for this st<strong>and</strong>. A<br />
consensus concern<strong>in</strong>g the <strong>in</strong>fluence <strong>of</strong> woody material <strong>and</strong><br />
tree boles on <strong>LAI</strong> estimates is still lack<strong>in</strong>g.<br />
Chen et al. (1997), Cut<strong>in</strong>i et al. (1998) <strong>and</strong> Barclay et al.<br />
(2000) found that woody material <strong>in</strong>fluenced <strong>optical</strong> estimates<br />
<strong>of</strong> <strong>LAI</strong> significantly at their test sites, whereas Fournier et al.<br />
(1996) suggested that branches <strong>and</strong> boles exaggerated <strong>LAI</strong> by<br />
less than 5% <strong>in</strong> three relatively dense st<strong>and</strong>s <strong>of</strong> conifers. However,<br />
because <strong>of</strong> the large amount <strong>of</strong> work necessary to assess<br />
the effects <strong>of</strong> wood <strong>and</strong> other non-foliage components <strong>of</strong> the<br />
canopy on <strong>LAI</strong>, most studies have ignored this variable. In<br />
view <strong>of</strong> the difficulty <strong>in</strong> evaluat<strong>in</strong>g the effects <strong>of</strong> W on <strong>LAI</strong> estimates<br />
<strong>and</strong> its high variability, the importance <strong>of</strong> correct<strong>in</strong>g<br />
for this factor must be carefully assessed. A solution to the<br />
time-consum<strong>in</strong>g determ<strong>in</strong>ation <strong>of</strong> the correction factor α<br />
could be an automated classification method based on imagery<br />
from a digital camera allow<strong>in</strong>g imag<strong>in</strong>g <strong>in</strong> several waveb<strong>and</strong>s.<br />
F<strong>in</strong>ally, the difference <strong>in</strong> <strong>LAI</strong>e values between hemispherical<br />
photography <strong>and</strong> <strong>LAI</strong>-2000 (15%) can be expla<strong>in</strong>ed by differences<br />
<strong>in</strong> light measurements <strong>and</strong> gap fraction calculation.<br />
Hemispherical photography deals with diffuse <strong>and</strong> direct light,<br />
whereas the <strong>LAI</strong>-2000 accounts only for diffuse light. The<br />
<strong>LAI</strong>-2000 provides a mean gap fraction, <strong>in</strong>tegrated over the<br />
azimuth for every zenith r<strong>in</strong>g, whereas the hemispherical photography<br />
accounts for the real gap fraction over the r<strong>in</strong>gs because<br />
gap fraction data are derived from 36 azimuth sectors<br />
(10° azimuth angles). The assumption <strong>of</strong> uniformly oriented<br />
needles <strong>in</strong> each azimuth sector is more likely to be valid <strong>in</strong> the<br />
latter case.<br />
Acknowledgments<br />
ALLOMETRY AND EVALUATION OF OPTICAL <strong>LAI</strong> DETERMINATION 731<br />
We acknowledge the useful comments <strong>and</strong> criticisms provided by<br />
Kris Nackaerts, Ben Bond-Lamberty <strong>and</strong> Paul<strong>in</strong>e Stenberg. We thank<br />
Dave Nys for helpful assistance <strong>in</strong> the measurements, as well as<br />
Bruno De Vos (Institute for Forestry <strong>and</strong> Game Management) for data<br />
delivery. Assistance <strong>in</strong> f<strong>in</strong>d<strong>in</strong>g suitable st<strong>and</strong>s <strong>and</strong> permission to do<br />
destructive measurements were supplied by Johan Agten, forest ranger<br />
at State Forest Pijnven. We thank VITO for supply<strong>in</strong>g the TRAC<br />
<strong>in</strong>strument. Fund<strong>in</strong>g support for this research was provided by FWO<br />
Vla<strong>and</strong>eren (Project No. G.0085.01) <strong>and</strong> OSTC, Belgium.<br />
References<br />
TREE PHYSIOLOGY ONLINE at http://heronpublish<strong>in</strong>g.com<br />
Battaglia, M., M.L. Cherry, C.L. Beadle, P.J. S<strong>and</strong>s <strong>and</strong> A. H<strong>in</strong>gston.<br />
1998. Prediction <strong>of</strong> leaf area <strong>in</strong>dex <strong>in</strong> eucalypt plantations: effects<br />
<strong>of</strong> water stress <strong>and</strong> temperature. <strong>Tree</strong> Physiol. 18:521–528.<br />
Barclay, H.J., J.A. Tr<strong>of</strong>ymow <strong>and</strong> R.I. Leach. 2000. Assess<strong>in</strong>g bias<br />
from boles <strong>in</strong> calculat<strong>in</strong>g leaf area <strong>in</strong>dex <strong>in</strong> immature Douglasfir<br />
with the Li-Cor canopy analyzer. Agric. For. Meteorol. 100:<br />
255–260.<br />
Bartel<strong>in</strong>k, H.H. 1996. Allometric relationships on biomass <strong>and</strong> needle<br />
area <strong>of</strong> Douglas-fir. For. Ecol. Manage. 86:193–203.<br />
Beaudet, M. <strong>and</strong> C. Messier. 2002. Variation <strong>in</strong> canopy openness <strong>and</strong><br />
light transmission follow<strong>in</strong>g selection cutt<strong>in</strong>g <strong>in</strong> northern hardwood<br />
st<strong>and</strong>s: an assessment based on hemispherical photographs.<br />
Agric. For. Meteorol. 110:217–228.<br />
Br<strong>and</strong>, D.G. 1987. Estimat<strong>in</strong>g the surface area <strong>of</strong> spruce <strong>and</strong> p<strong>in</strong>e foliage<br />
from displaced volume <strong>and</strong> length. Can. J. For. Res. 17:<br />
1305–1308.<br />
Bond-Lamberty, B., C. Wang <strong>and</strong> S.T. Gower. 2003. The use <strong>of</strong> multiple<br />
measurement techniques to ref<strong>in</strong>e estimates <strong>of</strong> conifer needle<br />
geometry. Can. J. For. Res. 33:101–105.<br />
Èermák, J. <strong>and</strong> J. Michalek. 1991. Selection <strong>of</strong> sample trees <strong>in</strong> forest<br />
st<strong>and</strong>s us<strong>in</strong>g the quantils <strong>of</strong> total. Lesnictivi 37:49–60.<br />
Chason, J.W., D.D. Baldocchi <strong>and</strong> M.A. Huston. 1991. A comparison<br />
<strong>of</strong> direct <strong>and</strong> <strong>in</strong>direct methods for estimat<strong>in</strong>g forest canopy leaf<br />
area. Agric. For. Meteorol. 57:107–128.<br />
Chen, J.M. 1996. Optically-based methods for measur<strong>in</strong>g seasonal<br />
variation <strong>of</strong> leaf area <strong>in</strong>dex <strong>in</strong> boreal conifer st<strong>and</strong>s. Agric. For.<br />
Meteorol. 80:135–163.<br />
Chen, J.M. <strong>and</strong> T.A. Black. 1992. Def<strong>in</strong><strong>in</strong>g leaf area <strong>in</strong>dex for non-flat<br />
leaves. Plant Cell. Environ. 15:421– 429.<br />
Chen, J.M. <strong>and</strong> J. Cihlar. 1995. Quantify<strong>in</strong>g the effect <strong>of</strong> canopy architecture<br />
on <strong>optical</strong> measurements <strong>of</strong> leaf area <strong>in</strong>dex us<strong>in</strong>g two<br />
gap size analysis methods. IEEE Trans. Geosci. Remote Sens. 33:<br />
777–787.<br />
Chen, J.M., T.A. Black <strong>and</strong> R.S. Adams. 1991. Evaluation <strong>of</strong> hemispherical<br />
photography for determ<strong>in</strong><strong>in</strong>g plant area <strong>in</strong>dex <strong>and</strong> geometry<br />
<strong>of</strong> a forest st<strong>and</strong>. Agric. For. Meteorol. 56:129 –143.<br />
Chen, J.M., P.M. Rich, S.T. Gower, J.M. Norman <strong>and</strong> S. Plummer.<br />
1997. Leaf area <strong>in</strong>dex <strong>of</strong> boreal forests: theory, techniques <strong>and</strong><br />
measurements. J. Geophys. Res. 104:429 – 443.<br />
Cut<strong>in</strong>i, A., G. Matteucci <strong>and</strong> G.S. Mugnozza. 1998. Estimation <strong>of</strong> leaf<br />
area <strong>in</strong>dex with the Li-Cor <strong>LAI</strong>-2000 <strong>in</strong> deciduous forests. For.<br />
Ecol. Manage. 105:55–65.<br />
Dufrêne, E. <strong>and</strong> N. Bréda. 1995. Estimation <strong>of</strong> deciduous forest<br />
leaf area <strong>in</strong>dex us<strong>in</strong>g direct <strong>and</strong> <strong>in</strong>direct methods. Oecologia 104:<br />
156–162.<br />
Duursma, R.A., J.D. Marshall <strong>and</strong> A.P. Rob<strong>in</strong>son. 2003. Leaf area <strong>in</strong>dex<br />
<strong>in</strong>ferred from solar beam transmission <strong>in</strong> mixed conifer forests<br />
on complex terra<strong>in</strong>. Agric. For. Meteorol. 118:221–236.<br />
Fassnacht, K.S., S.T. Gower, J.M. Norman <strong>and</strong> R.E. McMurtrie.<br />
1994. A comparison <strong>of</strong> <strong>optical</strong> <strong>and</strong> direct methods for estimat<strong>in</strong>g<br />
foliage surface area <strong>in</strong>dex <strong>in</strong> forests. Agric. For. Meteorol. 71:<br />
183–207.<br />
Fournier, R.A., R. L<strong>and</strong>ry, N.M. August, G. Fedosejevs <strong>and</strong> R.P. Gauthier.<br />
1996. Modell<strong>in</strong>g light obstruction <strong>in</strong> three conifer forests us<strong>in</strong>g<br />
hemispherical photography <strong>and</strong> f<strong>in</strong>e tree architecture. Agric.<br />
For. Meteorol. 82:47–72.<br />
Frazer, G.W., C.D. Canham <strong>and</strong> K.P. Lertzman. 1999. Gap light analyzer<br />
(GLA). Version 2.0. Imag<strong>in</strong>g s<strong>of</strong>tware to extract canopy<br />
structure <strong>and</strong> gap light transmission <strong>in</strong>dices from true-color fisheye<br />
photographs: users’ manual <strong>and</strong> program documentation. Simon<br />
Fraser University, Burnaby, BC, Canada, 36 p.<br />
Downloaded from<br />
http://treephys.oxfordjournals.org/ by guest on December 6, 2012
732 JONCKHEERE, MUYS AND COPPIN<br />
Frazer, G.W., R.A. Fournier, J.A. Tr<strong>of</strong>ymow <strong>and</strong> R.J. Hall. 2001. A<br />
comparison <strong>of</strong> digital <strong>and</strong> film fisheye photography for analysis <strong>of</strong><br />
forest canopy structure <strong>and</strong> gap light transmission. Agric. For.<br />
Meteorol. 109:249 – 263.<br />
Gholz, H.L. <strong>and</strong> W.P. Cropper. 1991. Carbohydrate dynamics <strong>in</strong> mature<br />
P<strong>in</strong>us elliotti var. elliottii trees. Can. J. For. Res. 21:1742–1747.<br />
Gower, S.T. <strong>and</strong> J.M. Norman. 1991. Rapid estimation <strong>of</strong> leaf-area <strong>in</strong>dex<br />
<strong>in</strong> conifer <strong>and</strong> broad-leaf plantations. Ecology 72:1896 –1900.<br />
Gower. S.T., C.J. Kucharik <strong>and</strong> J.M. Norman. 1999. Direct <strong>and</strong> <strong>in</strong>direct<br />
estimation <strong>of</strong> leaf area <strong>in</strong>dex, fAPAR <strong>and</strong> net primary production<br />
<strong>of</strong> terrestrial ecosystems. Remote Sens. Environ. 70:29–51.<br />
Hutch<strong>in</strong>son, B.A., D.R. Matt, R.T. McMillen, L.J. Gross, S.J. Tajchman<br />
<strong>and</strong> J.M. Norman. 1986. The architecture <strong>of</strong> a deciduous forest<br />
canopy <strong>in</strong> Eastern Tennessee, USA. J. Ecol. 74:635–646.<br />
Jonckheere, I., S. Fleck, K. Nackaerts, B. Muys, P. Copp<strong>in</strong>, M. Weiss<br />
<strong>and</strong> F. Baret. 2004. Review <strong>of</strong> methods for <strong>in</strong> <strong>situ</strong> leaf area <strong>in</strong>dex<br />
determ<strong>in</strong>ation. Part I: Theories, sensors <strong>and</strong> hemispherical photography.<br />
Agric. For. Meteorol. 121:19–35.<br />
Kershaw, Jr., J.A. <strong>and</strong> D.A. Maguire. 1995. Crown structure <strong>in</strong> western<br />
hemlock, Douglas-fir, <strong>and</strong> gr<strong>and</strong> fir <strong>in</strong> western Wash<strong>in</strong>gton:<br />
trends <strong>in</strong> branch-level mass <strong>and</strong> leaf area. Can. J. For. Res. 25:<br />
1897–1912.<br />
Kucharik, C.J., J.M. Norman <strong>and</strong> S.T. Gower. 1999. Characterization<br />
<strong>of</strong> radiation regimes <strong>in</strong> nonr<strong>and</strong>om forest canopies: theory, measurements,<br />
<strong>and</strong> a simplified model<strong>in</strong>g approach. <strong>Tree</strong> Physiol. 19:<br />
695–706.<br />
Küßner, R. <strong>and</strong> R. Mos<strong>and</strong>l. 2000. Comparison <strong>of</strong> direct <strong>and</strong> <strong>in</strong>direct<br />
estimation <strong>of</strong> leaf area <strong>in</strong>dex <strong>in</strong> mature Norway spruce st<strong>and</strong>s <strong>of</strong><br />
eastern Germany. Can. J. For. Res. 30:440 – 447.<br />
Leblanc, S.G. 2002. Correction to the plant canopy gap-size analysis<br />
theory used by the trac<strong>in</strong>g radiation <strong>and</strong> architecture <strong>of</strong> canopies <strong>in</strong>strument.<br />
Appl. Optics 36:7667–7670.<br />
Leblanc, S.G., J.M. Chen <strong>and</strong> M. Kwong. 2002. Trac<strong>in</strong>g radiation <strong>and</strong><br />
architecture <strong>of</strong> canopies. TRAC Manual. Version 2.1.3. Natural<br />
Resources Canada, Canada Centre for Remote Sens<strong>in</strong>g, Ottawa<br />
ON, Canada, 25 p.<br />
Le Dantec, V., E. Dufrêne <strong>and</strong> B. Saugier. 2000. Interannual <strong>and</strong> spatial<br />
variation <strong>in</strong> maximum leaf area <strong>in</strong>dex <strong>of</strong> temperate deciduous<br />
st<strong>and</strong>s. For. Ecol. Manage. 134:71–81.<br />
Li-Cor. 1992. <strong>LAI</strong>-2000 Plant canopy analyzer. Instruction manual.<br />
Li-Cor, Inc., L<strong>in</strong>coln, NE, 174 p.<br />
Mencucc<strong>in</strong>i, M. <strong>and</strong> J. Grace. 1995. Climate <strong>in</strong>fluences the leaf<br />
area/sapwood area ratio <strong>in</strong> Scots p<strong>in</strong>e. <strong>Tree</strong> Physiol. 15:1–10.<br />
TREE PHYSIOLOGY VOLUME 25, 2005<br />
Müller, P.H. 1983. Wahrsche<strong>in</strong>lichkeitsrechnung und Mathematische<br />
Statistik Lexikon der Stochastic. 4th Edn. Akademisches Verlag,<br />
Berl<strong>in</strong>, 198 p.<br />
Nackaerts, K. 2002. Modell<strong>in</strong>g <strong>of</strong> leaf area <strong>in</strong>dex as a scale-<strong>in</strong>tegrated<br />
<strong>in</strong>dicator for forest monitor<strong>in</strong>g. Ph.D. Diss., Katholieke Universiteit<br />
Leuven, Belgium, 252 p.<br />
Nackaerts, K., T. Wagendorp, P. Copp<strong>in</strong>, B. Muys <strong>and</strong> R. Gombeer.<br />
1999. A correction <strong>of</strong> <strong>in</strong>direct <strong>LAI</strong> measurements for a non-r<strong>and</strong>om<br />
distribution <strong>of</strong> needles on shoots. In Proc. ISSR on Systems <strong>and</strong><br />
Sensors for New Millenium, Las Vegas, NV, 4 p.<br />
Nilson, T. <strong>and</strong> A. Kuusk. 2004. Improved algorithm for estimat<strong>in</strong>g<br />
canopy <strong>in</strong>dices from gap fraction data <strong>in</strong> forest canopies. Agric.<br />
For. Meteorol. 124:157–169.<br />
Norman, J.M. <strong>and</strong> G.S. Campbell. 1989. Canopy structure. In Plant<br />
Ecology: Field Methods And Instrumentation. Eds. R.W. Pearcy,<br />
J. Ehlr<strong>in</strong>ger, H.A. Mooney <strong>and</strong> P.W. Rundel. Chapman <strong>and</strong> Hall,<br />
London, pp 301–325.<br />
Pierce, L.L. <strong>and</strong> S.W. Runn<strong>in</strong>g. 1988. Rapid estimation <strong>of</strong> coniferous<br />
forest leaf area <strong>in</strong>dex us<strong>in</strong>g a portable <strong>in</strong>tegrat<strong>in</strong>g radiometer. Ecology<br />
69:1762–1767.<br />
Planchais, I. <strong>and</strong> J.Y. Pontailler. 1999. Validity <strong>of</strong> leaf areas <strong>and</strong> angles<br />
estimated <strong>in</strong> a beech forest from analysis <strong>of</strong> gap frequencies, us<strong>in</strong>g<br />
hemispherical photographs <strong>and</strong> a plant canopy analyzer. Ann. For.<br />
Sci. 56:1–10.<br />
Runn<strong>in</strong>g, S.W. <strong>and</strong> J.C. Coughlan. 1988. A general model <strong>of</strong> forest<br />
ecosystem processes for regional applications. I. Hydrological balance,<br />
canopy gas exchange <strong>and</strong> primary production processes.<br />
Ecol. Model. 42:125–154.<br />
Smol<strong>and</strong>er, H. <strong>and</strong> P. Stenberg. 1996. Response <strong>of</strong> <strong>LAI</strong>-2000 estimates<br />
to changes <strong>in</strong> plant surface area <strong>in</strong>dex <strong>in</strong> a Scots p<strong>in</strong>e st<strong>and</strong>.<br />
<strong>Tree</strong> Physiol. 16:345– 349.<br />
Soudani, K., J. Trautmann <strong>and</strong> J.M.N. Walter. 2002. Leaf area <strong>in</strong>dex<br />
<strong>and</strong> canopy stratification <strong>in</strong> Scots p<strong>in</strong>e (P<strong>in</strong>us sylvestris L.) st<strong>and</strong>s.<br />
Int. J. Remote Sens. 18: 3605–3618.<br />
Stenberg, P. 1996. Correct<strong>in</strong>g <strong>LAI</strong>-2000 estimates for the clump<strong>in</strong>g <strong>of</strong><br />
needles <strong>in</strong> shoots <strong>of</strong> conifers. Agric. For. Meteorol. 79:1–8.<br />
Stenberg, P., S. L<strong>in</strong>der, H. Smol<strong>and</strong>er <strong>and</strong> J. Flower-Ellis. 1994. Performance<br />
<strong>of</strong> the <strong>LAI</strong>-2000 plant canopy analyzer <strong>in</strong> estimat<strong>in</strong>g leaf<br />
area <strong>in</strong>dex <strong>of</strong> some Scots p<strong>in</strong>e st<strong>and</strong>s. <strong>Tree</strong> Physiol. 14:981– 995.<br />
Temesgen, H. 2003. Evaluation <strong>of</strong> sampl<strong>in</strong>g alternatives to quantify<br />
tree leaf area. Can. J. For. Res. 33:82– 95.<br />
Welles, J.M. <strong>and</strong> J.M. Norman. 1991. An <strong>in</strong>strument for <strong>in</strong>direct measurement<br />
<strong>of</strong> canopy architecture. Agron. J. 83:818 –825.<br />
Downloaded from<br />
http://treephys.oxfordjournals.org/ by guest on December 6, 2012