Allometry and evaluation of in situ optical LAI ... - Tree Physiology
Allometry and evaluation of in situ optical LAI ... - Tree Physiology
Allometry and evaluation of in situ optical LAI ... - Tree Physiology

You also want an ePaper? Increase the reach of your titles
YUMPU automatically turns print PDFs into web optimized ePapers that Google loves.
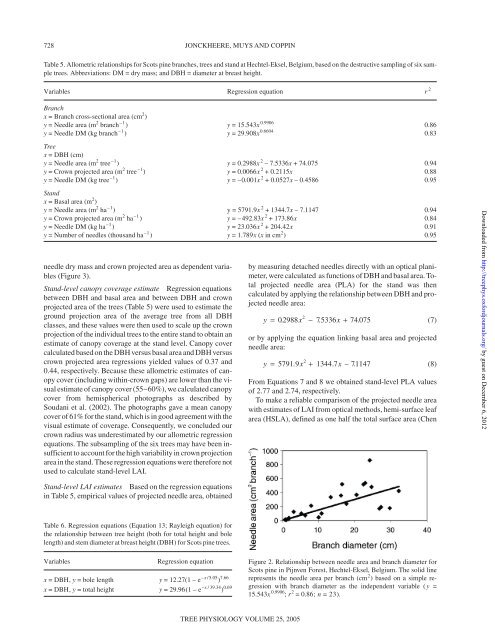
728 JONCKHEERE, MUYS AND COPPIN<br />
Table 5. Allometric relationships for Scots p<strong>in</strong>e branches, trees <strong>and</strong> st<strong>and</strong> at Hechtel-Eksel, Belgium, based on the destructive sampl<strong>in</strong>g <strong>of</strong> six sample<br />
trees. Abbreviations: DM = dry mass; <strong>and</strong> DBH = diameter at breast height.<br />
Variables Regression equation r 2<br />
Branch<br />
x = Branch cross-sectional area (cm 2 )<br />
y = Needle area (m 2 branch –1 ) y = 15.543x 0.9906<br />
y = Needle DM (kg branch –1 ) y = 29.908x 0.6604<br />
<strong>Tree</strong><br />
x = DBH (cm)<br />
y = Needle area (m 2 tree –1 ) y = 0.2988x 2 – 7.5336x + 74.075 0.94<br />
y = Crown projected area (m 2 tree –1 ) y = 0.0066x 2 + 0.2115x 0.88<br />
y = Needle DM (kg tree –1 ) y = –0.001x 2 + 0.0527x – 0.4586 0.95<br />
St<strong>and</strong><br />
x = Basal area (m 2 )<br />
y = Needle area (m 2 ha –1 ) y = 5791.9x 2 + 1344.7x – 7.1147 0.94<br />
y = Crown projected area (m 2 ha –1 ) y = – 492.83x 2 + 173.86x 0.84<br />
y = Needle DM (kg ha –1 ) y = 23.036x 2 + 204.42x 0.91<br />
y = Number <strong>of</strong> needles (thous<strong>and</strong> ha –1 ) y = 1.789x (x <strong>in</strong> cm 2 ) 0.95<br />
needle dry mass <strong>and</strong> crown projected area as dependent variables<br />
(Figure 3).<br />
St<strong>and</strong>-level canopy coverage estimate Regression equations<br />
between DBH <strong>and</strong> basal area <strong>and</strong> between DBH <strong>and</strong> crown<br />
projected area <strong>of</strong> the trees (Table 5) were used to estimate the<br />
ground projection area <strong>of</strong> the average tree from all DBH<br />
classes, <strong>and</strong> these values were then used to scale up the crown<br />
projection <strong>of</strong> the <strong>in</strong>dividual trees to the entire st<strong>and</strong> to obta<strong>in</strong> an<br />
estimate <strong>of</strong> canopy coverage at the st<strong>and</strong> level. Canopy cover<br />
calculated based on the DBH versus basal area <strong>and</strong> DBH versus<br />
crown projected area regressions yielded values <strong>of</strong> 0.37 <strong>and</strong><br />
0.44, respectively. Because these allometric estimates <strong>of</strong> canopy<br />
cover (<strong>in</strong>clud<strong>in</strong>g with<strong>in</strong>-crown gaps) are lower than the visual<br />
estimate <strong>of</strong> canopy cover (55–60%), we calculated canopy<br />
cover from hemispherical photographs as described by<br />
Soudani et al. (2002). The photographs gave a mean canopy<br />
cover <strong>of</strong> 61% for the st<strong>and</strong>, which is <strong>in</strong> good agreement with the<br />
visual estimate <strong>of</strong> coverage. Consequently, we concluded our<br />
crown radius was underestimated by our allometric regression<br />
equations. The subsampl<strong>in</strong>g <strong>of</strong> the six trees may have been <strong>in</strong>sufficient<br />
to account for the high variability <strong>in</strong> crown projection<br />
area <strong>in</strong> the st<strong>and</strong>. These regression equations were therefore not<br />
used to calculate st<strong>and</strong>-level <strong>LAI</strong>.<br />
St<strong>and</strong>-level <strong>LAI</strong> estimates Based on the regression equations<br />
<strong>in</strong> Table 5, empirical values <strong>of</strong> projected needle area, obta<strong>in</strong>ed<br />
Table 6. Regression equations (Equation 13; Rayleigh equation) for<br />
the relationship between tree height (both for total height <strong>and</strong> bole<br />
length) <strong>and</strong> stem diameter at breast height (DBH) for Scots p<strong>in</strong>e trees.<br />
Variables Regression equation<br />
x =DBH,y = bole length y = 12.27(1 – e –x /5.05 ) 7.66<br />
x = DBH, y = total height y = 29.96(1 – e –x / 39.34 ) 0.69<br />
TREE PHYSIOLOGY VOLUME 25, 2005<br />
0.86<br />
0.83<br />
by measur<strong>in</strong>g detached needles directly with an <strong>optical</strong> planimeter,<br />
were calculated as functions <strong>of</strong> DBH <strong>and</strong> basal area. Total<br />
projected needle area (PLA) for the st<strong>and</strong> was then<br />
calculated by apply<strong>in</strong>g the relationship between DBH <strong>and</strong> projected<br />
needle area:<br />
2<br />
y = 02988 . x − 75336 . x + 74. 075<br />
(7)<br />
or by apply<strong>in</strong>g the equation l<strong>in</strong>k<strong>in</strong>g basal area <strong>and</strong> projected<br />
needle area:<br />
2<br />
y = 5791.9x + 1344.7x – 71147 . (8)<br />
From Equations 7 <strong>and</strong> 8 we obta<strong>in</strong>ed st<strong>and</strong>-level PLA values<br />
<strong>of</strong> 2.77 <strong>and</strong> 2.74, respectively.<br />
To make a reliable comparison <strong>of</strong> the projected needle area<br />
with estimates <strong>of</strong> <strong>LAI</strong> from <strong>optical</strong> methods, hemi-surface leaf<br />
area (HSLA), def<strong>in</strong>ed as one half the total surface area (Chen<br />
Figure 2. Relationship between needle area <strong>and</strong> branch diameter for<br />
Scots p<strong>in</strong>e <strong>in</strong> Pijnven Forest, Hechtel-Eksel, Belgium. The solid l<strong>in</strong>e<br />
represents the needle area per branch (cm 2 ) based on a simple regression<br />
with branch diameter as the <strong>in</strong>dependent variable ( y =<br />
15.543x 0.9906 ; r 2 = 0.86; n = 23).<br />
Downloaded from<br />
http://treephys.oxfordjournals.org/ by guest on December 6, 2012