The Earth Scientist
Fall 12.pdf - NESTA
Fall 12.pdf - NESTA
- No tags were found...

Create successful ePaper yourself
Turn your PDF publications into a flip-book with our unique Google optimized e-Paper software.
<strong>The</strong> <strong>Earth</strong> <strong>Scientist</strong><br />
Volume XXVIII • Issue 3 • Fall 2012 $10.00*<br />
FREE POSTER<br />
INSIDE!<br />
From the<br />
American Geosciences Institute<br />
2012 <strong>Earth</strong> Science<br />
Week Poster<br />
INSIDE THIS ISSUE<br />
From the President ..................... 2<br />
From the Executive Director<br />
as Guest Editor ........................ 3<br />
NESTA Workshops at the Fall 2012 NSTA<br />
Area Conferences ...................... 6<br />
Discovering Careers in the <strong>Earth</strong> Sciences ... 7<br />
<strong>The</strong> Carbon Cycle Game:<br />
A Regionally Relevant Activity to<br />
Introduce Climate Change ............... 9<br />
<strong>The</strong> ELF (Environmental Literacy<br />
Framework with a Focus on Climate<br />
Change): Building Climate Change Science<br />
Knowledge Through Hands‐on Activities .... 14<br />
<strong>Earth</strong>Labs – An <strong>Earth</strong> System Science<br />
Laboratory Module to Facilitate Teaching<br />
About Climate Change .................. 19<br />
Teaching Controversy .................. 25<br />
Lesson Plans and Classroom Activities<br />
from the Climate Literacy Ambassadors<br />
Community .......................... 30<br />
Predicting the Impacts of Climate Change on<br />
Ecosystems: A High School Curricular Module . 33<br />
Membership Information ................ 37<br />
Advertising in <strong>The</strong> <strong>Earth</strong> <strong>Scientist</strong> ......... 38<br />
Manuscript Guidelines .................. 39<br />
This special Climate Change issue is sponsored by the National Science Foundation<br />
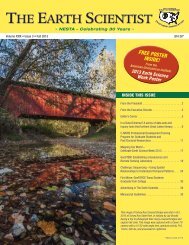
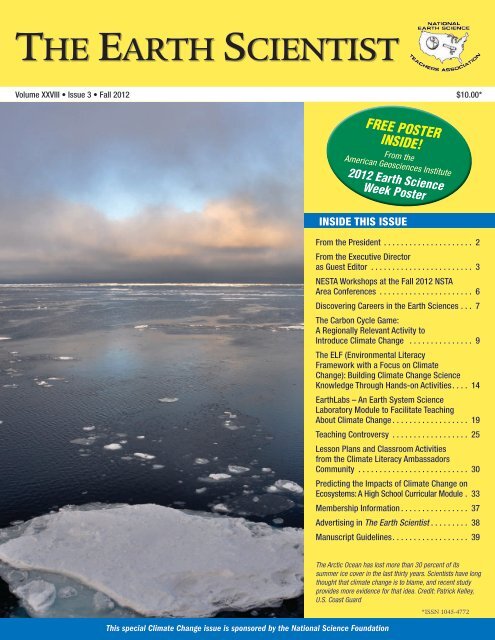
<strong>The</strong> Arctic Ocean has lost more than 30 percent of its<br />
summer ice cover in the last thirty years. <strong>Scientist</strong>s have long<br />
thought that climate change is to blame, and recent study<br />
provides more evidence for that idea. Credit: Patrick Kelley,<br />
U.S. Coast Guard<br />
*ISSN 1045-4772
Page 2<br />
<strong>The</strong> <strong>Earth</strong> <strong>Scientist</strong><br />
From the President<br />
by Ardis Herrold, NESTA Past-President<br />
Happy New (school) Year!<br />
NESTA’S MISSION<br />
To facilitate and advance<br />
excellence in <strong>Earth</strong> and Space<br />
Science education.<br />
NESTA Contacts<br />
EXECUTIVE BOARD<br />
President<br />
Missy Holzer<br />
mholzer@monmouth.com<br />
President-Elect<br />
Michael J Passow<br />
michael@earth2class.org<br />
Secretary<br />
Jenelle Hopkins<br />
jhopkins@interact.ccsd.net<br />
Treasurer<br />
Howard Dimmick<br />
dimmick@esteacher.org<br />
Past-President<br />
Ardis Herrold<br />
amacio@comcast.net<br />
Board of Directors<br />
Representative<br />
Eddie Cohen<br />
ecohen@pway.org<br />
Executive Director and<br />
Association Contact<br />
Dr. Roberta Johnson<br />
rmjohnsn@gmail.com<br />
NESTA Webmaster<br />
Julia Genyuk<br />
jgenyuk@windows2universe.org<br />
NESTA Administrator<br />
Marlene DiMarco<br />
Phone: 720-982-8349<br />
[Contact the Administrator for<br />
address for Large Mailings]<br />
<strong>The</strong> Next Generation Science Standards (NGSS) will be a reality before we know it! If you haven’t<br />
taken a peek at them, now is a good time to get a handle on how they will impact you in your<br />
profession as a science educator. Make it your New (school) Year’s resolution to develop an<br />
awareness of the NGSS.<br />
For many of our states the Next Generation Science Standards (NGSS) will be adopted in the near<br />
future as they are slated to be completed late in 2012 or early in 2013. Even if your state is not one<br />
of the 26 lead states scheduled to adopt the NGSS, use this New (school) Year to develop or join a<br />
Professional Learning Community (PLC) focused on unpacking the NGSS so that you are ready<br />
for the implementation. <strong>The</strong> framework that guided the creation of the NGSS can be downloaded<br />
for free from the National Academies Press website and a draft of the NGSS is available from the<br />
Achieve website. Both of these documents can serve as the foundation for a rich dialogue among<br />
you and your science education colleagues.<br />
<strong>The</strong> creation of the Framework for K-12 Science Education: Practices, Cross-cutting Concepts, and Core Ideas<br />
began in the summer of 2010. <strong>The</strong> National Research Council organized an exemplary committee<br />
to create this document, who then used the latest research on how children learn science. After<br />
extensive vetting through science, engineering, and education organizations as well as thousands<br />
of people organized in focus groups, the document was completed in the summer of 2011 and<br />
published in its final form in 2012. <strong>The</strong> purpose of this document is to provide the foundation<br />
upon which the NGSS were to be constructed. Everything you see in the NGSS can be traced back<br />
to the Framework, and therefore starting your grasp of the NGSS should start with a grasp of the<br />
Framework.<br />
Let the table of contents of the Framework serve as your PLC agenda. For instance, the table of<br />
contents is divided into three parts, Part 1: A Vision for K-12 Science Education; Part II: Dimensions<br />
of the Framework; and Part III: Realizing the Vision and the chapters within these three parts, can<br />
be a topic for each meeting. Pay special attention to chapters 1 and 2 as they provide the philosophy<br />
behind the Framework and chapters 3 and 4 as they include key dimensions grounding the paradigm<br />
shift of what will be expected of science educators when the NGSS are implemented. <strong>The</strong> scientific<br />
and engineering practices as well as the crosscutting concepts are now married to our content, and<br />
students are expected to actively integrate all three dimensions (practices, crosscutting concepts,<br />
and disciplinary core ideas) in future assessments.<br />
<strong>The</strong> discussion in your PLC should include ways you can integrate these three dimensions and ways<br />
you can successfully implement the NGSS in your classrooms. Once your PLC has digested the<br />
Framework, you are ready to view the NGSS to see how they will assist you in your curricular and<br />
instructional decisions. Have a wonderful New (school) Year and may you be successful with all your<br />
resolutions!<br />
NESTA Address:<br />
PO Box 20854<br />
Boulder, CO 80308-3854<br />
Visit the NESTA website at<br />
http://www.nestanet.org<br />
Missy Holzer<br />
NESTA President, 2012-15<br />
© 2012 National <strong>Earth</strong> Science Teachers Association. All Rights Reserved.
Volume XXVIII, Issue 3<br />
Page 3<br />
From the Executive Director<br />
and Guest Editor<br />
Dear NESTA Members,<br />
Greetings from NESTA at the beginning of another school year! I hope you have had a great and<br />
restful summer, and are reinvigorated for the school year to come. And I hope to see you at our<br />
events this year, if your schedules allow!<br />
This very special fall issue of <strong>The</strong> <strong>Earth</strong> <strong>Scientist</strong> (TES) has a focus on climate change education.<br />
We’re very excited about it, for several reasons. First of all, we’d like to thank the National Science<br />
Foundation (NSF) (GEO-1246254 from the Geoscience Education program of NSF) for their financial<br />
support of this issue. This support has made it possible for NESTA to implement a peer-review<br />
process for articles submitted to TES! For NESTA, peer-review involves feedback from leading<br />
teachers across the country as well as domain experts – in this case, specialists in climate change<br />
education. We’re delighted that 16 of these individuals agreed to serve as peer-reviewers for the articles<br />
submitted to the issue. Moving forward, we will continue to provide peer-review for all articles<br />
submitted to TES, providing a valuable service for both authors and subscribers.<br />
As many of you already know, this year has been exceptionally warm. According to NOAA, this<br />
spring was the warmest on record in the US since record keeping began in 1895, with tens of thousands<br />
of records falling to date. <strong>The</strong> last 12 months have been the warmest on record. According<br />
to NASA, the global average surface temperature in 2011 was the ninth warmest since 1880,<br />
continuing a trend in which nine of the 10 warmest years in the modern meteorological record have<br />
occurred since the year 2000. On a daily basis, we hear about extreme events and changes in our<br />
environment. In mid July, NASA discovered a surprising sudden melting of the Greenland ice sheet,<br />
with melting underway across 97% of its surface. <strong>The</strong> Alaska Highway, which was built on permafrost<br />
(and relies upon it for its stability), is starting to buckle as the permafrost below it melts. This<br />
year we had a record number of tornadoes very early in the year, causing massive damage in the midwest<br />
and southern states. We are in the middle of the worst drought in 50 years, which brings with<br />
it significant ripple effects in society – lowering water levels in reservoirs endangering recreation and<br />
energy production, withering crops impacting food production and the cost of food, and lowering<br />
water levels on major rivers impacting shipping to name only a few. Clearly, we live in a deeply<br />
interconnected system bringing together the environment, the economy, and our social system –<br />
the three pillars of society. As the climate warms – which observational evidence clearly shows is<br />
happening – there will be impacts throughout society because of these interconnections.<br />
From the perspective of an <strong>Earth</strong> and space science teacher, climate change offers a particularly<br />
compelling case study demonstrating the interconnectedness of systems and the opportunity to<br />
develop an understanding of and apply unifying concepts and processes of science. This issue<br />
provides you with five articles describing resources for you to use in the classroom for climate<br />
change education, as well as an article that looks into the problems caused by the “teach the controversy”<br />
approach. We hope these articles are helpful to you in the coming year as you delve into this<br />
difficult and compelling topic. In this issue, we also provide a list of particularly useful, online,<br />
climate change education resources for you.<br />
Also included in this issue is an article announcing the 2012 <strong>Earth</strong> Science Week celebration sponsored<br />
annually by the American Geosciences Institute (AGI). In the hard copies of this Fall issue,<br />
the AGI has graciously provided, for use in your classroom, the 2012 <strong>Earth</strong> Science Week Poster,<br />
entitled Discovering Careers in the <strong>Earth</strong> Sciences.<br />
© 2012 National <strong>Earth</strong> Science Teachers Association. All Rights Reserved.<br />
NESTA Contacts<br />
REGIONAL DIRECTORS<br />
Central Region - IL, IA, MN,<br />
MO, WI<br />
Chad Heinzel<br />
chad.heinzel@uni.edu<br />
East Central Region - IN, KY,<br />
MI, OH<br />
Jay Sinclair<br />
sinclair.jay@sbcglobal.net<br />
Eastern Region - DE, NJ, PA<br />
Peter Dorofy<br />
pdq72@optimum.net<br />
Far Western and Hawaii<br />
Region - CA, GU, HI, NV<br />
Wendy Van Norden<br />
wvannorden@hw.com<br />
Mid-Atlantic Region - DC, MD,<br />
VA, WV<br />
Michelle Harris<br />
michelle_harris@apsva.us<br />
New England Region - CT, ME,<br />
MA, NH, RI, VT<br />
Lisa Sarah Alter<br />
lalter@snet.net<br />
New York Region - NY<br />
Gilles Reimer<br />
greimer@hvc.rr.com<br />
North Central Region - MT, NE,<br />
ND, SD, WY<br />
Eddie Cohen<br />
ecohen@pway.org<br />
Northwest Region - AK, ID, OR,<br />
WA & British Columbia<br />
David Gillam<br />
dlgillam@acsalaska.net<br />
South Central Region - AR, KS,<br />
LA, OK, TX<br />
Kurtis Koll<br />
kurtisk@cameron.edu<br />
Southeastern Region - AL, FL,<br />
GA, MS, NC, PR, SC, TN<br />
Dave Rodriguez<br />
cdrodriguez@mac.com<br />
Southwest Region - AZ, CO,<br />
NM, UT<br />
Pamela Whiffen<br />
pwpwr@aol.com<br />
Appointed Directors<br />
Tom Ervin – tomervin@mchsi.com<br />
Ron Fabich –<br />
rfabick@zoominternet.net<br />
Parker Pennington IV –<br />
p.o.pennington@gmail.com<br />
Rick Jones –<br />
rmjones7@hawaii.edu<br />
Joe Monaco – monacoj@aol.com<br />
John Moore – mr.moore.john@<br />
gmail.com
Page 4<br />
<strong>The</strong> <strong>Earth</strong> <strong>Scientist</strong><br />
NESTA<br />
Coordinators<br />
Affiliates Coordinator<br />
Ron Fabich<br />
rwfabich@gmail.com<br />
Conference Logistics<br />
Coordinators<br />
Kim Warschaw<br />
kschlussel@cox.net<br />
Michelle Harris<br />
michelle_harris@apsva.us<br />
Membership Coordinator<br />
Bruce Hall<br />
brucehall42@gmail.com<br />
Merchandise Coordinator<br />
Howard Dimmick<br />
dimmick@esteacher.org<br />
Procedures Manual<br />
Coordinator<br />
Parker Pennington IV<br />
p.o.pennington@gmail.com<br />
Rock Raffle Coordinators<br />
Parker Pennington IV<br />
p.o.pennington@gmail.com<br />
Kimberly Warschaw<br />
kschlussel@cox.net<br />
Share-a-thon Coordinator<br />
Michelle Harris<br />
michelle_harris@apsva.us<br />
Volunteer Coordinator<br />
Joe Monaco<br />
MonacoJ@aol.com<br />
Webpage Coordinator<br />
Jack Hentz<br />
hentz@aaps.k12.mi.us<br />
E-News Editor<br />
Richard Jones<br />
rmjones7@hawaii.edu<br />
As usual, NESTA will hold our signature events - the NESTA Share-a-Thon and Rock and Mineral<br />
Raffle - at each of the fall NSTA Area Conferences in addition to multiple workshops and short<br />
courses in Louisville and Atlanta on planetary science (see the list of our fall events in this issue).<br />
We hope to see you at our events, and invite you to participate as a presenter at one of our Sharea-Thons.<br />
If you are interested in presenting at one or more of our upcoming Share-a-thons, please<br />
apply at https://www.nestanet.org/cms/content/conferences/nsta/shareathons/apply , and<br />
NESTA’s Share-a-Thon Coordinator, Michelle Harris, will be in touch with you soon.<br />
Best Regards,<br />
Dr. Roberta Johnson, Executive Director, NESTA<br />
And Guest Editor of this special, NSF sponsored, Climate Change issue of TES<br />
TES Editor<br />
Tom Ervin<br />
Twenty Five Years Ago in TES<br />
Twenty Five years ago, in 1987, TES was in its fourth year of publication. <strong>The</strong> cover of<br />
Volume 4, issue 3 featured photos<br />
of four volcanoes: (clockwise from<br />
lower left they are Crater Lake, Oregon,<br />
Polomolak, Philippines, Sunset Crater,<br />
California and Mauna Loa, Hawaii.<br />
<strong>The</strong>se were fitting photos since the<br />
first 19 pages of the issue were devoted<br />
to five articles regarding volcanoes.<br />
<strong>The</strong>se articles were followed by an<br />
article on behavioral objectives and<br />
how they relate to <strong>Earth</strong> science lesson planning.<br />
This article was followed by an article listing computer programs for use in <strong>Earth</strong><br />
science classroom which were either free (public domain) or “low cost” (up to $100<br />
commercially available).<br />
HELP WANTED!<br />
NESTA needs you to help us run our events at the NSTA Fall<br />
Conferences in Louisville, Atlanta and Phoenix. At the 2013 spring NSTA<br />
in San Antonio, we need volunteers to help with our Share-a-thons, Rock<br />
Raffle, and at our Exhibit Hall booth. If you feel that you can help, contact<br />
Joe Monaco, NESTA Volunteer Coordinator: monacoj@aol.com<br />
© 2012 National <strong>Earth</strong> Science Teachers Association. All Rights Reserved.
Volume XXVIII, Issue 3<br />
Page 5<br />
n<br />
n<br />
n<br />
n<br />
n<br />
n<br />
n<br />
n<br />
n<br />
n<br />
n<br />
n<br />
n<br />
Particularly useful online resources for<br />
climate change education<br />
Our Changing Planet – a collaboration of NBC Learn and NESTA<br />
(Windows to the Universe) with support of NSF, providing beautiful short<br />
videos and associated classroom activities on over a dozen topics at http://<br />
www.windows2universe.org/earth/changing_planet/changing_planet.<br />
html<br />
Windows to the Universe – hundreds of pages of content on climate and<br />
global change at upper elementary, middle, and high school levels, presented<br />
in English and Spanish at http://www.windows2universe.org/earth/<br />
climate/climate.html as well as over 50 classroom activities on climate<br />
change topics in the Teacher Resources/Activities section at http://www.<br />
windows2universe.org/php/teacher_resources/activity.php#6<br />
CO2Now.org – with daily updates on the level of CO 2 in the atmosphere,<br />
and supporting resources at http://co2now.org/<br />
National Snow and Ice Data Center – with regular updates on conditions<br />
in polar regions, reports, and images at http://nsidc.org/<br />
Scripps Institute of Oceanography (home of the Keeling curve) http://<br />
scrippsco2.ucsd.edu/home/index.php<br />
Skeptical Science – continuous updates on arguments regarding global<br />
warming and climate change at http://www.skepticalscience.com<br />
Real Climate – updates from climate scientists at http://www.realclimate.<br />
org/<br />
NOAA Climate Portal – with resources for teachers at http://www.climate.<br />
gov/#education<br />
NASA Global Climate Change: Vital Signs of the Planet – with background<br />
information and resources for teachers and students at http://climate.nasa.<br />
gov/<br />
NASA Goddard Institute for Space Science – with links to multiple<br />
programs, including the EdGCM and the GISS Surface Temperature<br />
Analysis Program at http://www.giss.nasa.gov/<br />
Alliance for Climate Education (ACE) – a program with student leadership<br />
opportunities at http://www.acespace.org/<br />
Environmental Protection Agency (EPA) Climate Change – resources<br />
for students, teachers, and administrators at http://www.epa.gov/climatechange/wycd/school.html<br />
National Academies of Science Climate Change Education Roundtable<br />
– reports from NAS Roundtable on issues in climate change education at<br />
http://www7.nationalacademies.org/bose/Climate_Change_Education_<br />
Homepage.html<br />
<strong>The</strong> <strong>Earth</strong> <strong>Scientist</strong><br />
EDITOR<br />
Tom Ervin<br />
PUBLICATIONS COMMITTEE<br />
Linda Knight, Chair<br />
Tom Ervin, TES Editor<br />
Parker Pennington IV<br />
Howard Dimmick<br />
Ardis Herrold<br />
Missy Holzer<br />
Richard Jones<br />
CONTRIBUTING AUTHORS<br />
Steve Ackerman, Erin Bardar, Melinda Bell, Geoff<br />
Camphire, Joëlle Clark, Tanya A. Dewey , Katherine<br />
Ellins, Nick Haddad, Carol Haden, EdD, George<br />
Starr Hammond, Louise Huffman, Bruce Hungate,<br />
PhD, Tommy Jasmin, Andrew Kwok, Tamara<br />
Shapiro Ledley, Julie Libarkin, Jane Marks, PhD,<br />
Mark S. McCaffrey, Galen A. McKinley, Karen<br />
McNeal, Margaret E. Mooney, Jean Pennycook,<br />
Vanessa L. Peters, Frank Rack, Nancy Butler Songer,<br />
Betsy Youngman, Tom Whittaker<br />
<strong>The</strong> <strong>Earth</strong> <strong>Scientist</strong> is the journal of the<br />
National <strong>Earth</strong> Science Teachers Association<br />
(NESTA).<br />
<strong>The</strong> <strong>Earth</strong> <strong>Scientist</strong> is published quarterly (January,<br />
March, June, September) and distributed to<br />
NESTA members. Back issues of <strong>The</strong> <strong>Earth</strong><br />
<strong>Scientist</strong> are available for sale through the NESTA<br />
Office for $10 per copy.<br />
Advertising is available in each issue of <strong>The</strong> <strong>Earth</strong><br />
<strong>Scientist</strong>. If you wish to advertise, visit http://www.<br />
nestanet.org/cms/content/publications/tes/<br />
advertising.<br />
To become a member of NESTA visit www.<br />
nestanet.org.<br />
To get more information about NESTA or<br />
advertising in our publications, or to get copies<br />
of back issues, contact the NESTA Office at<br />
720-328-5351 or marlene.dimarco@gmail.com<br />
Copyright © 2012 by the National <strong>Earth</strong> Science<br />
Teachers Association. All rights thereunder<br />
reserved; anything appearing in <strong>The</strong> <strong>Earth</strong> <strong>Scientist</strong><br />
may not be reprinted either wholly or in part<br />
without written permission.<br />
DISCLAIMER<br />
<strong>The</strong> information contained herein is provided as<br />
a service to our members with the understanding<br />
that National <strong>Earth</strong> Science Teachers Association<br />
(NESTA) makes no warranties, either expressed<br />
or implied, concerning the accuracy, completeness,<br />
reliability, or suitability of the information.<br />
Nor does NESTA warrant that the use of this<br />
information is free of any claims of copyright<br />
infringement. In addition, the views expressed in<br />
<strong>The</strong> <strong>Earth</strong> <strong>Scientist</strong> are those of the authors and<br />
advertisers and may not reflect NESTA policy.<br />
DESIGN/LAYOUT<br />
Patty Schuster, Page Designs<br />
Printed and bound by<br />
Scotsman Press, Syracuse, NY on recycled<br />
paper using soy ink.<br />
© 2012 National <strong>Earth</strong> Science Teachers Association. All Rights Reserved.
Page 6<br />
<strong>The</strong> <strong>Earth</strong> <strong>Scientist</strong><br />
Article Reviewers<br />
for this Fall TES<br />
Lisa Alter<br />
Michael Chandler<br />
LuAnn Dahlmann<br />
Teresa Eastburn<br />
Lisa Gardiner<br />
Rebecca Hatheway<br />
Sandra Henderson<br />
Ardis Herrold<br />
Linda Knight<br />
Nicole LaDue<br />
Jean May-Brett<br />
Bruce Moravchik<br />
Heather Pacheco<br />
Margaret Turrin<br />
Wendy Van Norden<br />
Janet Warburton<br />
NESTA Workshops at the fall 2012 NSTA<br />
Area Conferences<br />
NESTA is pleased to announce our sessions at the NSTA Area Conference for fall 2012.<br />
Want to present at one or more of our Share-a-Thons? Sign up to present at a NESTA<br />
Share-a-Thon at www.nestanet.org/cms/content/conferences/nsta/shareathons/apply.<br />
NESTA sessions in Louisville<br />
Friday, October 19<br />
All events on Friday are in the Kentucky International Convention Center, L15<br />
8:00 – 9:00 am - Activities from Across the <strong>Earth</strong> System<br />
9:30 - 10:30 pm - Let’s Get Well Grounded!<br />
11:00 am - noon - Climate Change Classroom Toolkit<br />
12:30 – 1:30 pm – Our Changing Planet<br />
2:00 - 3:00 pm - Share-a-Thon<br />
5:00 – 6:00 pm - Rock and Mineral Raffle<br />
Saturday, October 20<br />
Short Course: Exploring Planetary Science and Astronomy: What Would Galileo Do? Louisville<br />
Marriott, Kentucky C/D, 9:00 am – noon. Ticketed Event: $57 advance; $62 on-site.<br />
Purchase tickets when you register online for NSTA or on the Louisville Advance<br />
Registration Form.<br />
NESTA sessions in Atlanta<br />
Friday, November 2<br />
All events on Friday are in the Georgia World Congress Center, B401/B402<br />
8:00 – 9:00 am - Climate Change Classroom Toolkit<br />
9:30 - 10:30 pm - Let’s Get Well Grounded!<br />
11:00 am - noon – Activities from Across the <strong>Earth</strong> System<br />
12:30 – 1:30 pm – Our Changing Planet<br />
2:00 - 3:00 pm - Share-a-Thon<br />
3:30 – 4:30 pm - Rock and Mineral Raffle<br />
Saturday, November 3<br />
Short Course: Exploring Planetary Science and Astronomy: What Would Galileo Do? Georgia World<br />
Congress Center, B404, 9:00 am – noon. Ticketed Event: $55 advance; $60 on-site. Purchase<br />
tickets when you register online for NSTA or on the Atlanta Advance Registration Form.<br />
NESTA sessions in Phoenix<br />
Friday, December 7<br />
All events on Friday are in the Phoenix Convention Center, 132 A-C<br />
8:00 – 9:00 am - Climate Change Classroom Toolkit<br />
9:30 - 10:30 pm – Activities from Across the <strong>Earth</strong> System<br />
11:00 am - noon – Let’s Get Well Grounded!<br />
12:30 – 1:30 pm – Our Changing Planet<br />
2:00 - 3:00 pm – Share-a-Thon<br />
3:30 – 4:30 pm – Rock and Mineral Raffle<br />
© 2012 National <strong>Earth</strong> Science Teachers Association. All Rights Reserved.
Volume XXVIII, Issue 3<br />
Page 7<br />
Discovering Careers<br />
in the <strong>Earth</strong> Sciences<br />
By Geoff Camphire<br />
Celebrate <strong>Earth</strong> Science Week 2012<br />
Jobs and employment issues are important to everyone<br />
-- especially students. Has there ever been a better time<br />
to promote awareness of the many exciting careers<br />
opportunities available in the <strong>Earth</strong> sciences?<br />
That’s why <strong>Earth</strong> Science Week 2012 will focus on the<br />
theme of “Discovering Careers in the <strong>Earth</strong> Sciences.” During the<br />
15th annual <strong>Earth</strong> Science Week (Oct. 14-20, 2012), millions of people, in all 50 states and around<br />
the globe, will learn about the work of geoscientists by conducting classroom activities, preparing<br />
competition projects, ands well as visiting parks, museums, and science centers. Each year, the<br />
American Geosciences Institute (AGI) reaches more than 48 million<br />
people through its <strong>Earth</strong> Science Week campaign promoting better<br />
understanding of <strong>Earth</strong> science and stewardship of the planet.<br />
Day by Day<br />
Join in activities emphasizing different areas of the geosciences on different days:<br />
n<br />
n<br />
n<br />
n<br />
Sunday, Oct. 14, <strong>Earth</strong>Cachers worldwide will take part in geocaching “treasure hunts” for on<br />
International <strong>Earth</strong>Cache Day (www.earthcache.org), on Sunday, Oct. 14.<br />
On Monday, Oct. 15, <strong>Earth</strong> Science Literacy Day will focus on videos illustrating the field’s “Big<br />
Ideas” (www.earthsciweek.org/forteachers/bigideas/main.html).<br />
Tuesday, Oct. 16, No Child Left<br />
Inside Day invites young people to go<br />
outdoors and learn about <strong>Earth</strong> science<br />
firsthand (www.earthsciweek.org/ncli).<br />
Wednesday, Oct. 17, <strong>The</strong> National Park<br />
Service and AGI are collaborating to<br />
conduct the third annual National<br />
Fossil Day (http://nature.nps.gov/<br />
geology/nationalfossilday/).<br />
© 2012 National <strong>Earth</strong> Science Teachers Association. All Rights Reserved.
CLIENT: P2K SAVED: 7-27-12 OUTPUT AT: 100%<br />
Page 8<br />
<strong>The</strong> <strong>Earth</strong> <strong>Scientist</strong><br />
About the<br />
Author<br />
Geoff Camphire is <strong>Earth</strong><br />
Science Week Program<br />
Manager, American<br />
Geosciences Institute,<br />
4220 King Street,<br />
Alexandria, VA 22302,<br />
gac@agiweb.org.<br />
n<br />
n<br />
Thursday, Oct. 18, <strong>The</strong> Association for Women Geoscientists urges you to share the excitement of<br />
geoscience careers with young women, on Women in the Geosciences Day.<br />
On Friday, Oct. 19, celebrate the first-ever Geologic Map Day. Hosted by the U.S. Geological<br />
Survey and the Association of American State Geologists along with AGI, this event promotes<br />
awareness of the importance of geologic mapping for education, science, business, and public<br />
policy. A poster, activities, and additional resources can be found online (www.earthsciweek.org/<br />
geologicmap).<br />
Get Involved<br />
How can you participate? This year’s educator kit and web site provide more than one hundred<br />
lessons, materials, and links on <strong>Earth</strong> science. To receive the $6.95 kit, including the Geologic Map<br />
Day poster and dozens of other resources, order online (www.earthsciweek.org/materials/index.<br />
html) or call 703-379-2480. <strong>The</strong> 2012 <strong>Earth</strong> Science Week Poster (enclosed in this issue of <strong>The</strong><br />
<strong>Earth</strong> <strong>Scientist</strong>) features a learning activity designed to help young people think about careers in the<br />
<strong>Earth</strong> sciences. Visit the <strong>Earth</strong> Science Week web site (www.earthsciweek.org) to find out about ways<br />
to get involved, events and organizations in your community, educational activities, the monthly<br />
electronic newsletter, and much more.<br />
Students can enter AGI’s <strong>Earth</strong> Science Week contests. <strong>The</strong> photography contest, open to all ages,<br />
focuses on the theme “<strong>Earth</strong> Science Is a Big Job.” Students in kindergarten through grade five<br />
may enter the visual arts contest, “Imagine Me, an <strong>Earth</strong> <strong>Scientist</strong>!” In addition, students in grades<br />
six through nine can enter the essay contest, which highlights “Geoscientists Working Together.”<br />
Information on rules and prizes is online (www.earthsciweek.org/contests). Have a great <strong>Earth</strong><br />
Science Week!<br />
“I’ve used ETOM for the past couple of years...<br />
excellent resources, and my kids enjoy it<br />
and learn from it.”<br />
KG, Middle & High School science teacher<br />
AS<br />
SEEN<br />
ON<br />
<strong>Earth</strong>: <strong>The</strong> Operators’ Manual presents essential climate<br />
science, sustainable solutions & amazing locations,<br />
hosted by award-winning geoscientist, RICHARD ALLEY.<br />
3 DVDS IN CLASSROOM-READY SEGMENTS<br />
EARTH: <strong>The</strong> Operators’ Manual is based upon work supported by the National Science Foundation under Award 0917564. Any opinions, findings and conclusions or recommendations<br />
expressed in this material are those of PASSPORT TO KNOWLEDGE / Geoff Haines-Stiles Productions, Inc., and do not necessarily reflect those of the National Science Foundation.<br />
SPECIAL OFFER<br />
for NESTA/<strong>The</strong> <strong>Earth</strong> <strong>Scientist</strong> readers<br />
Buy 2 Programs, Get 3rd DVD Free!<br />
To order, please visit:<br />
http://earththeoperatorsmanual.com/feature/shop-etom<br />
© 2012 National <strong>Earth</strong> Science Teachers Association. All Rights Reserved.
Volume XXVIII, Issue 3<br />
Page 9<br />
<strong>The</strong> Carbon Cycle<br />
Game: A Regionally<br />
Relevant Activity<br />
to Introduce<br />
Climate Change<br />
Joëlle Clark, Jane Marks, PhD, Carol Haden, EdD,<br />
Melinda Bell, Bruce Hungate, PhD<br />
Illustration by Landis<br />
Bahe, Navajo artist http://<br />
artofthepeople.org/LandisBahe.<br />
html<br />
Abstract<br />
<strong>The</strong> “Carbon Cycle Game” is introduced as a regionally relevant activity for students to<br />
experience the carbon cycle. In the game, students behave as carbon molecules moving<br />
between reservoirs (hydrosphere, biosphere, lithosphere, and atmosphere). Students select<br />
cards that instruct them to take on the role of a carbon molecule. <strong>The</strong> cards provide information<br />
about a carbon cycling process and direct students how to move from one carbon<br />
reservoir to another. Students conduct ten rounds of cycling while recording where they<br />
went and how long they stayed. <strong>The</strong> game concludes with a discussion of student experiences<br />
and a review of the carbon cycle. Teacher feedback on the implementation and<br />
impact on learning in the classroom indicates high levels of student engagement and effective<br />
strategies to learn about carbon and its role in climate change. Although the lesson is<br />
regionally based, it can easily be adapted to other regions of the globe, if needed.<br />
<strong>The</strong> Carbon Cycle Game: A Regionally Relevant Activity to<br />
Introduce Climate Change<br />
According to the 2007 synthesis report prepared by the Intergovernmental Panel on Climate<br />
Change (IPCC), the main drivers for climate change are increased concentrations of greenhouse<br />
gases and aerosols and increased global radiation in the atmosphere and on the <strong>Earth</strong>’s surface<br />
(IPCC 2007, p. 15). Human activities have increased the concentrations of greenhouses gases in the<br />
<strong>Earth</strong>’s atmosphere, particularly carbon dioxide. Students are challenged to understand the role of<br />
carbon in global climate change.<br />
Students need to know how carbon cycles through <strong>Earth</strong>’s systems. <strong>The</strong> Framework for K-12<br />
Science Education (National Research Council 2012) outlines a vision for student learning that<br />
emphasizes the <strong>Earth</strong> as interconnected systems involving the atmosphere, hydrosphere, geosphere,<br />
and biosphere. Students are typically introduced to a carbon cycle in elementary or middle grades<br />
as a part of how matter cycles. Often, a diagram with arrows showing the flow of carbon is used<br />
to illustrate this process (See Figure 1: Example of Carbon Cycle Diagram). Research on student<br />
misconceptions indicates that students see the parts of this cycle, yet see the connections among<br />
the systems as fragmented. <strong>The</strong>y think the cycle involves cause and effect events with matter being<br />
created or destroyed during those events. To them, each part of the cycle represents a new, not<br />
continuous, event (Driver, Squire, Rushworth, & Wood-Robinson 1994). This disjointed view of<br />
how carbon moves, makes it difficult to apply the carbon cycle to environmental issues, such as<br />
© 2012 National <strong>Earth</strong> Science Teachers Association. All Rights Reserved.
Page 10<br />
<strong>The</strong> <strong>Earth</strong> <strong>Scientist</strong><br />
Figure 1. Carbon Cycle example<br />
(Source: National Research Council of the National<br />
Academies Ocean Acidification: Starting with the<br />
Science booklet, http://oceanacidification.nas.<br />
edu/?page_id=29)<br />
climate change. To the students, the word “cycle” infers that every<br />
carbon molecule follows the same series of events over and over again,<br />
thus students underestimate differences in frequencies of some<br />
processes, as well as different rates of storage among the reservoirs.<br />
Figure 2. <strong>The</strong> Carbon Cycle Game, teaches the carbon cycle<br />
by engaging students to behave as carbon molecules and<br />
move between reservoirs (hydrosphere, biosphere, lithosphere,<br />
atmosphere), stationed around the classroom. Students conduct<br />
ten rounds of cycling while recording where they went and how<br />
long they stayed. <strong>The</strong> game concludes with a discussion of student<br />
experiences and review of the carbon cycle.<br />
(Source: <strong>The</strong> Climate Change Science and Solutions: Creating Innovative Education Tools for Native<br />
Americans and Other Rural Communities on the Colorado Plateau, a Climate Change Education<br />
Partnership grant funded by the National Science Foundation to Northern Arizona University.)<br />
In an effort to deepen understanding of the carbon cycle, students can<br />
play a carbon cycle game (See Figure 2: <strong>The</strong> Carbon Cycle Game) . <strong>The</strong><br />
learning goal of the game is for students to experience how carbon<br />
molecules are transferred between carbon reservoirs, what’s the relative<br />
amount of time carbon remains in any given reservoir, and which<br />
processes initiate a change in carbon from one form and reservoir to<br />
another. A carbon reservoir is defined as a natural storage place for<br />
carbon. <strong>The</strong> game involves students physically moving from one carbon<br />
reservoir to another, based on information provided by the carbon cycle<br />
game cards. Students record their carbon molecule’s journey for later<br />
discussion of the carbon cycle (See Figure 3: Carbon Cycle Recording<br />
Sheet). For example, students learn that carbon can move from the<br />
atmosphere to the biosphere through the process of photosynthesis.<br />
Afterwards, carbon can move from the biosphere to the lithosphere<br />
where it can be buried for millions of years as a fossil fuel.<br />
<strong>The</strong> Carbon Game senario is situated on the Colorado Plateau, a<br />
geographic region in the western United States that includes the<br />
Four Corners states of Arizona, New Mexico, Utah, and Colorado.<br />
© 2012 National <strong>Earth</strong> Science Teachers Association. All Rights Reserved.
Volume XXVIII, Issue 3<br />
Page 11<br />
This semi-arid region is known for its dramatic landscapes<br />
consisting of canyons, plateaus, and colorful rock formations.<br />
<strong>The</strong> Grand Canyon is the most famous landmark in the region.<br />
For geographic authenticity, the carbon cycle represented in the<br />
regional game does not include the ocean nor the cryosphere<br />
although students learn about these during the post game discussion.<br />
<strong>The</strong> game was adapted and modified by a team of educators<br />
and climate scientists as part of a larger climate science and<br />
solutions curriculum supplement for students on the Colorado<br />
Plateau. <strong>The</strong> ideas for the Colorado Plateau carbon cycle game<br />
originated from other carbon cycle games available on the<br />
Internet (Gardiner & Genyuk , 2006 and Kreger 2004).<br />
Prior to playing the game, a teacher must create seven reservoir<br />
stations spread around the room. Each station contains a poster<br />
and a set of game cards (See Figure 2). To play the game, students<br />
are initially assigned to one of the seven stations: hydrosphere,<br />
lithosphere–limestone, lithosphere–fossil fuels, biosphere–soils,<br />
biosphere–animals, biosphere–soils, and atmosphere. At their<br />
station, students select a card, read and record the pertinent information<br />
regarding their carbon molecule including a description<br />
of the form of carbon and the process of transformation (See<br />
Figure 3). Regional examples of rock formations, plants, animals,<br />
and locations are used to help students recognize the dynamic<br />
nature of the carbon cycle in the past, present, and future. After<br />
recording the information from the card, the student moves to the station (or maybe stays put) as<br />
indicated by the information presented. <strong>The</strong> student selects a different card and continues the process<br />
until he/she has played 10 rounds. One round consists of a carbon game card played from the initial<br />
reservoir to the ending reservoir. <strong>The</strong> number of cards available at each reservoir is shown at the right.<br />
It takes an average of 20 minutes to play ten rounds depending on the age and background knowledge<br />
of the students.<br />
Figure 3. Carbon Cycle Game<br />
Recording Sheet<br />
(Source: the Climate Change Science and<br />
Solutions: Creating Innovative Education Tools for<br />
Native Americans and Other Rural Communities<br />
on the Colorado Plateau, a Climate Change<br />
Education Partnership grant funded by the<br />
National Science Foundation to Northern Arizona<br />
University.)<br />
Each student has a unique experience playing the game. Students begin at<br />
different reservoirs and each card leads to different reservoir destinations.<br />
Examples of a set of three Colorado Plateau Carbon Game cards illustrate both<br />
the process of carbon moving and how regional information is incorporated<br />
into learning (See Figure 4). Students do not get to choose where to begin.<br />
Instructions recommend that the teacher randomly assign students to start at a<br />
particular reservoir. <strong>The</strong> students then follow the journey of a carbon molecule<br />
to other reservoirs as indicated on the cards.<br />
Students analyze their findings from the cards, responding to the following<br />
questions individually in their science journals/notebooks:<br />
Reservoir<br />
Lithosphere – Fossil Fuels<br />
Lithosphere – Limestone<br />
Biosphere - Plant<br />
Biosphere – Animal<br />
Biosphere<br />
Atmosphere<br />
Hydrosphere<br />
1. In which reservoirs did you remain for millions of years before you were able to go to a new<br />
reservoir?<br />
2. Which processes move carbon fairly quickly from one reservoir to another? For example,<br />
what process moves carbon between the atmosphere and the biosphere? What process<br />
moves carbon from the biosphere to the atmosphere?<br />
Number of Cards<br />
4 Cards<br />
4 Cards<br />
11 Cards<br />
5 Cards<br />
5 Cards<br />
11 Cards<br />
8 Cards<br />
Table 1. Number of Carbon Game<br />
Cards for Each Reservoir<br />
(Source: Author)<br />
© 2012 National <strong>Earth</strong> Science Teachers Association. All Rights Reserved.
Page 12<br />
<strong>The</strong> <strong>Earth</strong> <strong>Scientist</strong><br />
3. What evidence do you see, from the game or from your<br />
own experience, regarding how humans are changing the<br />
carbon cycle?<br />
Figure 4. Example of the start<br />
to a possible carbon molecule<br />
journey a student may follow<br />
using the Carbon Game cards.<br />
(Source: the Climate Change Science and<br />
Solutions: Creating Innovative Education Tools for<br />
Native Americans and Other Rural Communities on<br />
the Colorado Plateau, a Climate Change Education<br />
Partnership grant funded by the National Science<br />
Foundation to Northern Arizona University.)<br />
Students find that they remain longest in the lithosphere<br />
and return most often to the atmosphere. Some<br />
lithosphere cards indicate to students that the<br />
carbon is still buried and so remains in the lithosphere.<br />
Students then select a different lithosphere<br />
card and collect new information. Eventually,<br />
students will obtain a card in which the carbon<br />
is released and students then can move to<br />
a different reservoir. Students can become<br />
frustrated initially by being “stuck” in the lithosphere.<br />
However, the game is a simulation and<br />
therefore models how carbon moves through the<br />
various reservoirs including the relative length of time carbon is sequestered in each reservoir. In<br />
addition, the model allows students to begin to explore the idea that human activities can release<br />
increased carbon dioxide into the atmosphere. More students, and thus more carbon, move through<br />
the atmosphere reservoir.<br />
To conclude the lesson, students draw and label their own diagrams of a carbon cycle based on<br />
their experience with the game. <strong>The</strong>y compare their diagram with other examples of carbon cycle<br />
diagrams from more conventional sources, such as textbooks, to reinforce the learning. This gamestyle<br />
introduction to climate change sets a foundation for students to learn more about carbon<br />
dioxide and other greenhouse gases, the greenhouse effect, carbon dioxide changes over time in the<br />
atmosphere, and the evidence for current global temperature increases.<br />
<strong>The</strong> Carbon Game was intentionally designed to incorporate multiple learning styles and to capitalize<br />
on student interest through regional references. Teachers using the Carbon Game, specifically<br />
mentioned the activity as a great example of providing students the opportunity to gain a deeper<br />
understanding of carbon and the biogeochemical cycle that occurs as carbon moves from one reservoir<br />
to another. <strong>The</strong> teachers also noted high student engagement and found that the game was an<br />
effective manner to introduce the role of carbon in climate change. One teacher commented about<br />
her students, “<strong>The</strong>y loved the Carbon Game. To me, learning about carbon was the bread and butter of the<br />
content.”<br />
<strong>The</strong> Carbon Game presented here is one example of a regionally relevant approach to teaching<br />
students about climate change. <strong>The</strong> benefit of this approach to learning is that it allows students to<br />
build conceptual understanding by providing a relatable context. Cognitive brain research on how<br />
people learn provides evidence that people develop new learning based on previous experiences and<br />
knowledge (Bransford, Brown, & Cocking 2000). It makes sense that students can construct their<br />
understanding of scientific concepts, like the carbon cycle, with new information that incorporates<br />
familiar regional examples. This instructional approach can easily be adapted and expanded to<br />
other regions of the world. One simply needs to use scientific information about how carbon moves<br />
through reservoirs while referring to regional places, animals, plants, bodies of water and geological<br />
formations. If you modify the Colorado Plateau version of the game to fit your region, then oceans,<br />
glaciers and ice sheets may need to be included in your version.<br />
© 2012 National <strong>Earth</strong> Science Teachers Association. All Rights Reserved.
Volume XXVIII, Issue 3<br />
Page 13<br />
References<br />
Bransford, J. D., Brown, A. L., & Cocking, R. R. (2000). How people learn:<br />
Brain, mind, experience, and school. (Expanded ed. ed.). Washington<br />
D.C.: National Academy Press.<br />
Driver, R., Squires, A., Rushworth, P., & Wood-Robinson, V. (1994).<br />
Making sense of secondary science: research into children’s ideas. London:<br />
RoutledgeFalmer.<br />
Gardiner, L., & Genyuk, J. (2006, November 6). <strong>The</strong> carbon cycle game.<br />
Retrieved from http://www.windows2universe.org/earth/climate/<br />
carbon_cycle.html<br />
Intergovernmental Panel on Climate Change (IPCC).(2007).Climate<br />
change 2007: synthesis report. Contribution of Working Groups I, II<br />
and III to the Fourth Assessment Report of the Intergovernmental<br />
Panel on Climate Change. [Core Writing Team: Pachauri, R.K,<br />
&Reisinger, A. (eds.)]. Geneva, Switzerland: IPCC. 104 pp.<br />
Kreger, C. (2004, November 10). Exploring the environment: Global climate<br />
change. Retrieved from http://www.cotf.edu/ete/modules/climate/<br />
GCcarbon1.html<br />
National Research Council. (2012). A framework for K-12 science<br />
education: practices, crosscutting concepts, and core ideas. Committee<br />
on a Conceptual Framework for New K-12 Science Education<br />
Standards.Board on Science Education, Division of Behavioral and<br />
Social Sciences and Education. Washington, DC: <strong>The</strong> National<br />
Academies Press.<br />
Summers, M., Kruger, C., Childs, A., &Mant, J. (2001). Understanding<br />
the science of environmental issues: development of a subject<br />
knowledge guide for primary teacher education. International<br />
Journal of Science Education, 23(1), 33-53.<br />
geoblox.com<br />
®<br />
<br />
Inexpensive<br />
Hands-on<br />
Accurate<br />
<strong>Earth</strong> & Space Models<br />
Wave Refraction<br />
~ Oceanography<br />
Block Models<br />
<br />
<br />
Alluvial Fan<br />
~ Topographic<br />
Landform Models<br />
About the Authors<br />
<strong>The</strong> authors are partners on a “Phase I - Climate Change Education<br />
Partnership” grant funded by the National Science Foundation to<br />
Northern Arizona University. <strong>The</strong> goal of “Climate Change Science And<br />
Solutions: Creating Innovative Education Tools For Native Americans<br />
And Other Rural Communities On <strong>The</strong> Colorado Plateau” was to develop<br />
and implement a middle school through high school climate change<br />
curriculum serving primarily Native American and rural students on the<br />
Colorado Plateau. Together with BSCS (Biological Sciences Curriculum<br />
Study), a nonprofit curriculum study committed to transforming science<br />
teaching and learning, the project created the Colorado Plateau Carbon<br />
Connections curriculum, a 10-lesson high school curriculum based on<br />
understanding the carbon cycle and its relevance to climate change. <strong>The</strong><br />
Carbon Cycle game is part of Lesson 2.<br />
Joëlle Clark, MA, is a Professional Development Coordinator for the<br />
Center for Science Teaching & Learning, Northern Arizona University.<br />
She is a science educator and an applied anthropologist who has<br />
designed, written, and taught science and culture curricula and<br />
professional development programs. Joëlle can be reached at<br />
Joelle.Clark@nau.edu<br />
Jane Marks, PhD, is the principal investigator for the project, a fresh<br />
water biologist and professor with the Biology Department, Northern<br />
Arizona University. Her leadership developed the partnership and<br />
created the vision for the climate science and solutions educational<br />
materials for the Colorado Plateau. She has also co-produced a PBS<br />
documentary titled “A River Reborn” directed by Emmy award winner<br />
Paul Bockhorst and narrated by Ted Danson. <strong>The</strong> film tells the story<br />
of the restoration of Fossil Creek and was aired on over 200 PBS<br />
stations. Dr. Marks can be reached at Jane.Marks@nau.edu<br />
Carol Haden, EdD, is a senior consultant with Magnolia Consulting,<br />
LLC, an evaluation and research company. She is a former science<br />
educator and the evaluator for the project. As a teacher, Carol taught<br />
on the Navajo reservation. Her current work focuses on designing<br />
and implementing formative and summative evaluation studies of<br />
programs in K-20 STEM education in formal and non-formal settings.<br />
Dr. Haden can be reached at Carol@magnoliaconsulting.org<br />
Melinda Bell, MAT, is a former high school biology teacher and is the<br />
curriculum developer for the project. She is a science curriculum<br />
developer and professional development provider. She has traveled<br />
as a teacher researcher, most notably as a PolarTREC Teacher in<br />
Antarctica. Melinda can be reached at Melinda.Bell@nau.edu<br />
Bruce Hungate, PhD, is a climate scientist and professor in the<br />
Biology Department and Merriam-Powell Center for Environmental<br />
Research, Northern Arizona University. His research focuses on<br />
ecosystem processes, especially carbon, water, and nutrient cycling.<br />
He studies biogeochemical responses to global changes, such as<br />
rising atmospheric CO 2 , climate change, nitrogen deposition, and<br />
altered land use.<br />
© 2012 National <strong>Earth</strong> Science Teachers Association. All Rights Reserved.
Page 14<br />
<strong>The</strong> <strong>Earth</strong> <strong>Scientist</strong><br />
<strong>The</strong> ELF (Environmental Literacy<br />
Framework with a Focus on Climate<br />
Change): Building Climate Change<br />
Science Knowledge Through<br />
Hands‐on Activities<br />
Louise Huffman, Jean Pennycook, Frank Rack, Betsy Youngman<br />
Abstract<br />
<strong>The</strong> ELF<br />
<strong>The</strong> ANDRILL (ANtarctic geological DRILLing) Science Management Office at the<br />
University of Nebraska-Lincoln and other members of our team, with funding from a<br />
NOAA (National Oceanic and Atmospheric Administration) Environmental Literacy grant<br />
(NA09SEC46900009), have created a series of hands-on activities that give middle and<br />
high school students a foundation in understanding the basics of climate change from<br />
an <strong>Earth</strong> systems approach to the topic. <strong>The</strong> entire series, entitled Environmental Literacy<br />
Framework (ELF), with a focus on climate change provides educators with a 5-unit collection<br />
of activities aimed at creating climate change science knowledge among students. <strong>The</strong><br />
5 units are organized around the idea of “a system of systems,” with energy exchanges<br />
providing the connections among the systems. Individual activities in each unit provide<br />
engaging entry level experiences intended to motivate students to ask questions and to<br />
build a strong base for scaffolding climate change knowledge through a careful construction<br />
of climate science concepts. This article focuses on one of the ELF activities, entitled<br />
<strong>Earth</strong>’s Albedo.<br />
Constructing learning and scaffolding experiences with new concepts is important to building<br />
the broad cognitive framework necessary for understanding the complexities of the climate<br />
system. Initial results from recent studies indicate that a constructivist and experiential approach<br />
to teaching climate change concepts builds students’ knowledge and ideas about the multiple<br />
and diverse dimensions of climate change issues. (Pruneau, 2010) With funding from a NOAA<br />
Environmental Literacy grant, the ANDRILL Science Management Office at the University of<br />
Nebraska-Lincoln and other members of our team, have created a series of hands-on activities that<br />
give middle and high school students a foundation for understanding the basics of climate change<br />
from an <strong>Earth</strong> systems approach to the topic. <strong>The</strong> “Environmental Literacy Framework (ELF), with a<br />
focus on climate change” provides educators with a 5-unit collection of activities aimed at creating<br />
climate change science knowledge organized around the idea of “a system of systems,” with energy<br />
exchanges providing the interactions between and within systems. Activities provide engaging entry<br />
level inquiry experiences intended to motivate students to ask questions and to build a strong<br />
© 2012 National <strong>Earth</strong> Science Teachers Association. All Rights Reserved.
Volume XXVIII, Issue 3<br />
Page 15<br />
base for scaffolding climate change knowledge through a careful construction of climate science<br />
concepts.<br />
<strong>The</strong> ELF activities are modeled after ANDRILL’s earlier resources titled Antarctica’s Climate Secrets,<br />
(Dahlman, 2007) or “Flexhibits.” (FLEXible exHIBITS). Students learn from building and manipulating<br />
the models and engaging in the activities, then using their materials to teach a different<br />
audience. Students take on the role of “teachers” and “scientists” as they teach concepts of climate<br />
science to audiences like younger students, community groups, or museum visitors. Taking part<br />
in a Flexhibit is a powerful learning experience and extends and cements the learning, because “No<br />
one…learns as much as the individual teaching [it] for the first time.” (Bodner, 2003)<br />
<strong>The</strong> ELF has been field tested by classroom teachers for two years with an extremely positive<br />
response from educators in grades 5 to AP Environmental science courses.<br />
“My department is loving the activities in the ELF curriculum. It has been very useful to have<br />
this ELF material with the background reading, materials lists, and procedures in one place. It<br />
is meaty content that meets our needs. …. (in) our 9th grade curriculum, the biology classes<br />
and environmental science classes have selected activities to enrich their content as well. Our<br />
school has greatly benefited from your efforts.”<br />
— Jennifer H., Seattle, Washington<br />
Each activity in the ELF includes background materials for the teachers, links to powerpoints for<br />
presenting the information to students, a glossary of terms, all data sheets, extension ideas, links<br />
to additional resources, and a correlation guide to National Science Standards. <strong>The</strong>re is a close<br />
correlation to the draft of the Next Generation Science Standards, and those will be posted online<br />
when the NGSS is finalized. <strong>The</strong> activities are intended to be extremely flexible and directions are<br />
written at a middle school reading level making it accessible to students whether the activities are<br />
used independently in class, for homework, in a lab setting or in an after school club or program.<br />
All activities are freely available for download at www.andrill.org/education/elf. This article will<br />
focus on one of the ELF activities.<br />
<strong>Earth</strong>’s Albedo<br />
In this hands-on activity, learners develop their conceptual knowledge of the term albedo (the ability<br />
of a surface to reflect energy) and create a model to illustrate the relationship between the albedo<br />
of various <strong>Earth</strong> surfaces and the energy balance of our planet. Students propose a relationship<br />
between the albedo of these surfaces and climate patterns observed around the world.<br />
Some of the questions learners are expected to address are:<br />
n<br />
n<br />
How do ice and snow help regulate the overall energy balance of the <strong>Earth</strong>?<br />
How will the impact of climate change and reductions in the amount of snow and ice affect<br />
the <strong>Earth</strong>’s ability to reflect incoming solar energy?<br />
As with all the activities in the ELF, this one begins with thoughtful focus questions for the learners,<br />
followed by background information and a description of the activity. For <strong>Earth</strong>’s Albedo, the<br />
students are given a common example of albedo from their everyday experience: “Think back to a<br />
hot summer day and the feeling of walking barefoot on grass and then a sidewalk or paved surface.”<br />
From there they are led to a conceptual understanding of albedo before working with the activity.<br />
<strong>The</strong> activity demonstrates and models how albedo varies with different <strong>Earth</strong> surfaces.<br />
Students gather their own data so group results may vary. Students then analyze the data using<br />
simple math processes and draw conclusions about how various <strong>Earth</strong> surfaces contribute to the<br />
© 2012 National <strong>Earth</strong> Science Teachers Association. All Rights Reserved.
Page 16<br />
<strong>The</strong> <strong>Earth</strong> <strong>Scientist</strong><br />
ACTIVITY 1D-<strong>Earth</strong>’s Albedo<br />
Print out a copies for the Albedo activity<br />
Unit-1 ENERGY<br />
overall <strong>Earth</strong> energy budget. <strong>The</strong>y are then asked to predict how changes<br />
in the overall amount of some surfaces like ice and snow will affect the<br />
<strong>Earth</strong>’s temperature and climate patterns.<br />
Land surface<br />
type<br />
Taiga and<br />
Boreal Forest<br />
Round<br />
1<br />
<strong>Earth</strong>'s Albedo Data Table<br />
Round Round<br />
Average<br />
2 3<br />
Of 3 Albedo<br />
rounds<br />
0.20<br />
Number<br />
Reflected<br />
(Average x<br />
albedo)<br />
Number<br />
Absorbed<br />
(Average –<br />
number reflected)<br />
Addressed in this activity are these National Science Education<br />
Standards 5-8:<br />
1. Physical Science Standard B<br />
Deserts and<br />
Shrubs<br />
0.30<br />
2. <strong>Earth</strong> Science Standard D<br />
Inland Water 0.10<br />
3. History and Nature of Science Standard G<br />
Coniferous<br />
0.10<br />
Forest<br />
Deciduous<br />
Forest 0.20<br />
Grassland 0.20<br />
Ocean 0.10<br />
Materials<br />
Materials for each team of students: All reproducible materials (maps,<br />
data table, etc.) can be found at http://www.andrill.org/education/elf/<br />
activities/1D<br />
67<br />
Tundra 0.20<br />
Ice and Snow 0.80<br />
Figure 1. <strong>Earth</strong>’s Albedo Data<br />
Table<br />
Source: http://www.andrill.org/<br />
education/elf/activities/1D<br />
1. 17” X 22” Global Biomes Map placed in a copy paper box top or similar<br />
tray with an edge to keep the popcorn kernels from falling off the work<br />
surface<br />
2. Plastic bag of 100 kernels of unpopped popcorn (representing 100% of<br />
the sun’s energy)<br />
3. Sorting tray (ice cube trays or egg cartons work well) labeled with the biomes from the<br />
map key<br />
4. Data table for recording results<br />
Directions<br />
1. Randomly sprinkle the popcorn kernels out of the bag over the<br />
entire surface of the map<br />
2. Collect and sort the kernels into the sorting tray, according to the<br />
nine different surfaces on which they landed<br />
3. Count the popcorn kernels in each section of the sorting tray;<br />
record the number of kernels counted onto the corresponding<br />
sections of the data table (See Figure 1)<br />
4. Return all popcorn to the original plastic bag<br />
5. Repeat steps #1-4 three times<br />
6. Average the number of kernels on each land surface type.<br />
7. Multiply the average number of popcorn by the albedo factor as<br />
shown on the data table.<br />
8. Complete the calculations and compare how much incoming solar<br />
radiation is absorbed by each type of surface<br />
Figure 2 (top). Working as a team to sort popcorn kernels according to the biome<br />
on which the kernals landed. Photo: Louise Huffman<br />
Figure 3 (bottom). Calculating <strong>Earth</strong>’s albedo. Photo: Louise Huffman<br />
© 2012 National <strong>Earth</strong> Science Teachers Association. All Rights Reserved.
Volume XXVIII, Issue 3<br />
Page 17<br />
Students will observe that solar radiation falling on surfaces such<br />
as snow and ice contributes less to the overall energy budget of the<br />
<strong>Earth</strong> than radiation falling on forests, water or deserts. Students<br />
then do a second round of the activity using the map without Arctic<br />
summer sea ice and compare how the loss of ice may affect <strong>Earth</strong>’s<br />
energy budget.<br />
Questions for students to ponder and discuss in their<br />
groups or as a class:<br />
1. What land surfaces reflect the most incoming radiation?<br />
2. What land surface types absorb the most incoming<br />
radiation?<br />
3. How would the total amount of the sun’s radiation absorbed by the <strong>Earth</strong> change if all of<br />
the tundra/taiga was covered year round with snow and not just in the winter as it is now?<br />
How would this change affect the <strong>Earth</strong>’s average temperature?<br />
4. How would the total amount of the sun’s radiation absorbed by the <strong>Earth</strong> change if there<br />
were fewer forests or more deserts? How would this affect the <strong>Earth</strong>’s average temperature?<br />
Figure 4. Comparing <strong>Earth</strong>’s<br />
albedo today with the albedo of<br />
<strong>Earth</strong> without any Arctic summer<br />
sea ice.<br />
Photo: Louise Huffman<br />
5. How would the decrease in the amount of snow and ice on the <strong>Earth</strong>’s surface change the<br />
amount of total energy absorbed by <strong>Earth</strong>? How would this affect the <strong>Earth</strong>’s average<br />
temperature?<br />
Student conclusions from this activity include:<br />
1. <strong>The</strong> amount of solar radiation absorbed (or reflected) by the <strong>Earth</strong> varies with the type<br />
of surface.<br />
2. <strong>The</strong> more solar radiation the <strong>Earth</strong> absorbs (the less reflected), the warmer the <strong>Earth</strong> will be.<br />
3. Any changes in the amount of solar radiation absorbed by the <strong>Earth</strong> affects the <strong>Earth</strong>’s climates.<br />
4. As the amount of ice and snow covering the <strong>Earth</strong>’s surface changes, the <strong>Earth</strong>’s temperature<br />
may also change.<br />
Conclusion<br />
<strong>The</strong> climate system is extremely complex. By actively engaging in hands-on inquiry activities,<br />
students construct scientific knowledge and develop a conceptual framework for building climate<br />
change knowledge. <strong>Earth</strong>’s Albedo is one such activity in which students create a model to illustrate<br />
the relationship between the albedo of various <strong>Earth</strong> surfaces and the energy balance of our planet.<br />
Students propose a relationship between the albedo of these surfaces and climate patterns observed<br />
around the world. As they manipulate their model, they observe that solar radiation falling on<br />
surfaces such as snow and ice contribute less to the overall energy budget of the <strong>Earth</strong> than radiation<br />
falling on forests, water or deserts. <strong>The</strong>y conclude that if climate change affects the amount of<br />
ice and snow covering the <strong>Earth</strong>’s surface, <strong>Earth</strong>’s temperature may also change.<br />
References<br />
Bodner G. Eternal verities: how the results in learning can improve the way we teach. Purdue University Workshop,<br />
2003.<br />
Dahlman, L. Antarctica’s climate secrets. 2008. http://www.andrill.org/flexhibit/flexhibit/materials/activities/index.html<br />
Pruneau, D. Gravel, H. Bourque, W. Langis, J. Experimentation with a socio-constructivist process for climate change<br />
education. Taylor Francis online, 2010.<br />
© 2012 National <strong>Earth</strong> Science Teachers Association. All Rights Reserved.
Page 18<br />
<strong>The</strong> <strong>Earth</strong> <strong>Scientist</strong><br />
About the Authors<br />
Louise Huffman, MS Ed, a former teacher with over 30 years of public school experience, is ANDRILL (ANtarctic geological DRILLing)<br />
Coordinator of Education and Public Outreach at the University of Nebraska-Lincoln (UNL). Besides teaching children, Huffman has worked<br />
with the Golden Apple Foundation providing professional development workshops on science inquiry for teachers. She is a Fellow in the Golden<br />
Apple Academy and was also twice recognized for Excellence in Teaching by the Illinois Science Teachers Association. She spent two research<br />
seasons in Antarctica including coordinating the ANDRILL ARISE (ANDRILL Research Immersion for Science Educators) program in 2007. During<br />
the International Polar Year (IPY) she served as the Chair of the Formal Education Subcommittee of the IPY Education and Outreach Committee.<br />
Louise can be reached at lhuffman@andrill.org<br />
Jean Pennycook, MS Ed, has been a secondary science teacher for more than 20 years in California. In that time she has promoted science<br />
education and excellence at all levels encouraging students to continue in higher education and pursue STEM related careers. Her first trip<br />
to Antarctica was in 1999 when she joined a team doing research on Mt Erebus. Since then she has focused her education and outreach on<br />
Adelie penguins, bringing Antarctic science research to classrooms worldwide. She is currently serving a second fellowship year with the Albert<br />
Einstein Distinguished Educator Fellowship Program at the National Science Foundation in Washington, DC. Jean can be reached at jean.<br />
pennycook@gmail.com<br />
Frank Rack, PhD, is the executive director of the ANDRILL Science Management Office at the University of Nebraska-Lincoln. His responsibilities<br />
include: strategic planning, project development, research, education and outreach and administrative oversight of the U.S. ANDRILL Program. Rack<br />
is also an associate professor in the Department of Geosciences at UNL. He participated in the ANDRILL McMurdo Ice Shelf Project deployment<br />
to Antarctica in 2006 and the Coulman High Site Survey Project in 2010-11. Prior to joining UNL and ANDRILL, Rack was director of ocean drilling<br />
programs at Joint Oceanographic Institutions, a non-profit corporation representing 20 U.S. academic institutions. Before that, he was assistant<br />
director, ocean drilling programs, and associate director of the U.S. Science Support Program. Dr. Rack can be reached at frack2@unl.edu<br />
Betsy Youngman, MS Ed, is a curriculum developer for a variety of educational projects across the nation including multiple <strong>Earth</strong>Labs<br />
modules. She has taught middle and high school science for 25 years, most recently in Phoenix. Youngman worked as a freelance writer, and<br />
is an active outdoorswoman, participating in cycling, hiking, skiing, and canoeing as a class 4-5 kayaker. She has worked on science research<br />
teams in Antarctica and Greenland. Betsy can be reached at betsy.youngman@gmail.com<br />
Open Windows to the Universe at<br />
www.windows2universe.org<br />
From <strong>Earth</strong> science to astronomy,<br />
your <strong>Earth</strong> and space science<br />
ecosystem for learning!<br />
• Science content – 9000+ pages<br />
• Over 100 classroom-tested<br />
activities, interactives and games<br />
• 3 levels, English and Spanish<br />
• Free Educator newsletter<br />
• Educator Members receive<br />
special services and benefits:<br />
‣ Free access to formatted classroom<br />
activities, student worksheets, Teacher keys, associated graphics<br />
and data, downloadable ppts and more! $230 value!<br />
‣ My W2U, Journal, store discounts, calendars, opportunities<br />
for teachers, web seminars, and no ads!<br />
Join Today<br />
$20/yr - $10/yr for<br />
NESTA members!<br />
www.windows2universe.org/<br />
membership.html<br />
Windows to the Universe is a project of the National <strong>Earth</strong> Science Teachers Association<br />
© 2012 National <strong>Earth</strong> Science Teachers Association. All Rights Reserved.
Volume XXVIII, Issue 3<br />
Page 19<br />
<strong>Earth</strong>Labs – An <strong>Earth</strong> System<br />
Science Laboratory Module<br />
to Facilitate Teaching About<br />
Climate Change<br />
Tamara Shapiro Ledley, Nick Haddad, Erin Bardar,<br />
Katherine Ellins, Karen McNeal, Julie Libarkin<br />
Abstract<br />
Climate science has emerged as an important domain of education because of the implications<br />
of climate change for society, the need to train future scientists to continue to<br />
increase our understanding of the climate system, and the need for citizens to make<br />
informed and responsible decisions about their environment. Yet climate science presents<br />
real challenges in cognition, perception and pedagogy, especially as it applies to understanding<br />
the <strong>Earth</strong> as a dynamic system of components interacting at local to global<br />
spatial scales and over multiple and embedded time scales.<br />
To facilitate student understanding of the complex interactions among the components<br />
of the <strong>Earth</strong> system and how that system changes over time, we have developed and implemented<br />
in classrooms,numerous high school level curriculum modules which make up<br />
<strong>Earth</strong>Labs. <strong>The</strong> currently available <strong>Earth</strong>Labs modules focus on Hurricanes, Drought, Corals,<br />
Fisheries, Climate and theCryosphere, and <strong>Earth</strong> System Science. In this article we focus on the<br />
implementation of <strong>Earth</strong>Labs in Texas classrooms and in particular the <strong>Earth</strong> System Science<br />
module. <strong>The</strong> <strong>Earth</strong> System Science module has been developed to guide students to understanding<br />
<strong>Earth</strong> system dynamics. This includes facilitating a deeper understanding of how<br />
the components of the <strong>Earth</strong> system interact to shape the climate system, and how this<br />
system can change over time. Students begin the modules by investigating the interactions<br />
among the components of the <strong>Earth</strong> system on scales they are familiar with – their<br />
own local environment. Once these concepts have been grasped, the scope is extended to<br />
regional and global spatial scales.<br />
Introduction<br />
Humans are modifying <strong>Earth</strong> without fully understanding how our actions affect the atmosphere,<br />
hydrosphere, biosphere, and geosphere. However, research indicates that increases in globally averaged<br />
temperatures of a few degrees this century will likely cause drought, floods, extreme weather, and sealevel<br />
rise (IPCC, 2007a, 2007b, 2007c). For society to develop strategies to address climate change there<br />
is an urgent need for the inclusion of climate literacy in public education. Yet climate literacy demands<br />
cognitive and perceptual leaps for students and teachers (Grotzer & Lincoln, 2007) with respect to<br />
understanding the complex interactions among the components of the <strong>Earth</strong> System.<br />
© 2012 National <strong>Earth</strong> Science Teachers Association. All Rights Reserved.
Page 20<br />
<strong>The</strong> <strong>Earth</strong> <strong>Scientist</strong><br />
Figure 1. Photograph of<br />
GLOBE study site in Greenville,<br />
Pennsylvania USA annotated<br />
with interactions between<br />
components of the <strong>Earth</strong> system.<br />
Source: <strong>Earth</strong>Labs ESS Lab 2A http://serc.<br />
carleton.edu/dev/eslabs/climate/2a.html and<br />
<strong>Earth</strong> as a System chapter of GLOBE Teachers<br />
Guide: Exploring the Connections activity LC2:<br />
Representing the Study Site in a Diagram, http://<br />
www.globe.gov/documents/356823/356868/<br />
earth_la_connections_lc1.pdf, page 9.<br />
Figure 2.Simplified diagram<br />
of the interactions of the<br />
components of the <strong>Earth</strong><br />
system at a GLOBE study site in<br />
Greenville, Pennsylvania USA.<br />
Source: <strong>Earth</strong>Labs ESS Lab 2B http://serc.<br />
carleton.edu/dev/eslabs/climate/2b.html and<br />
<strong>Earth</strong> as a System chapter of GLOBE Teachers<br />
Guide: Exploring the Connections activity LC2:<br />
Representing the Study Site in a Diagram, http://<br />
www.globe.gov/documents/356823/356868/<br />
earth_la_connections_lc1.pdf, page 10.<br />
<strong>Earth</strong>Labs (Teacher Guide: http://serc.carleton.edu/earthlabs, Student Portal: http://serc.carleton.<br />
edu/eslabs ) is an online curriculum for rigorous, quantitative lab science courses in <strong>Earth</strong> and<br />
environmental science. An <strong>Earth</strong>Labs module is comprised of six to nine sequenced labs intended<br />
to build on the knowledge and skills learned in the previous labs. With funding from the National<br />
Oceanographic and Atmospheric Administration (NOAA, NA05SEC4691004), the National Science<br />
Foundation (NSF, EAR-0807575), and the National Aeronautics and Space Administration (NASA,<br />
NNX09AL90G) there are six live <strong>Earth</strong>Labs modules: Hurricanes, Corals, Fisheries, Drought, Climate<br />
and the Cryosphere, and <strong>Earth</strong> System Science. Under current funding from the NSF (DUE-1019721,<br />
DUE-1019703, DUE-1019815) we are developing two additional modules: Climate, Weather and the<br />
Biosphere, and Carbon and the <strong>Earth</strong> System. In this article we describe the <strong>Earth</strong> System Science module<br />
and its implementation in Texas, provide teaching tips on module use, and describe evidence of<br />
impact on student learning about <strong>Earth</strong> system science.<br />
<strong>Earth</strong>Labs: <strong>Earth</strong> System Science (ESS) Module<br />
In the <strong>Earth</strong>Labs ESS module ( http://serc.carleton.edu/earthlabs/climate ) we begin by examining<br />
<strong>Earth</strong> systems processes on the time and space scales that are most familiar to students. <strong>The</strong> first<br />
few labs focus on the local scale – the scale that students experience every day; familiar places, such<br />
as the schoolyard, a park, or a common area in their community can be the focus at the local scale.<br />
<strong>The</strong> <strong>Earth</strong>Labs ESS Teacher Portal provides background information, lists of required materials,<br />
whether an internet connection is required, and the online tools that will be used. In this module,<br />
online tools include Google <strong>Earth</strong>, the GLOBE graphing tool, the NASA<br />
Ocean Motion Ship Drift Model, NEO (NASA <strong>Earth</strong> Observations tool<br />
and data), and ImageJ (a public domain Java image processing program<br />
that can read many image formats including tiff, gif and jpg and can<br />
display, edit, analyze, process, save and print results, is available at<br />
http://rsb.info.nih.gov/ij/download.html). Instructions are provided<br />
for using these tools to complete the activities.<br />
In the first lab, Think Globally, Act Locally, students learn about the<br />
different components of the <strong>Earth</strong> system and explore a local site for<br />
those connections. <strong>The</strong>y visit the site, photograph and identify various<br />
components of the <strong>Earth</strong> system, and describe these components<br />
within the context of the local environment. Students are then asked to<br />
predict how changes in one component might impact others.<br />
In the second lab, Drawing Local Connections, students annotate their<br />
photographs of the site with the interconnections they observed or<br />
inferred (Figure 1) , and consider how energy and matter are transferred<br />
between different components of the <strong>Earth</strong> system. <strong>The</strong> students are<br />
then asked to use their annotated photograph to create a simplified<br />
diagram of their site that highlights the most important interactions<br />
that define their local environment (Figure 2). This place-based<br />
approach results in highly localized responses with expected answers<br />
being different for temperate environments versus either desert or tropical<br />
environments.<br />
In the third lab, Discovering Local Data, students examine how the interactions<br />
between the components of the <strong>Earth</strong> system they have been<br />
exploring are reflected in observational data. This involves students<br />
looking at the relationships among four different variables measured at<br />
© 2012 National <strong>Earth</strong> Science Teachers Association. All Rights Reserved.
Volume XXVIII, Issue 3<br />
Page 21<br />
the local study site over the course of a year. While<br />
it would be ideal for students to work with observations<br />
taken locally, these data are not always available.<br />
In these cases, students can use data from a school<br />
in Greenville, Pennsylvania USA that has several<br />
continuous years of data. Students examine maximum<br />
surface air temperature, soil moisture at 10 cm and 90<br />
cm below the surface, and precipitation and see that<br />
as surface air temperatures rise in the spring, the 10<br />
cm, and later the 90 cm soil moisture, decrease. <strong>The</strong>y<br />
also see that precipitation events cause short-term<br />
increases in the 10 cm soil moisture (Figure 3).<br />
In the fourth lab, A Bird’s Eye View: Exploring Your<br />
Region, students focus their attention on an area<br />
significantly larger than their study site, applying<br />
their developing knowledge of local <strong>Earth</strong> system<br />
interactions to a regional scale. Although the scale being examined changes, the questions remain<br />
the same. For example: How does organism, process or event “A” influence, or become changed by, organism,<br />
process or event “B”? Specifically, in what ways is my local region interconnected with adjoining regions? What<br />
types of matter and energy cross regional boundaries to help define and shape neighboring regions? Although<br />
students investigate the region in which they live, the concept of a “site” changes: instead of<br />
focusing their attention on an actual plot of land, students investigate their region by combining<br />
their personal knowledge of the region with information they can learn from Google <strong>Earth</strong>.<br />
Students begin the fifth lab, It’s All Connected: Global Circulation, by looking at average wind and<br />
water patterns across the globe to explore how different regions of the world are connected. Onto<br />
a world map, they trace pathways of wind and water into and out of their region, and across an<br />
ocean to other regions on <strong>Earth</strong>. <strong>The</strong> ideas of movement of matter and energy across <strong>Earth</strong> are<br />
reinforced as students first predict where a bottle, dropped in the ocean, will go as a result of surface<br />
ocean currents over a period of time, and then use a computer model of ocean currents to test their<br />
predictions (Figure 4).<br />
Figure 3.Monthly averaged<br />
maximum air temperature,<br />
rainfall, and soil moisture at<br />
10cm and 90cm below the<br />
surface from April through June<br />
1998 in Greenville, Pennsylvania<br />
USA.<br />
Source: <strong>Earth</strong>Labs ESS Lab 3 http://serc.carleton.<br />
edu/dev/eslabs/climate/lab3.html and <strong>Earth</strong> as<br />
a System chapter of GLOBE Teachers Guide:<br />
Exploring the Connections activity LC3: Using<br />
Graphs to Show Connections, http://www.globe.<br />
gov/documents/356823/356868/earth_la_<br />
connections_lc3.pdf , page 10.<br />
Figure 4. Model<br />
simulations of the path<br />
over five years of a<br />
“bottle” dropped in the<br />
ocean off the southeast<br />
coast of the United<br />
States. <strong>The</strong> five tracks<br />
show the approximate<br />
effects of the ocean<br />
surface current<br />
variability.<br />
Source: <strong>Earth</strong>Labs ESS Lab 5b<br />
http://serc.carleton.edu/dev/eslabs/<br />
climate/5b.html and NASA Ocean<br />
Motion and Surface Currents, Ship<br />
Drift Model, http://oceanmotion.org/<br />
html/resources/drifter.htm.<br />
© 2012 National <strong>Earth</strong> Science Teachers Association. All Rights Reserved.
Page 22<br />
<strong>The</strong> <strong>Earth</strong> <strong>Scientist</strong><br />
In the sixth lab, Air, Water, Land, & Life: A Global Perspective, students review a variety of images and<br />
maps of the whole <strong>Earth</strong> using global NASA datasets to identify the major components of the <strong>Earth</strong><br />
system at the global scale. <strong>The</strong> maps show solar energy, average temperature, cloud cover, precipitation,<br />
soil moisture, and vegetation, and the images are of <strong>Earth</strong> from space. Students discuss<br />
ways that individual components interact to form the whole <strong>Earth</strong> system. After engaging in a<br />
role-playing game, students are able to describe the water cycle at the global scale in greater detail,<br />
identify the components of the <strong>Earth</strong> system through which water passes and the processes that<br />
move water, and draw an abstract diagram of the water cycle at the global scale.<br />
In the seventh and final lab, A Year in the Life of the <strong>Earth</strong> System, students consider change over time.<br />
How do the atmosphere, hydrosphere, pedosphere (soil), and biosphere change over the course of a year?<br />
What relationships exist between components of the <strong>Earth</strong> system at the global scale? Students use ImageJ<br />
to make a global map-based animation depicting monthly changes in one component of the <strong>Earth</strong><br />
system, allowing exploration of how <strong>Earth</strong> changes over time at the global scale. Students then<br />
make a similar animation of two datasets, providing opportunities to investigate relationships<br />
between different components of the <strong>Earth</strong> system over time.<br />
On completing the <strong>Earth</strong>Labs ESS module students are asked to reflect on what they have learned<br />
by describing the <strong>Earth</strong> as a complete system and giving specific examples of the ways that each<br />
component of the system impacts other components.<br />
Implementation of <strong>Earth</strong>Labs in Texas<br />
Seven high school teachers aided in the review of this <strong>Earth</strong>Labs ESS module as it was being<br />
developed and presented the module to 42 other Texas teachers at a professional development<br />
workshop. This was part of a larger University of Texas Institute for Geophysics-led<br />
TeXas <strong>Earth</strong> and Space Science Revolution (TXESS) Revolution program. This program (Ellins<br />
et al. 2011) is focused on developing the content knowledge and skills teachers need to enable<br />
them to teach the state’s current offering of a number of high school level <strong>Earth</strong> science courses,<br />
including: <strong>Earth</strong> and Space Science, Environmental Systems, Aquatic Science, Astronomy, and AP<br />
Environmental Science.<br />
Teaching Tips from the <strong>Earth</strong>Labs Teacher Partners<br />
<strong>The</strong> <strong>Earth</strong>Labs teachers implemented this <strong>Earth</strong>Labs ESS module in their classrooms as part of the<br />
research on the student learning component of the project. <strong>The</strong>se teachers have provided useful<br />
teaching tips to help other teachers implement this module. <strong>The</strong>se include:<br />
n<br />
n<br />
n<br />
n<br />
In the progression of studying <strong>Earth</strong> system interactions at local, regional, and global scales,<br />
the regional scale may be the most difficult. Highlighting the characteristics of your region is<br />
a good way to start; what differentiates your area from neighboring areas in terms of natural<br />
features, biomes, or human-constructed features? Drawing the borders for your “study<br />
region” within that greater region can be more arbitrary.<br />
Ideally the local “study site” is close enough to the school to allow students to make return<br />
visits for additional observations.<br />
Posting the learning objectives for each lab in a visible place within the room can help<br />
students stay in touch with the key ideas.<br />
If your students are unfamiliar with Image J (Lab 7) get them familiar with it in another<br />
context before using it in the module. One suggestion is have them complete the investigation<br />
Measuring Distance and Area in Satellite Images (http://serc.carleton.edu/eet/measure_sat2/<br />
index.html ) from the <strong>Earth</strong> Exploration Toolbook (Ledley et.al, 2011).<br />
© 2012 National <strong>Earth</strong> Science Teachers Association. All Rights Reserved.
Volume XXVIII, Issue 3<br />
Page 23<br />
n<br />
Book a computer lab in advance; have the software needed installed in advance; and go<br />
through the labs yourself to assure that you have access to all the websites with data, animations,<br />
visualizations, etc. included, and ample bandwidth for all students.<br />
Effectiveness of the <strong>Earth</strong>Labs ESS Module for Student Learning<br />
We examined the effectiveness of the <strong>Earth</strong>Labs ESS module through a number of mechanisms<br />
including student pre- and post-instruction tests, classroom observations, and teacher interviews.<br />
<strong>The</strong> pre- and post- tests showed that students significantly (p
Page 24<br />
<strong>The</strong> <strong>Earth</strong> <strong>Scientist</strong><br />
About the Authors<br />
Dr. Tamara Shapiro Ledley is a senior scientist and chair of the<br />
Center for Science Teaching and Learning at TERC, and is chair<br />
of the Climate Literacy Network. She received her PhD from MIT<br />
in 1983 and conducted a research program in climate change for<br />
15 years before moving into science education. Her efforts focus<br />
on bridging the scientific and educational communities to make<br />
<strong>Earth</strong> science data accessible and usable in educational contexts,<br />
and on improving the climate literacy of teachers, students, and<br />
citizens. Dr. Ledley can be reached at Tamara_Ledley@terc.ed<br />
Mr. Nick Haddad is a Senior Curriculum Developer and Project<br />
Director at TERC. He holds degrees in both engineering and<br />
education and was a classroom teacher for 24 years before<br />
switching his focus to support curriculum and teacher professional<br />
development. His work at TERC is a natural extension of his lifelong<br />
interest in the natural and physical sciences. Nick can be<br />
reached at nick_haddad@terc.edu<br />
Dr. Erin Bardar is a curriculum developer, professional<br />
development specialist, and project director at TERC. She has<br />
a Ph.D. in astronomy, but dedicates much of her time to <strong>Earth</strong>,<br />
environmental, and climate science education. She is always<br />
looking for new ways to bring technology and authentic research<br />
experiences for students into the classroom. Dr. Bardar can be<br />
reached at erin_bardar@terc.edu<br />
IPCC (Ed.). (2007b). Climate Change 2007: Mitigation. Contribution<br />
of Working Group III to the Fourth Assessment Report of<br />
the Intergovernmental Panel on Climate Change. Cambridge,<br />
United Kingdom and New York, NY, USA: Cambridge University<br />
Press, http://www.ipcc.ch/ipccreports/ar4-wg3.htm<br />
IPCC (Ed.). (2007c). Climate Change 2007: <strong>The</strong> Physical Science<br />
Basis. Contribution of Working Group I to the Fourth<br />
Assessment Report of the Intergovernmental Panel on Climate<br />
Change. Cambridge, United Kingdom and New York, NY, USA:<br />
Cambridge University Press, http://www.ipcc.ch/ipccreports/<br />
ar4-wg1.htm<br />
Ledley, T.S, Dalhman, L., McAuliffe, C., Haddad, N., Taber,<br />
M.R., Domenico, B., Lynds, S., Grogan, M. (2011). Making<br />
<strong>Earth</strong> Science Data Accessible and Usable in Education,<br />
Science, 333(6051), 1838-1839, http://www.sciencemag.org/<br />
content/333/6051/1838.summary.<br />
Libarkin, J. C., & Kurdziel, J. P. (2006). Ontology and the Teaching<br />
of <strong>Earth</strong> System Science. Journal of Geoscience Education, 54,<br />
408-413.<br />
Schuster, D. A., Filippelli, G. M., & Thomas, C. W. (2008). Secondary<br />
Students’ Subject Matter Representations of Climate Change.<br />
Journal of Geoscience Education, 56, 307-316.<br />
Singer, S. R., Hilton, M. L., & Schweingruber, H. A. (Eds.). (2005).<br />
America’s Lab Report: Investigations in High School Science:<br />
National Academies Press, http://www.nap.edu/catalog.<br />
php?record_id=11311<br />
Dr. Katherine Ellins is a program manager at the University of<br />
Texas at Austin Institute for Geophysics where she specializes<br />
in geoscience education. She received a PhD from Columbia<br />
University in 1988. <strong>The</strong> focus of her work is to provide<br />
science professional development for K-12 teachers and in the<br />
development of earth science curriculum for grades 8-12. Dr.<br />
Ellins can be reached at kellins@ig.utexas.edu<br />
Dr. Karen McNeal is an Associate Professor in the Department<br />
of Geosciences at Mississippi State University. She spends her<br />
time teaching and conducting research in the biogeochemistry<br />
and geoscience education research fields. Her research in<br />
geoscience education explores questions concerning the human<br />
understanding of complex and dynamic earth system and their<br />
interactions. Dr. McNeal can be reached at ksm163@msstate.edu<br />
Dr. Julie Libarkin is an Associate Professor of Geological Sciences<br />
and Associate Director for Educational Research in the Center for<br />
Integrative Studies at Michigan State University. Her work focuses<br />
on helping teachers and curriculum developers collect data that<br />
can document the impact of their work. Dr. Libarkin can be<br />
reached at libarkin@msu.edu<br />
© 2012 National <strong>Earth</strong> Science Teachers Association. All Rights Reserved.
Volume XXVIII, Issue 3<br />
Page 25<br />
Teaching Controversy<br />
Mark S. McCaffrey<br />
Abstract<br />
What could be wrong with presenting in a science class “both sides” of controversial topics<br />
like evolution or climate change, or having students debate the topics, using argumentation<br />
to improve their critical thinking skills? In the case of evolution, presenting supposed<br />
alternatives, such as intelligent design or young-earth creationism, is not only considered<br />
bad practice, but also unconstitutional in public schools due to the separation of church<br />
and state. However, in the case of climate change, the practice of teaching it as controversial<br />
and presenting “both sides” as if they are equally valid, is a too common practice<br />
among science teachers. This paper examines the reasons why teachers may be encouraged<br />
or drawn to “teach the controversy” about climate change, why it is not an effective practice<br />
and leaves students more confused, and how the Next Generation Science Standards may<br />
help to transform how we teach about climate and global change science and solutions.<br />
Teaching Evolution and Climate Change:<br />
similar but different<br />
Teaching evolution in classrooms has been a bone of contention for years, dating back to the Scopes<br />
trial in Tennessee in 1925, after the Butler Act outlawed the teaching of “any theory that denies the<br />
divine creation of man and teaches instead that man has descended from a lower order of animals.”<br />
<strong>The</strong>re have been numerous court cases since then, and efforts to teach “both sides” of evolution<br />
in public schools have been promoted. In the Kitzmiller v. Dover case, tried in 2005 in a Harrisburg,<br />
Pennsylvania, federal district court, it was found that intelligent design was a form of creationism,<br />
and therefore unconstitutional to teach in American public schools.<br />
In the legal arena, climate change education is substantially different from the teaching of<br />
evolution. It isn’t unconstitutional to teach “both sides” of climate change, and many teachers do<br />
this, although in instances where climate change is explicitly included in school district curriculum,<br />
teachers who don’t teach to the curriculum could be accused of insubordination.<br />
<strong>The</strong>re are some similarities between evolution and climate change in how they are taught or not<br />
taught. Like evolution, climate change often isn’t taught at all or isn’t taught well. By and large,<br />
climate change has been missing from science education for many decades, in part because it is<br />
© 2012 National <strong>Earth</strong> Science Teachers Association. All Rights Reserved.
Page 26<br />
<strong>The</strong> <strong>Earth</strong> <strong>Scientist</strong><br />
complex and doesn’t fit neatly into traditional science education disciplines, in part because the<br />
science has been politicized and framed as uncertain and controversial.<br />
Unsurprisingly, then, a study (Leiserowitz 2011) entitled “American Teens’ Knowledge of Climate<br />
Change” conducted by the Yale Project on Climate Change Communication found that most adults<br />
and teens get a D or an F in terms of their basic climate and energy literacy. Fewer than 1 in 5 said<br />
they are “very well informed” about how the climate system works, or the different causes of, consequences<br />
from, or potential solutions for global warming, and only 27 percent said that in school<br />
they have learned “a lot” about global warming.<br />
Importantly, in the study, 70 percent of teens said that they would like to know more about global<br />
warming. But they may be disappointed. For today, when climate change is taught at all, it is often<br />
not well taught, due to the lack of background in the subject content and pedagogical experience of<br />
the educator and/or the lack of inclusion of the topic in the curriculum and science standards.<br />
Challenges and Opportunities:<br />
teach current science, not a phony debate<br />
<strong>The</strong>re are certainly substantial challenges to teaching climate change. <strong>The</strong> science itself is complex,<br />
crossing many scientific disciplines, particularly when the human societal dimension is included. For<br />
students, the science can be particularly challenging and non-intuitive. Even well-prepared teachers<br />
may struggle to help students overcome naïve ideas or misconceptions about climate dynamics.<br />
Also, the topic has historically not been adequately or systematically addressed in most science<br />
standards. Even in college textbooks about environmental science, the subject of climate change<br />
may be only part of a chapter out of the entire book. In the classroom the topic might be covered<br />
in just one day out of an entire semester or skipped altogether. When the human dimension is<br />
added to the equation, the psychological and sociological aspects of climate change add to the<br />
complexity of teaching about climate change science and solutions. Clearly, in some communities<br />
and schools, one of the biggest obstacles to teaching climate change, for many teachers is that the<br />
topic has become extremely polarized politically, particularly in recent years. Largely because of this<br />
political polarization, a substantial number 1 of teachers who do cover the topic are opting to teach<br />
“both sides” of climate science. Most commonly this takes the form of presenting the “theory” that<br />
climate change is caused by human activities, and then attempting to balance it by presenting the<br />
counter-“theory” that climate change is simply due to natural cycles.<br />
<strong>The</strong> reasons that teachers may employ the “both sides” approach vary. In some cases, they have<br />
experienced overt external pressure from other teachers, administrators, parents, or even students.<br />
In other instances, educators may opt to present “both sides” of climate change to students because<br />
they aren’t confident or comfortable with the content, haven’t mastered the pedagogy, or because of<br />
their own opinions or worldviews.<br />
In some cases, teachers are swayed by deliberate efforts that promote “teaching the controversy”,<br />
but this teaching only fosters confusion and denial of climate change. This approach is similar to<br />
the efforts to have evolution taught side-by-side with supposed alternative theories, like creation<br />
science, or more recently, intelligent design. Unlike efforts to “teach the controversy” of evolution,<br />
1 Over a third—36%—of K–12 educators responding to a 2011 NESTA survey reported that they<br />
“have been influenced in some way (directly or indirectly) to teach ‘both sides’ of climate change.”<br />
Although only 5% reported that they were required to teach “both sides” of climate change,<br />
47% reported that they taught “both sides” because they thought that “there is validity to both<br />
sides.” NESTA’s survey was informally conducted on-line, however, and cannot be considered<br />
scientifically rigorous. See: http://www.nestanet.org/cms/sites/default/files/documents/<br />
ExecutiveSummaryClimateChangeEducationSurveyDecember2011.pdf<br />
© 2012 National <strong>Earth</strong> Science Teachers Association. All Rights Reserved.
Volume XXVIII, Issue 3<br />
Page 27<br />
which is driven primarily by religious ideology, efforts to “teach the<br />
controversy” in climate change education are primarily motivated by<br />
political and economic ideological perspectives.<br />
In both cases, those promoting “teaching the controversy” claim that<br />
it will foster student’s critical thinking skills, ultimately teaching<br />
“more science not less.” In both instances, the claim is made that<br />
the science is bad (“Climate change is a hoax!”), the societal implications<br />
of the science are bad (“Fixing the climate will destroy free<br />
market capitalism!”), and proponents insist that it is only balanced<br />
and fair to grant equal time to present “both sides” of “the debate” to<br />
let students decide for themselves. But students need to master the<br />
content before they can engage in meaningful argumentation.<br />
To many Americans, “teaching the controversy” appeals to an ideal<br />
of fairness and balance. But when it comes to evolution, gravity, the<br />
laws of thermodynamics and, yes, climate change, there is no “other<br />
side” for students to learn about in a science class. Simply put,<br />
climate change is happening, and humans, having become a force<br />
of nature through our sheer numbers and technological impact, are<br />
responsible.<br />
<strong>The</strong> bottom line is that while climate change certainly is a social and<br />
political controversy, it is not a scientific controversy. This is not to<br />
say there aren’t a few scientific unknowns, in some cases substantial<br />
ones, regarding the details of how climate and the global environment<br />
will change and over what time scales. Should we be preparing<br />
for three feet or six feet of sea level rise along our coasts? Will wildfires along<br />
the Colorado Front Range increase 300% or 600% as temperatures increase?<br />
Within the community of climate and global change experts, there<br />
are areas of scientific disagreement such as these. But the biggest<br />
wild card is how humans are going to respond to the evidence<br />
presented by the scientific community.<br />
<strong>The</strong> concept of human activities leading to climate<br />
change—specifically, the burning of fossil fuels,<br />
the warming of the atmosphere, and the resulting<br />
melting of the ice sheets, the rise of sea level, and<br />
the alteration of ecosystems—is not new to science<br />
education. Over fifty years ago, science education<br />
materials—including the booklet Planet <strong>Earth</strong>:<br />
<strong>The</strong> Mystery with 100,000 Clues, published by the<br />
National Academy of Sciences (1958), and related<br />
television programs and educational films—featured<br />
such information. Since then, however, with few<br />
exceptions the topic has largely been missing from<br />
K–12 science education.<br />
What science educators ought to recognize is that for climate science, as for science in general,<br />
students need to master the content before they can engage in meaningful argumentation. True,<br />
argumentation can be a powerful way to engage students in learning science and debating the societal<br />
relevance of science and technology. But having students engage in a “phony” debate about<br />
whether climate change is happening, and whether humans are responsible, is counterproductive.<br />
Research has shown, and experience confirms, that teaching “both sides” of climate change is not<br />
sound, and can lead to more student confusion, not less.<br />
For your classroom, here are a few tips on how best to address the controversy and denial of climate<br />
change. <strong>The</strong> tips are from the National Center for Science Education (http://ncse.com/climate/<br />
teaching/addressing-doubt-denial), which has been defending the teaching of evolution in public<br />
schools for many years and recently launched a new climate change education initiative:<br />
Science teachers have a responsibility to help their students understand, to the extent appropriate,<br />
the central methods and results of contemporary science. <strong>The</strong>re is substantial scientific<br />
agreement around climate change: 97% of scientists who have published peer-reviewed scientific<br />
articles on climate change agree that humans have caused most of the increase in global<br />
temperature over the last 150 years … Science teachers thus have a responsibility to help their<br />
© 2012 National <strong>Earth</strong> Science Teachers Association. All Rights Reserved.
Page 28<br />
<strong>The</strong> <strong>Earth</strong> <strong>Scientist</strong><br />
students understand climate change, the evidence for climate change, and the fact that the<br />
scientific community agrees that the evidence is convincing.<br />
Science teachers should therefore:<br />
n<br />
n<br />
n<br />
be prepared, by understanding the content of climate science, using the most effective<br />
pedagogical methods for conveying it, and understanding the claims of climate change<br />
deniers<br />
be ready to cite the consensus of the scientific community on the reality of climate<br />
change and the consensus of the science education community on the importance of<br />
climate change education<br />
be respectful of student concerns (which are likely to reflect those of their parents or<br />
other trusted adults), while not engaging them in fruitless debate<br />
By the same token, science teachers should:<br />
n<br />
n<br />
n<br />
not misrepresent the scientific consensus by suggesting that climate change is a matter<br />
of scientific controversy or by presenting “the other side” as though it were scientifically<br />
credible<br />
not conduct “phony” debates in class about whether climate change is happening (as<br />
opposed to issues about which there is a genuine scientific debate or policy issues that<br />
aren’t able to be decided by the science alone)<br />
not use supplementary materials (such as DVDs produced by climate change deniers)<br />
or invite guest speakers who may misrepresent climate science<br />
Integrating Science and Solutions<br />
One of the biggest complaints about climate change education efforts is that they alarm students,<br />
make them feel guilty, and convey a sense of gloom and doom. <strong>The</strong>re’s some truth to this. Climate<br />
change has an undeniable psychological and emotional dimension that must be acknowledged in<br />
order to effectively communicate or teach this challenging topic.<br />
An emerging “best practice” that requires skill and creativity by the practitioner is for the teacher<br />
to weave a wide range of technological, engineering, behavioral and societal solutions into the mix.<br />
Students thus learn about possible ways to mitigate or adapt to climate change, at the same time<br />
and in the same educational context that they are learning about climate change. For example,<br />
when focusing on how the Sun is the primary source of energy for the <strong>Earth</strong>’s climate system,<br />
teachers could augment their lessons on the <strong>Earth</strong>’s energy budget with discussions of the effective<br />
solar design of buildings.This is not always easy since it requires true balance and critical thinking<br />
to avoid advocacy for a particular policy or technological solution. But it is the science teacher’s<br />
responsibility to be an advocate for helping the learners become literate with the current science,<br />
ideally integrating climate and energy topics throughout the curriculum.<br />
Next Steps<br />
In science classrooms, we don’t debate “both sides” of astrology or alchemy or whether the <strong>Earth</strong><br />
is flat. Our duty as educators is to convey the complex, often challenging, and sometimes counterintuitive<br />
consensus of current scientific research so that students can master the content and gain<br />
proficiency to help them to become more scientifically literate individuals, as well as better informed<br />
and better prepared citizens.<br />
© 2012 National <strong>Earth</strong> Science Teachers Association. All Rights Reserved.
Volume XXVIII, Issue 3<br />
Page 29<br />
<strong>The</strong> proposed Next Generation Science Standards, which 26 states have been<br />
involved in drafting, include 30 standards from kindergarten to 12th grade that<br />
relate to understanding the basics of climate and energy concepts. <strong>The</strong>se standards<br />
will help learners to examine the impact of human activities on climate and<br />
<strong>Earth</strong>’s ecosystems, and engage them to develop technological, engineering and<br />
societal solutions in order to minimize human impacts on the <strong>Earth</strong> system, and<br />
become more resilient as individuals and communities when required to deal with<br />
local and global changes. <strong>The</strong> potential is enormous for these proposed science<br />
standards to help improve how climate and global change are taught and advance<br />
civic science literacy. But achieving this potential will require commitment,<br />
creativity, the development and deployment of new curriculum, and professional<br />
development programs that can prepare educators to effectively convey<br />
21st-century science to learners. No small task, but crucial to preparing society for<br />
changes that are already well underway.<br />
References<br />
Leiserowitz, A., Smith, N. & Marlon, J.R. (2011).American Teens’ Knowledge of<br />
Climate Change. Yale University. New Haven, CT: Yale Project on Climate Change<br />
Communication, p. 5.<br />
http://environment.yale.edu/climate/files/American-Teens-Knowledge-of-Climate-<br />
Change.pdf<br />
About the Author<br />
Mark McCaffrey is the Programs and Policy<br />
Director of the National Center for Science<br />
Education’s climate change education initiative.<br />
Before coming to NCSE, he helped spearhead<br />
the development of the Climate Literacy and<br />
Energy Literacy frameworks, available through<br />
the U.S. Global Change Research Program<br />
(http://globalchange.gov/resources/educators),<br />
presented and taught about climate, energy,<br />
water and environmental science at many<br />
grade levels, and was a Principal Investigator<br />
of the Climate Literacy and Energy Awareness<br />
Network (http://cleanet.org). He has a Masters<br />
in Education from the University of Northern<br />
Colorado, where he focused his studies on<br />
water as an interdisciplinary and integrating<br />
theme in education. Mark can be reached at<br />
mccaffrey@ncse.com<br />
Are you looking for some quality<br />
mineral or fossil specimens<br />
for your classes? Or maybe for you?<br />
Check out the assortment of<br />
minerals and fossil specimens<br />
available on our Online Store<br />
from Nature’s Own!<br />
Classroom specimens and collections,<br />
jewelry, and household items available!<br />
Visit our online store at<br />
www.windows2universe.org/store,<br />
and click on “Nature’s Own”<br />
Windows to the Universe members get a 10% discount!<br />
© 2012 National <strong>Earth</strong> Science Teachers Association. All Rights Reserved.
Page 30<br />
<strong>The</strong> <strong>Earth</strong> <strong>Scientist</strong><br />
Lesson Plans and Classroom<br />
Activities from the Climate Literacy<br />
Ambassadors Community<br />
Margaret E. Mooney, Steve Ackerman, Galen A. McKinley,<br />
Tom Whittaker and Tommy Jasmin<br />
Background<br />
In 2007, the Intergovernmental Panel on Climate Change (IPCC) published its fourth assessment of<br />
<strong>Earth</strong>’s Climate. Stating clearly that “warming is unequivocal” and documenting observed warming,<br />
the IPCC laid the foundation for actions to address the impacts of climate change but left a chasm<br />
between evidence presented in the report and the public’s ability to make meaningful responses or<br />
even comprehend climate mechanisms. To bridge this gap, educators at the University of Wisconsin-<br />
Madison (UW) developed an on-line resource for educators clarifying graphs and tables presented<br />
in the IPCC Summary for Policy Makers. <strong>The</strong> Global and Regional Climate Change course debuted in<br />
2008 (http://cimss.ssec.wisc.edu/climatechange/). Teachers from Wisconsin and California worked<br />
through the content and provided feedback via embedded questionnaires and telephone interviews.<br />
Revisions followed and in 2010, with support from NASA award number NNX10AB52A, the UW<br />
began offering Global and Regional Climate Change as a professional development opportunity for<br />
middle and high school science teachers as part of a Climate Literacy Ambassadors project, the idea<br />
being that teachers would take the course and then promote climate awareness in their schools and<br />
communities. Since then, dozens of teachers have designed and submitted grade-specific lesson<br />
plans that support teaching and learning around climate change. This article highlights a few of the<br />
more robust lesson plans available for download, including a district-wide community action plan<br />
and numerous shorter activities suitable for classroom instruction.<br />
<strong>The</strong> UW Global and Regional Climate Change course and<br />
activities for the classroom<br />
<strong>The</strong>re are 16 lessons grouped into five units in the UW Global and Regional Climate Change course.<br />
<strong>The</strong> content in each of the 16 lessons is freely available on-line, and each lesson includes several<br />
learning activities that reinforce the main concepts presented. Most of these activities are perfect for<br />
classroom instruction. While there is the option to take the entire course and print out a certificate<br />
of completion, users are free to skip the log-in option and go directly to course content. To get to<br />
your favorite activity or lesson plan, simply use the navigation bar along the top of the home page.<br />
A list of 48 activities can be found under the “Resources” tab. While several of the activities are from<br />
NASA or NOAA, most, such as the Carbon Projections Applet to explore future carbon emission<br />
scenarios and the Milankovitch Cycles Applet to explore past climates, were developed at the UW.<br />
© 2012 National <strong>Earth</strong> Science Teachers Association. All Rights Reserved.
Volume XXVIII, Issue 3<br />
Page 31<br />
Lesson Plans<br />
<strong>The</strong>re are two lesson<br />
plans and one worksheet<br />
to guide learning<br />
with the Carbon<br />
Projections applet<br />
and one lesson plan<br />
associated with the<br />
Milankovitch Cycles<br />
applet. <strong>The</strong>se were<br />
developed by teachers,<br />
tested in classroom<br />
settings and iteratively<br />
refined. <strong>The</strong>y can<br />
be found under the<br />
“Lesson Plans” tab in the navigation bar. Materials required are computers and Internet access.<br />
(http://cimss.ssec.wisc.edu/climatechange/nav/lessonplans/).<br />
Figure 1. Carbon Projections<br />
Applet<br />
Source: Tommy Jasmin<br />
<strong>The</strong> Carbon Projection Applet is an interactive computer exercise where students can model future<br />
projections of CO 2 sources and sinks and associated temperatures based on climate models used in<br />
the IPCC report. <strong>The</strong> graphs and graphics provide a visually appealing and powerful illustration of<br />
how choices can make a difference in future climate scenarios. <strong>The</strong> applet, like real life scenarios, is<br />
somewhat involved, so the screen shots and sequences laid out in the Carbon Projection Applet<br />
Worksheet provide an excellent guide for teachers and students to familiarize themselves with this<br />
learning tool. For teachers who have more than one class period to devote to this topic, there is also<br />
a Global Dilemma Scenario lesson plan where middle school students make choices about energy<br />
generation options, and a Stabilization Wedges lesson plan to engage high school students around<br />
strategies to reduce carbon levels from worldwide annual emmision totals.<br />
<strong>The</strong> Milankovitch Cycles Applet lesson<br />
plan was developed for high school<br />
students to complete in one class period.<br />
If you’re familiar with the Milankovitch<br />
<strong>The</strong>ory, you’ll remember that it involves<br />
cyclical variations in three elements of<br />
<strong>Earth</strong>-Sun geometry. Traditionally hard<br />
to teach, this applet enables teachers<br />
and students to visualize these elements<br />
and compare different configurations to<br />
temperatures derived from the Vostok ice<br />
core. This is another powerful teaching<br />
tool made easier by the lesson plan freely<br />
available for download.<br />
Figure 2. Milankovitch Cycle<br />
Applet<br />
Source: Tom Whittaker<br />
Another set of popular lesson plans on the website evolved from an activity on probability and<br />
uncertainty. Several teachers have adapted and used the Simple Statistics Exercise on Uncertainty<br />
lesson plan to have students analyze a historical climate dataset of seasonal ice cover qualitatively<br />
and quantitatively. Instructions complete with screen shots are available for Excel 2003, Excel 2007<br />
and Mac 2011. <strong>The</strong>re is even a simplified version of this activity at the middle school level requiring<br />
students to plot data and make graphs, rather than use Excel.<br />
© 2012 National <strong>Earth</strong> Science Teachers Association. All Rights Reserved.
Page 32<br />
<strong>The</strong> <strong>Earth</strong> <strong>Scientist</strong><br />
About the Authors<br />
Margaret Mooney is a former National<br />
Weather Service meteorologist who<br />
leverages early career experience with<br />
a more recent degree in public policy to<br />
promote weather and climate education<br />
as avenues towards stewardship and<br />
sustainability. Margaret can be reached<br />
at margaret.mooney@ssec.wisc.edu<br />
Steve Ackerman is a professor in<br />
Atmospheric and Oceanic Sciences and<br />
the Director of the Cooperative Institute<br />
for Meteorological Satellite Studies at<br />
the University of Wisconsin-Madison.<br />
His teaching often highlights the use of<br />
technology to convey information and<br />
address misconceptions. Dr. Ackerman<br />
can be reached at steve.ackerman@<br />
ssec.wisc.edu<br />
Galen McKinley is an Associate Professor<br />
in the Department of Atmospheric and<br />
Oceanic Sciences at the University of<br />
Wisconsin-Madison. Dr. McKinley’s<br />
research involves carbon cycling<br />
in the global oceans and the Great<br />
Lakes. Dr. McKinley can be reached at<br />
gamckinley@wisc.edu<br />
Tom Whittaker has been writing software<br />
related to the atmospheric sciences since<br />
the 1960s. While his degrees are in<br />
meteorology, he focuses on visualization,<br />
analysis, and understanding of earth<br />
science data and information. He is the<br />
author of many of the interactive applets<br />
found at: http://profhorn.aos.wisc.edu/<br />
wxwise Tom can be reached at tom.<br />
whitakker@ssec.wisc.edu<br />
Tommy Jasmin is a Systems Developer<br />
at the University of Wisconsin Space<br />
Science and Engineering Center (SSEC),<br />
in Madison. At SSEC, Tommy works<br />
primarily with scientific data processing<br />
systems and visualization tools. Tommy<br />
can be reached at tommy.jasmin@ssec.<br />
wisc.edu<br />
A District-wide Community Action Plan<br />
For Educators that have longer than a week and seek broader community engagement,<br />
there are two, district-wide action plans available for download. <strong>The</strong> 10-10-10<br />
plan breaks activities down into elementary, middle and high school level with gradeappropriate<br />
opportunities and incentives for students to investigate the size of their<br />
individual and household carbon footprint and identify actions to reduce carbon<br />
pollution. <strong>The</strong> 2011 Moving Planet plan encourages students to reduce fossil fueled<br />
trips. Both were coordinated with 350.org, an international organization working to<br />
raise awareness of human-induced climate change.<br />
Summary<br />
<strong>The</strong>re are over three dozen climate-related lesson plans created by science teachers<br />
freely available for download from the UW Global and Regional Climate Change<br />
course. And the list is growing! An internal survey conducted in the fall of 2011<br />
revealed that 28% of teachers in the Climate Literacy Ambassadors Community tend<br />
to only use the lesson plan they created while 45% have also used other teachers’ lesson<br />
plans. We’re confident that there is a lesson plan available that will help improve your<br />
students’ understanding of climate change.<br />
Bibliography<br />
UW-Madison Global and Regional Climate Change Course (http://cimss.ssec.wisc.edu/climatechange/)<br />
CIMSS Education and Outreach (http://cimss.ssec.wisc.edu/education/<br />
UW-Madison Carbon and Climate Website (http://carboncycle.aos.wisc.edu/)<br />
350.org (http://350.org/)<br />
Welcomes K-12 Teachers with<br />
programs tailored to your needs!<br />
• Geophysical Information for Teachers<br />
Workshops<br />
• Bright Stars<br />
• AGU Speaker at National NSTA<br />
Conference<br />
• AGU Membership includes weekly<br />
EOS magazine, with science updates<br />
and opportunities<br />
www.agu.org/education<br />
© 2012 National <strong>Earth</strong> Science Teachers Association. All Rights Reserved.
Volume XXVIII, Issue 3<br />
Page 33<br />
Predicting the Impacts of<br />
Climate Change on Ecosystems:<br />
A High School<br />
Curricular Module<br />
Vanessa L. Peters,<br />
Tanya A. Dewey, Andrew Kwok,<br />
George Starr Hammond and Nancy Butler Songer<br />
Abstract<br />
<strong>The</strong>re is growing consensus among educators about the importance of teaching students<br />
the necessary science skills to address some of today’s most pressing environmental<br />
concerns. <strong>The</strong> Center for Essential Science (CES) at the University of Michigan (www.<br />
essentialscience.umich.edu) has developed an eight to twelve-week climate change curriculum<br />
for teaching middle and high school students about the ecological impacts of global<br />
climate change. In this article, we describe a four-day module from that curriculum. We<br />
begin by discussing the science behind the module, including the data and technologies<br />
that climate scientists use for studying the impacts of climate change on local ecosystems.<br />
We then describe how the module guides students in predicting the effects of climate<br />
change on species distribution. Finally, we conclude with tips for classroom implementation<br />
and information on how teachers can gain immediate access to our activities and<br />
resources.<br />
Predicted Distribution Modeling and Climate Change<br />
Predicted Distribution Modeling (PDM, also known as Ecological/Environmental Niche Modeling,<br />
Predictive Habitat Distribution Modeling or Climate Envelope Modeling) is a method used widely<br />
in ecology and conservation biology. This approach uses environmental data, primarily climate<br />
variables, combined with species occurrence data, to produce a model that explains how climate<br />
variables influence where a species is found across landscapes. <strong>Scientist</strong>s use PDM to predict where<br />
a species occurs under current environmental conditions (i.e., predict where else the species may<br />
be found, based on a limited set of observed occurrences) and where a species might occur if environmental<br />
factors changed, such as under future climate change scenarios. This makes PDM a<br />
powerful tool for exploring how climate change may influence ecosystems as species respond individually<br />
to changes in environmental factors (Beach et al., 2002).<br />
Predictions of future species distributions are based on sophisticated climate change models<br />
defined by the Intergovernmental Panel on Climate Change (IPCC). Because these climate change<br />
models and the graphs used to represent them are complex (see Figure 1), we created simplified<br />
versions of these scenarios. In this simplification process, we used a brief narrative to explain that<br />
IPCC scenarios are based primarily on three socioeconomic factors: global population size, energy<br />
© 2012 National <strong>Earth</strong> Science Teachers Association. All Rights Reserved.
Page 34<br />
<strong>The</strong> <strong>Earth</strong> <strong>Scientist</strong><br />
consumption practices, and the proportion of energy use<br />
from clean sources (IPCC, 2007). A subset of the scenarios,<br />
A2, A1B and B1, were renamed as Future 1, Future 2 and<br />
Future 3 and summarized in a comparison table (Figure 2).<br />
Having this resource available to students allows them to<br />
make connections between human impacts on the global<br />
carbon budget, resultant climate change and its impact on<br />
ecosystems.<br />
Figure 1 (top). Surface warming<br />
temperatures for IPCC future<br />
climate scenarios, shown as<br />
continuations from 20th century<br />
temperature simulations<br />
Image source: IPCC, 2007<br />
Figure 2 (bottom). Simplified<br />
comparison table of three<br />
IPCC future climate scenarios.<br />
<strong>The</strong> possible futures illustrate<br />
how global population size,<br />
consumption practices, and the<br />
proportion of clean energy use<br />
impacts future carbon emissions.<br />
Source: the Authors.<br />
Predicting the Impacts of Climate<br />
Change on Ecosystems: A High School<br />
Curriculum Module<br />
Predicting the Impacts of Climate Change on Ecosystems<br />
is a selected module from the semester-long climate change<br />
curriculum that has been developed for high school<br />
students. All activities in the curriculum were developed in<br />
close collaboration with scientists to ensure that students<br />
are learning accurate, peer-reviewed science content.<br />
All content in the curricular activities aligns with the Framework for the K-12 Next Generation<br />
Science Standards. Both the module and full curriculum are delivered through SPECIES (Students<br />
Predicting the Effects of Climate In EcoSystems), a password-protected, online learning environment<br />
where students use a variety of digital media to learn about climate change and the impacts of<br />
climate change on ecosystems. Below, we describe the activities in a module where students explore<br />
the scientific question: “Will climate change impact the distribution of a species?”<br />
Activity 1: Students begin the module with a reading about how environmental factors influence<br />
where species are found (i.e., its distribution). This is an important content foundation; students<br />
should understand that: (a) species are found in places where the environmental conditions are<br />
appropriate for them, (b) that different species have different environmental needs, and (c) there are<br />
many kinds of factors (abiotic and biotic) that influence where a species is found.<br />
Students then use the “focal species chooser” to select a species on which to focus when making<br />
predictions about the impact of the climate change scenarios on a species’ distribution. <strong>The</strong> focal<br />
species chooser uses content from the Critter Catalog (www.biokids.umich.edu), an online animal<br />
encyclopedia that provides students with natural history information about their chosen species,<br />
including habitat, social behavior, diet and ecosystem roles. Students use this resource to understand<br />
the biology of their focal species and the conditions that influence where it can live. This<br />
background information allows students to make predictions about the impact of ecosystem<br />
changes on the distribution of their focal species under future climate change scenarios.<br />
Next, students overlay maps of environmental conditions (temperature and precipitation, both of<br />
which are aspects of climate) and a map of their focal species distribution to understand how those<br />
environmental conditions influence the distribution. Students are asked to focus their attention on<br />
the areas of the map where their focal species occurs. <strong>The</strong> area where the distribution and temperature/precipitation<br />
overlap indicates the range of temperature/precipitation that occurs where<br />
their focal species is found (Figure 3). This information provides a foundation for students’ understanding<br />
of how climate change will influence the future distributions of their focal species.<br />
Activities 2 and 3: Students begin activity 2 with a background reading on possible future climates<br />
predicted under three human energy use and population scenarios, using the Futures 1, 2, and 3<br />
© 2012 National <strong>Earth</strong> Science Teachers Association. All Rights Reserved.
Volume XXVIII, Issue 3<br />
Page 35<br />
comparison table in Figure 2.<br />
Students learn that the impact of<br />
human-induced climate change<br />
depends largely on greenhouse<br />
gas emissions and that greenhouse<br />
gas emissions are strongly<br />
influenced by socioeconomic<br />
factors. In Activity 3, students<br />
are led through an example of<br />
PDM using simplified grids that<br />
represent map cells. Observations<br />
of species are overlaid with information<br />
on precipitation and temperature. Students combine this information to develop their own<br />
predicted distribution on a simple grid. This exercise helps students understand the process behind<br />
the more complex, algorithm-driven modeling they will work with in the final module activity.<br />
Activity 4: In the culminating activity, students use the PDM tools in SPECIES to make and justify<br />
predictions about how climate change will influence their focal species and its prey. Students begin<br />
the activity by comparing the current distribution of their focal species with its predicted distribution<br />
under the three future climate scenarios (left panel in Figure 4). <strong>The</strong>y examine predicted<br />
changes in their focal species distribution under two scenarios, while also examining the human<br />
population and energy uses that define those scenarios. Students are then asked to describe the<br />
human population and energy uses under a third scenario based on how the distribution of their<br />
focal species changes. By examining a prey distribution, students can explore how changes in<br />
ecological interactions will impact their species. Students also use the PDM tool to overlay current<br />
Figure 3. Map resource showing<br />
the current distribution of Elliot’s<br />
short-tailed shrew (hatched area<br />
in center of map) overlaid with<br />
average annual precipitation (left)<br />
and average annual temperature<br />
(right).<br />
Source: the Authors.<br />
distribution maps of their focal species and a prey species to see how their distributions overlap under<br />
the predicted climate futures (center and right panels in Figure 4). By comparing the models and their<br />
data, students can make a justified prediction about the impact of a single prey species or multiple<br />
prey species under different climatic conditions. Collectively, these observations reinforce the important<br />
understanding: that not all species will respond to climate change in the same way, that ecological<br />
interactions among species are likely to change, and that changing ecological interactions will influence<br />
whether species can survive the multiple stresses of climate change in the future.<br />
Students conclude the module by synthesizing the information gathered throughout the activities<br />
to explain how biological communities may respond to climate change. A valuable addition to this<br />
module is to follow up with a classroom discussion in which students or student groups present<br />
their predictions for their focal species. This provides a collaborative opportunity for students to<br />
compare results and discuss the varying responses of species and their ecological interactions to<br />
climate change.<br />
Figure 4. Map resource showing<br />
current and predicted future<br />
distributions of a focal species<br />
(left), current distributions of a<br />
focal species overlaid with a prey<br />
species (center), and predicted<br />
future distributions of both a<br />
focal species and prey species<br />
(right).<br />
Source: the Authors.<br />
© 2012 National <strong>Earth</strong> Science Teachers Association. All Rights Reserved.
Page 36<br />
<strong>The</strong> <strong>Earth</strong> <strong>Scientist</strong><br />
Teacher Tips<br />
For practitioners, each curricular module provides ‘Teacher Notes’ prior to each lesson that include<br />
supplemental information for difficult concepts, links to supporting resources, and suggestions<br />
for extending the activities using different learning modalities. Lessons are typically designed for<br />
50-minute class periods; however, they consist of smaller sub-sections that are flexible for varying<br />
amounts of instructional time. Because students’ information is saved on the web, students can<br />
resume progress where they left off the day before.<br />
All modules in the curriculum are designed for teachers who are unfamiliar with climate change<br />
or predicted distribution modeling. To improve accessibility, all curricular data and resources are<br />
presented in a user-friendly web environment that includes various media such as animations,<br />
videos and web articles. Hands-on activities include greenhouse gas and albedo labs, where students<br />
use infrared thermometers to measure temperature across surfaces. In addition, the curriculum<br />
includes student-accessible resources relevant to climate change, such as pollen and ice core data,<br />
so that students can use these as evidence when constructing scientific explanations. For instance,<br />
our simplified IPCC scenarios eliminate the guesswork of deciphering what the scenarios present,<br />
so teachers and students can focus their attention on conceptual learning and prediction making.<br />
Finally, the curriculum includes both embedded assessments and pre/post-tests that focus on<br />
core science content fused with explanations, predictions, and data analysis as emphasized in the<br />
upcoming Next Generation Science Standards.<br />
Demonstrated Success with Impacts of Climate Change<br />
Curriculum Unit<br />
A research study of the full curriculum conducted in spring 2012 realized strong learning in two<br />
areas. First, there was a high degree of student engagement across both middle and high school<br />
audiences. Second, many students created high quality research papers about the impacts of climate<br />
change on ecosystems. In addition, teachers noted the emphasis the lessons placed on guiding<br />
students to create evidence-based predictions and explanations about climate change impacts.<br />
Teachers also found they could adapt the lessons by either expanding discussions when the class<br />
period was longer, or omitting information that was already covered when class time was more<br />
limited. Initial pre/post-test data indicate students understand that climate is changing rapidly due<br />
to anthropogenic causes. Students comprehended the consequences of a warming global temperature<br />
and its potential impacts on species distribution and ecosystems. On balance, while many<br />
positives were observed, many students continued to struggle with the complexity of factors that<br />
contribute to global climate change.<br />
Using Predictions About the Impacts of Climate Scenarios on<br />
Ecosystems<br />
We invite all interested teachers to visit our web site to learn more about our program. While access<br />
to the full-featured curriculum requires teacher registration, the module described in this article is<br />
freely available at the following link: http://tinyurl.com/7fm2g5r. <strong>The</strong> Center for Essential Science<br />
is pleased to offer full or partial support to teachers wishing to implement our curricular activities<br />
in their classrooms. If interested, please contact Vanessa Peters at essentialscience@umich.edu<br />
References<br />
Beach, J.A., Stewart, A.M., Voronstov, Y.G., Scachetti Pereira, R., Stockwell, D.R.B., Vieglais, D.A., &Downie,<br />
S. R. (2002). <strong>The</strong> future of biodiversity: Mapping and predicting the distribution of life with distributed<br />
computation. Proceedings of the ESRI User Conference. Retrieved from http://proceedings.esri.com/library/<br />
userconf/proc02/pap0769/p0769.htm<br />
© 2012 National <strong>Earth</strong> Science Teachers Association. All Rights Reserved.
Volume XXVIII, Issue 3<br />
Page 37<br />
References (cont.)<br />
BioKids (2012).BioKIDS: Kids’ Inquiry<br />
of Diverse Species. Retrieved from<br />
http://www.biokids.umich.edu/<br />
critters/<br />
Intergovernmental Panel on Climate<br />
Change. (2007). Summary for<br />
Policymakers. In S. Solomon, D.<br />
Qin, M. Manning, Z. Chen, M.<br />
Marquis, K.B. Averyt, M. Tignor,<br />
& H.L. Miller (Eds.), Climate<br />
Change 2007: <strong>The</strong> Physical Science<br />
Basis. Contribution of Working<br />
Group I to the Fourth Assessment<br />
Report of the Intergovernmental<br />
Panel on Climate Change.<br />
Cambridge, UK: Cambridge<br />
University Press.<br />
University of Kansas Biodiversity<br />
Institute (2011).Lifemapper<br />
[Software]. Available from http://<br />
www.lifemapper.org<br />
About the Authors<br />
Vanessa Peters is a postdoctoral research fellow at the School of Education at the University of<br />
Michigan, where she works on the Change Thinking Climate Change Education project. Her research<br />
focuses on the use of technology for promoting a deep understanding of interdisciplinary science.<br />
Vanessa has an M.A. in Educational Technologies and a Ph.D. in Curriculum Studies from the<br />
University of Toronto. Dr. Peters can be reached at vlpeters@umich.edu<br />
Tanya Dewey is a biologist interested in expanding opportunities for authentic science experiences<br />
in K-20 classroom settings. She acts as a science content consultant for the Climate Change Biology<br />
Team and is excited about helping students explore their inner scientist. Dr. Dewey can be reached at<br />
tdewey@umich.edu<br />
Andrew Kwok is a doctoral student at the University of Michigan at Ann Arbor focusing on Teaching<br />
and Teacher Education. Previously, he taught high school science in Oakland, CA, which helped<br />
to shape his current interests of urban secondary teacher preparation, particularly in classroom<br />
management. He has a B.S. in Brain, Behavior, and Cognitive Science from <strong>The</strong> University of Michigan.<br />
Andrew can be reached at kwok@umich.edu<br />
George Starr Hammond is an editor and content specialist for the Animal Diversity Web, a project<br />
based at the Museum of Zoology of the University of Michigan. He has a Masters Degree in Biology<br />
from the University of Michigan. George can be reached at gstarrh@umich.edu<br />
Nancy Butler Songeris a faculty member in the School of Education at the University of Michigan,<br />
where she has been designing and studying science learning environments that utilize emerging<br />
technology for many years. Nancy has a Ph.D. in Science Education from the University of California,<br />
Berkeley, an M.S. in Molecular/ Developmental Biology from Tufts University, and a B.S. in Biological<br />
Sciences from the University of California, Davis. Dr. Songeris can be reached at songer@umich.edu<br />
Membership Information<br />
RENEW OR UPDATE YOUR<br />
MEMBERSHIP INFORMATION<br />
Electronic renewal notices are now<br />
automatically e-mailed to each member.<br />
<strong>The</strong>y will be sent at 4, 2, and 1-week intervals<br />
before your membership expires. If<br />
you have not received a renewal notice<br />
please contact membership@nestanet.<br />
org. NESTA members can renew their<br />
membership and edit their Personal<br />
Information by going online.<br />
• Go to NESTA Home Page<br />
• Click on Member Login<br />
• Welcome to your User Account<br />
Complete Username and<br />
Password. If you do not know your<br />
password, click on the “Request<br />
new password” tab<br />
• MY NESTA – Here you will find<br />
your: Account settings and personal<br />
information (under Edit you can<br />
change your password)<br />
• Membeship Expiration Date<br />
• Renew Now<br />
If you do not wish to use a credit<br />
card, you can renew by check or<br />
money order. Click on Download<br />
Renew Membership application.<br />
Mail the completed form to the<br />
address indicated. Your expiration<br />
date is listed on the address label<br />
of <strong>The</strong> <strong>Earth</strong> <strong>Scientist</strong>.<br />
If you would like additional information<br />
about NESTA membership, please<br />
email membership@ nestanet.org or<br />
call the NESTA Office at 720-982-8349<br />
ADDRESS OR EMAIL CHANGES<br />
It is very important that we have your<br />
current address and email. To update<br />
your membership information<br />
1. Go to www.nestanet.org<br />
2. Click on LOG IN<br />
3. Welcome to NESTA Member Menu<br />
Edit your profile – please use this<br />
to update your information. It is<br />
very important that this information<br />
be current.<br />
MEMBERSHIP EXPIRATION<br />
You will be notified via email regarding<br />
your membership renewal.<br />
If you wish further information<br />
regarding membership, please contact<br />
membership@nestanet.org<br />
Join NESTA Today!<br />
www.nestanet.org/cms/content/JOIN<br />
© 2012 National <strong>Earth</strong> Science Teachers Association. All Rights Reserved.
Page 38<br />
<strong>The</strong> <strong>Earth</strong> <strong>Scientist</strong><br />
Visit<br />
American<br />
Geosciences<br />
Institute<br />
Resources<br />
Your one-stop shop for marine<br />
science curriculum supplies.<br />
www.LeaveOnlyBubbles.com<br />
715-659-5427<br />
support@leaveonlybubbles.com<br />
Leave Only Bubbles is a subsidiary of “What If…?” Scientific, a teacherowned<br />
and operated earth science supply company founded in 1997.<br />
Excellence in <strong>Earth</strong><br />
Science Education<br />
• <strong>Earth</strong> Science Week<br />
• <strong>Earth</strong> Magazine<br />
• Curriculum resources<br />
• Teacher PD<br />
• Geoscience Career Info<br />
http://www.agiweb.org/geoeducation.html<br />
Advertising in the NESTA Quarterly Journal, <strong>The</strong> <strong>Earth</strong> <strong>Scientist</strong><br />
NESTA will accept advertisements that are relevant to <strong>Earth</strong> and space science education. A limited number of<br />
spaces for advertisements are available in each issue.<br />
Artwork<br />
We accept electronic ad files in the following formats: high-res PDF, TIFF or high-res JPEG. Files must have a<br />
minimum resolution of 300 dpi. Ads can be in color.<br />
Advertising Rates<br />
Full-page 7.5” w × 10” h $500 Quarter-page 3.625”w × 4.75”h $125<br />
Half-page 7.25” w × 4.75” h $250 Eighth-page 3.625”w × 2.375”h $75<br />
Submission Deadlines for Advertisements<br />
Submission dates given below are the latest possible dates by which ads can be accepted for a given issue.<br />
Advertisers are advised to submit their ads well in advance of these dates, to ensure any problems with the<br />
ads can be addressed prior to issue preparation. <strong>The</strong> TES Editor is responsible for decisions regarding the<br />
appropriateness of advertisements in TES.<br />
Issue Submission Deadline Mailing Date<br />
Spring January 15 March 1<br />
Summer April 15 June 1<br />
Fall July 15 September 1<br />
Winter October 31 January 1<br />
For further information<br />
contact<br />
Howard Dimmick<br />
Treasurer<br />
dimmick@esteacher.org<br />
© 2012 National <strong>Earth</strong> Science Teachers Association. All Rights Reserved.
Volume XXVIII, Issue 3<br />
Page 39<br />
<strong>The</strong> <strong>Earth</strong> <strong>Scientist</strong> (TES)<br />
MANUSCRIPT GUIDELINES<br />
NESTA encourages articles that provide exemplary state-of-the-art tested classroom<br />
activities and background science content relevant to K-12 classroom <strong>Earth</strong> and Space<br />
Science teachers.<br />
• Original material only; references must be properly cited according to APA style manual<br />
• Clean and concise writing style, spell checked and grammar checked<br />
• Demonstrates clear classroom relevance<br />
Format Specifications<br />
• Manuscripts should be submitted electronically – Microsoft Word (PC or Mac)<br />
• Length of manuscript should not exceed 2000 words.<br />
• All submissions must include a summary/abstract.<br />
• Photos and graphs: may not be embedded, but must be submitted as separate files, of<br />
excellent quality and in PDF, EPS, TIFF or JPEG format. 300 dpi minimum resolution.<br />
Color or black and white are both accepted.<br />
– References to photo/chart placement may be made in the body of the article identified<br />
with some marker: or [Figure 1 in this area].<br />
• Figures should be numbered and include captions (Figure 1. XYZ.).<br />
• Captions, labeled with a clear reference to their respective photo/chart/image, must be<br />
submitted in a separate file, or they may be placed at the end of the manuscript where<br />
they can easily be removed and manipulated by the editor.<br />
• If using pictures with people, a signed model release will be required for EACH individual<br />
whose face is recognizable.<br />
• Each article must include: author(s) names, the school/organizations, mailing address,<br />
home and work phone numbers (which will not be published), and e-mail addresses.<br />
Review<br />
Manuscripts are to be submitted to the Editor, via the email address at the bottom of<br />
the page. Manuscripts are reviewed by the Editor for content and language. <strong>The</strong> Editor is<br />
responsible for final decisions on the publication of each manuscript. Articles will then be<br />
submitted to our Article Reviewers. Manuscripts may be accepted as is, returned for minor<br />
or major revisions, or declined, based on the decision of the Editor. <strong>The</strong> Editor reserves the<br />
right to edit the manuscript for typographical or language usage errors.<br />
Page Charges<br />
A fee of $100 per page is charged to authors who have institutional, industrial, or grant<br />
funds available to pay publication costs. Authors without access to such funds are strongly<br />
urged to assist in defraying costs of publication to the extent their resources permit, but<br />
payment of page charges is not required from such authors. Payment of page charges has<br />
no bearing on the decision to accept or reject a manuscript.<br />
Copyright Transfer Waiver<br />
<strong>The</strong> lead author of the article shall submit a signed NESTA Copyright Transfer Waiver.<br />
<strong>The</strong> waiver form may be obtained from the NESTA web page. When completed AND<br />
signed it should be sent to the Editor. It may be sent as a printed original by US mail<br />
(address below), or as a pdf attachment via e-mail.<br />
We cannot begin the production process until this signed waiver has been received. Please<br />
help us to expedite the publication of your paper with your immediate compliance. If you<br />
have any questions, please e-mail the NESTA Editor or Executive Director as listed below.<br />
Submission Deadlines<br />
Issue Submission Mailing<br />
Deadline<br />
Date<br />
Spring December 15 March 1<br />
Summer March 15 June 1<br />
Fall June 15 September 1<br />
Winter September 30 January 1<br />
For further information contact:<br />
Tom Ervin, EDITOR<br />
tomervin@mchsi.com<br />
21799 282nd Ave., LeClaire, IA 52753<br />
Roberta M. Johnson, Executive Director<br />
rmjohnsn@gmail.com<br />
NESTA Membership<br />
Dues Structure<br />
Basic Membership (US and<br />
International) – includes access to<br />
online versions (only) of <strong>The</strong> <strong>Earth</strong><br />
<strong>Scientist</strong> (not including posters), monthly<br />
NESTA, E-News, access to TES archives<br />
online, NESTA Special Alert e-mailings,<br />
access to member-only sections of the<br />
website, and full voting privileges.<br />
• One year – $20<br />
• Two years – $40<br />
• Three years – $60<br />
Membership with Print Supplement* –<br />
includes a printed copy of TES mailed to<br />
you quarterly, frequently including poster<br />
inserts, in addition to Basic Membership<br />
benefits (US rates):<br />
• One year – $35<br />
• Two years – $68<br />
• Three years – $100<br />
* in Mexico and Canada, our rates for<br />
Membership with Print Supplement<br />
are slightly higher, because of mailing<br />
costs:<br />
• One year – $45<br />
• Two years – $88<br />
• Three years – $130<br />
Domestic Library Rate – includes print<br />
copies of <strong>The</strong> <strong>Earth</strong> <strong>Scientist</strong> only, and<br />
does not include NESTA membership<br />
• One year – $70<br />
Add Windows to the Universe<br />
Educator Membership Subscription<br />
to your NESTA membership (50%<br />
discount from non-NESTA member<br />
rates) – provides access to special<br />
capabilities and services on NESTA’s<br />
premier <strong>Earth</strong> and Space Science<br />
Education website available at http://<br />
www.windows2universe.org<br />
• One year – $10<br />
• Two years – $18<br />
• Three years – $24<br />
© 2012 National <strong>Earth</strong> Science Teachers Association. All Rights Reserved.
NESTA<br />
P.O. Box 20854<br />
Boulder, CO 80308-3854<br />
PLEASE INFORM US IF YOU ARE MOVING<br />
NON PROFIT ORG.<br />
U.S. POSTAGE<br />
PAID<br />
PERMIT #718<br />
SYRACUSE NY<br />
CHANGE SERVICE REQUESTED<br />
Determined parents - Adult Adelie penguins do not leave the nest even when faced with floods. Here several adults are sitting on eggs which are, in turn, awash<br />
in glacial melt water and will thus not survive. It is unknown how long these adults continued to nest these eggs. Credit: Photograph taken by Jean Pennycook on<br />
Dec 20, 2007 at Cape Bird, Ross Island, Antarctica.